FEDS Notes
October 12, 2021
Questions and Answers: The Information Content of the Post-FOMC Meeting Press Conference
Michiel De Pooter1
Introduction and Summary
Since 2011, the Chair of the Federal Reserve has held post-FOMC meeting press conferences. In a recent survey by the Hutchins Center at Brookings, which canvassed Federal Reserve watchers in academia and the private sector, respondents indicated that they view these live press conferences as the most useful of the Federal Reserve's communication tools, with more than 80 percent of respondents rating the press conferences as "useful" or "extremely useful."2 However, to date relatively little work has been done examining the content of the press conferences and their impact on financial markets. To help fill this gap, in this Note I first analyze the content and complexity of the press conferences using some common textual analysis tools. I then examine the market reaction to the press conferences in an event study using high-frequency market prices. I find that the press conferences provide investors with a significant amount of additional qualitative information for interpreting the FOMC's intentions regarding monetary policy, beyond the FOMC statement and Summary of Economic Projections. Furthermore, whereas FOMC statements are quite complex when assessed through the lens of standard readability formulas, the language of the Chair's opening statements and answers during the press conference has been much less complex and therefore easier to digest. I also find that the financial market reactions to the press conferences suggest that investors indeed view the press conferences as providing additional information beyond what is already contained in the post-meeting statement and SEP.
The post-FOMC Meeting Press Conference
Eight times a year, investors await the release of the Federal Open Market Committee's (FOMC/the Committee) statement following the conclusion of the Committee's regularly scheduled policy meetings. In its statement, the FOMC provides its latest assessment of the economy, announces policy decisions taken at the meeting, and gives indications of the likely future path of monetary policy.
On April 27, 2011, then-Chair Ben Bernanke became the first Chair in the Federal Reserve's history to begin regularly fielding questions from reporters following the conclusion of FOMC meetings and the release of the statement. During the first live FOMC post-meeting press conference, Chair Bernanke gave a roughly 1,600-word opening statement in the first 11 minutes, and then answered 20 questions and follow-ups during an almost 45-minute-long Q&A session with reporters.3 With it the Federal Reserve joined the ranks of other central banks, such as the Bank of England and the European Central Bank, which had already been holding press conferences.4
Between 2011 and 2018, the press conferences were held only after FOMC meetings associated with a Summary of Economic Projections (SEP). However, during his opening statement at the June 2018 press conference, Chair Powell announced that starting in January 2019, press conferences would be held after every FOMC meeting. Chair Powell explained this change as a practical step to foster a public conversation about what the Fed is doing to support a strong and resilient economy and that having a press conference after every scheduled FOMC meeting would provide additional opportunities to explain the Committee's actions and answer reporter questions.
To date—under Chairs Ben Bernanke, Janet Yellen, and now Jerome Powell—the Federal Reserve has held 55 press conferences; 42 following the release of the statement and updated SEP and, since 2019, 13 following the release of just the post-meeting statement.5 The scripted opening statement during the press conference is on average just shy of 10 minutes long, while the Q&A session is about 44 minutes long, with the Chair answering on average 22 questions and follow-ups.
Textual Analysis Insights from the Press Conferences
We can use simple textual analysis tools to gain further insight into the volume, content, and complexity of the qualitative information presented to the public during the live press conferences. Starting with a simple word count, Figure 1 shows the length of the opening statement (the darker-shaded bars) together with the length of the combined answers by the Chair to reporters' questions (the lighter-shaded bars), with the vertical dashed lines distinguishing the three different Fed Chairs since 2011.6
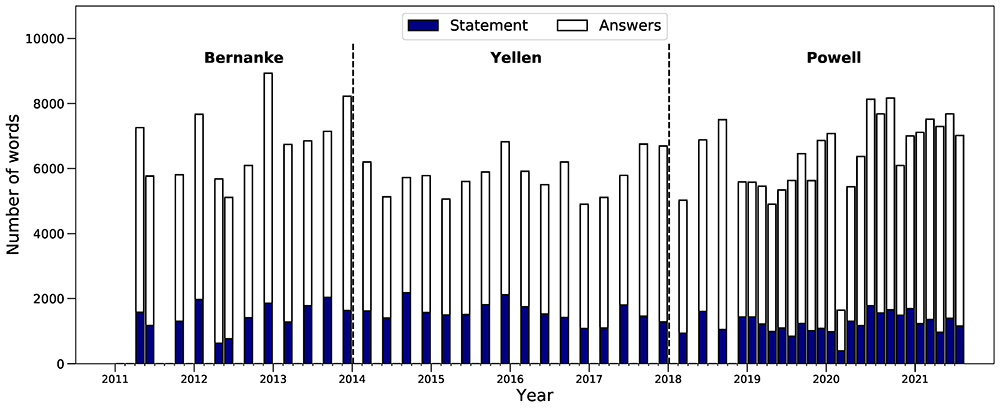
Notes: The stacked bars indicate the number of words in the opening statement and across all answers (questions by reporters are omitted). Between 2011 and 2018, there was a press conference only roughly every other FOMC meeting, while starting in 2019 there has been a press conference following every scheduled meeting.
Source: www.federalreserve.gov, author's calculations.
The figure illustrates that the amount of additional qualitative information from the press conferences is sizeable. The combined opening statement and press conference answers are about 6280 words long on average, much longer than the average 468-word length of the FOMC statement since 2011. The figure also shows that there has been some variability in press conference length across the three Chairs to date. Chair Bernanke's press conferences became increasingly long towards the end of his tenure, which reversed under Chair Yellen, although she tended to give somewhat longer opening statements. Following the move to a press conference after every meeting, Chair Powell's press conferences were comparatively short at the beginning in 2019 but their length increased towards 2020 and jumped up following the onset of the COVID-19 pandemic.7 Recent press conferences have remained among the longest in the sample.8
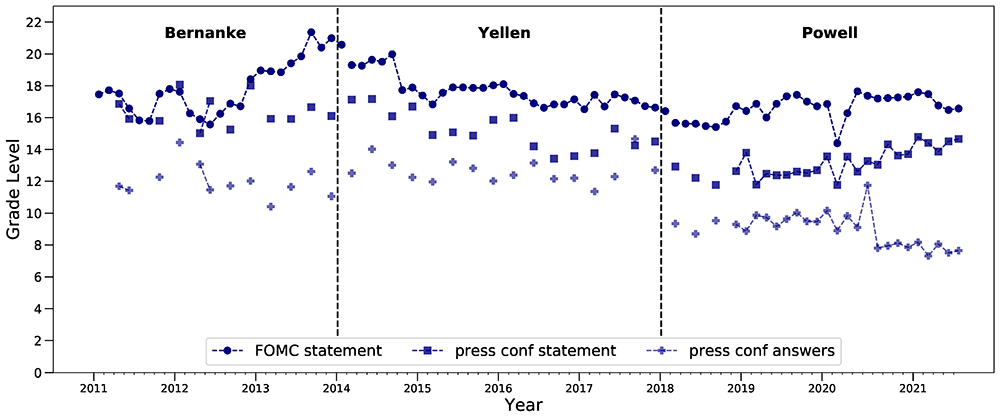
Notes: The markers indicate the Flesch-Kincaid grade level readability for the FOMC statement (the circles), the press conference's opening statement (the squares), and the Chair's answers during the Q&A with reporters (the plusses).The three colors highlight the three different Fed Chairs to date.
Source: www.federalreserve.gov, author's calculations.
More variation across Fed Chairs is apparent in Figure 2 where we assess the complexity of the language used in the press conference statement and answers using standard readability formulas such as the Flesch-Kincaid Grade Level index.9 These readability formulas score a text according to the grade level that a reader would need in order to read and comprehend the text.10 Hernández-Murillo and Shell (2014) showed that the complexity of the language used in the FOMC statement increased towards the end of Bernanke's tenure to a reading grade level of 20 to 21, equivalent to a least a doctoral degree level of education. The circles in Figure 2 illustrate that since then the Flesch-Kincaid grade level for the FOMC statement language gradually declined under Yellen and has averaged between grades 16-17 thus far under Chair Powell, equivalent to a bachelor's or master's degree level of education.
Whereas the FOMC statements are known to be complex, the grade level score of the language used in the opening statement at the start of the press conference has been noticeably lower, making the opening statements more easily accessible. As shown by the squares in Figure 2, starting in 2013, a gap opened up between the grade score of the FOMC statement and that of the opening statement of the press conference. This gap has grown further under Chair Powell to the point that currently the reading grade level of the opening statement at the press conference is equivalent to around that of a second-year undergraduate education level.
Finally, the plusses in Figure 2 illustrate the grade level of the answers by each Chair during the Q&A session. The various Chairs' language in answers to reporters' questions has been much less complex than the other communications that follow an FOMC meeting. Furthermore, Chair Powell's language has been notably less complex compared to that of Chairs Bernanke and Yellen, with the most recent press conference Q&As scored at around an eighth-grade reading level. While the Hutchins Center survey did not ask respondents directly why they view the post-meeting press conferences as one of the most useful Fed communication tools, the fact that—together with the increased frequency of the press conferences—the information provided by the Chair has become increasingly less complex over time will no doubt have played an important role.
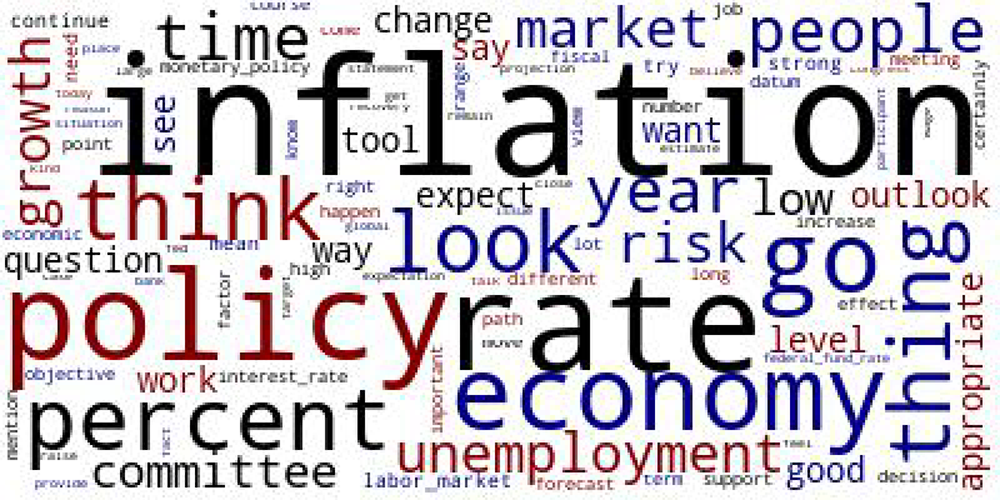
I turn next to what has been discussed during the press conferences over time, in particular during the Q&A portion because this is the non-scripted part of the press conference. For this I use two approaches: simple word clouds and results from topic modelling using Latent Dirichlet Allocation. Starting with the former, word clouds are a convenient way to visualize the content of a text. Figure 3 presents word clouds of the Q&A portion of the very first press conference, April 27, 2011 (the top panel), and that of a recent press conference, April 28, 2021 (the bottom panel). The size of a word in a word cloud is proportional to the number of times it is used.11
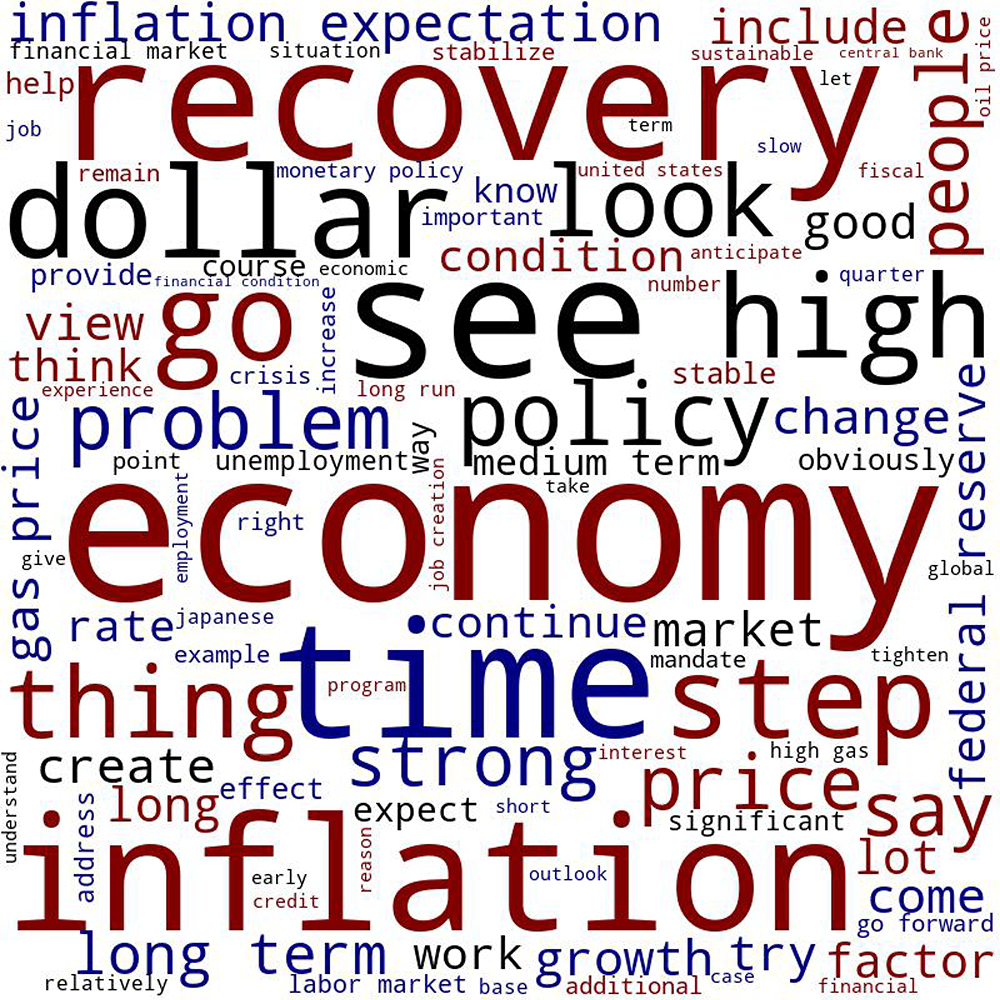
(a) April 27, 2011
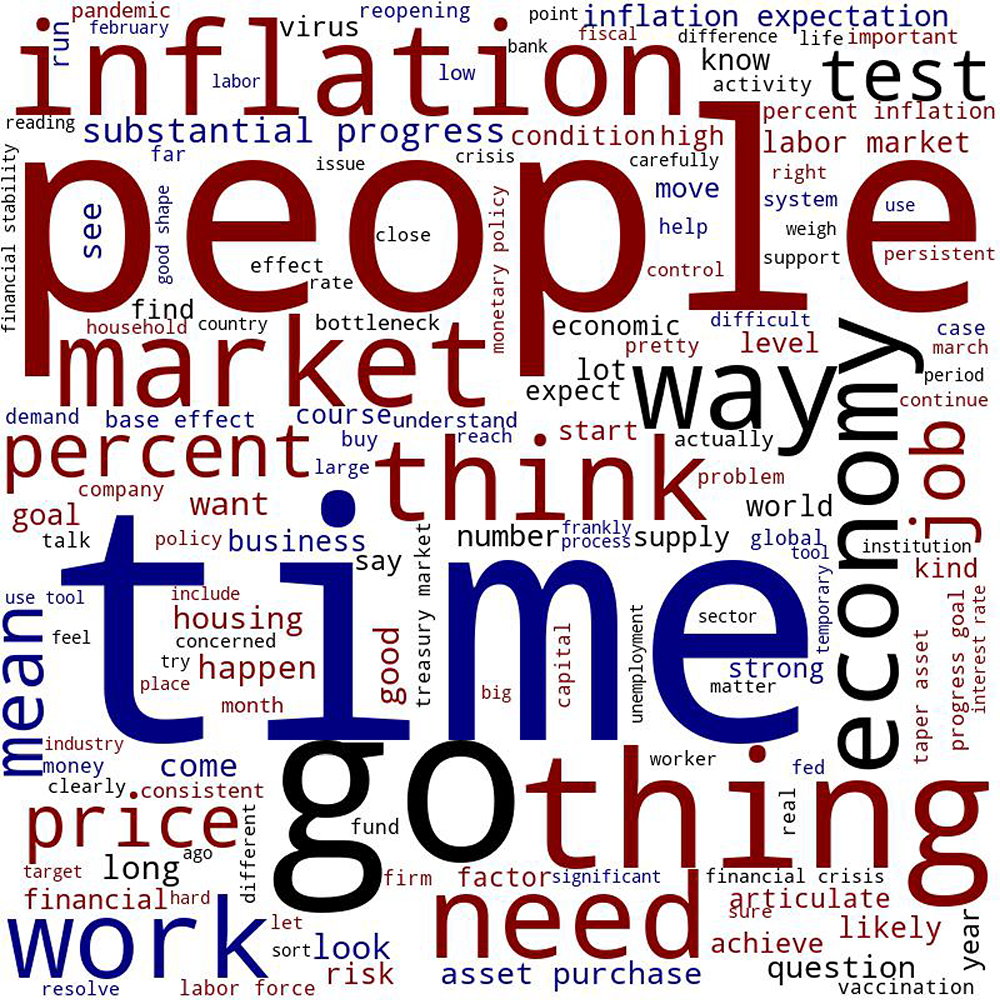
(b) April 28, 2021
Notes: Word cloud of the Q&A portions during the April 2011 press conference (top panel) and the April 2021 press conference (bottom panel). The size of a word in each word cloud is proportional to the number of times it is used.
Source: www.federalreserve.gov, author's calculations.
The figure shows the different themes during these press conference Q&As. The top panel emphasizes that the focus during the first press conference was on the economy and the then-ongoing recovery from the Global Financial Crisis. There were also several questions from reporters about inflation, which had been rising at the time. Finally, the dollar was mentioned 21 times during the first press conference amid questions about the depreciation of the dollar at the time. In contrast, the bottom panel reflects the recent focus amongst investors and policy markets on rising inflation. Furthermore, Chair Powell used "people" multiple times in the context of discussing the labor force, while the word "time" was used in the context of whether or not to start discussing the tapering of asset purchases and the Committee's average inflation target.
For a more systematic way of uncovering discussion topics during the press conference Q&As, I turn to topic modelling, in particular Latent Dirichlet Allocation (LDA). LDA was introduced by Blei, Ng, and Jordan (2003) and is a popular dimension-reduction technique in natural language processing. It posits that an unlabeled corpus of text can be represented as a finite mixture of a small number of common (but latent) underlying topics. LDA is an unsupervised approach that through a generative probabilistic model identifies topics, or meaningful clusters of words, that represent each document in terms of these clusters. LDA has been increasingly used in economics in recent years. For example, Bybee, Kelly, Manela, and Xiu (2020) use LDA to summarize economic conditions from a corpus of Wall Street Journal articles, whereas Hansen and McMahon (2016), Hansen, McMahon, and Pratt (2018), and van Dieijen and Lumsdaine (2019) have applied the technique to analyze FOMC statements, FOMC transcripts, and speeches by Fed officials, respectively. Here I apply LDA to uncover hidden themes within the press conference Q&A and to decompose press conferences in the fraction of time spent on each of these topics over time.
I apply LDA to the press conferences for the full 2011-2021 sample and follow Hansen and McMahon (2016) by allowing for a moderate number of possible topics (in this case ten). I include only the answers of the Q&A segments because this is the information provided by the Fed Chair to the public after each FOMC meeting in addition to the FOMC statement, SEP, and press conference statement.12 Whereas LDA helps to identify meaningful clusters of words, it is up to the researcher to interpret what these topics represent. Figure 4 shows that LDA can reduce the dimension of all the words used in answers during the press conferences to a meaningful (sub)set of topics. Of the 10 topics identified by LDA, topics 1, 2, 5, and 7 appeared the most interpretable. Figure 4 illustrates the key words in each of these, represented as word clouds. The word clouds for these topics seem most representative of a mandate/monetary policy, banking regulation, inflation, and independence topic, respectively—topics one would expect to come up frequently during press conferences. At the same time, LDA did not identify clusters of words that could be interpreted as, for example, related to aggregate demand.13
(a) Topic 5: Mandate/Monetary Policy
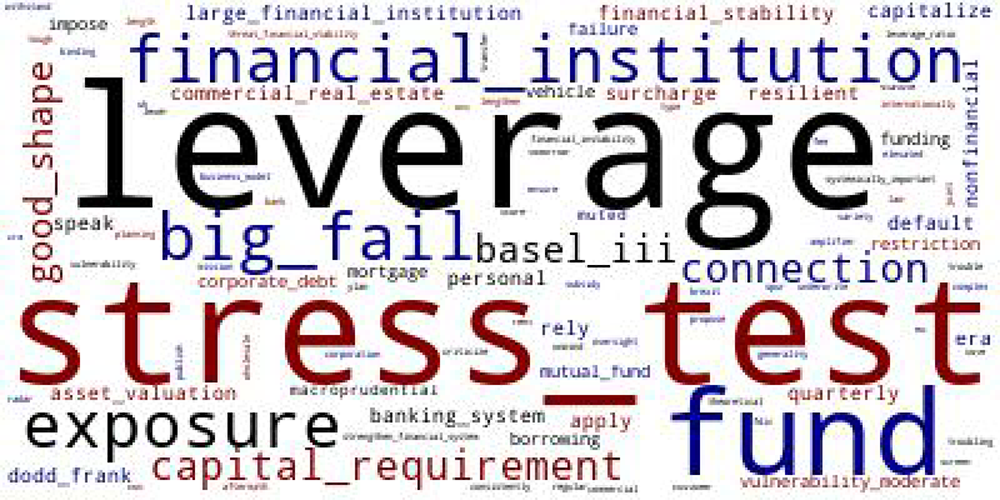
(b) Topic 2: Banking Regulation
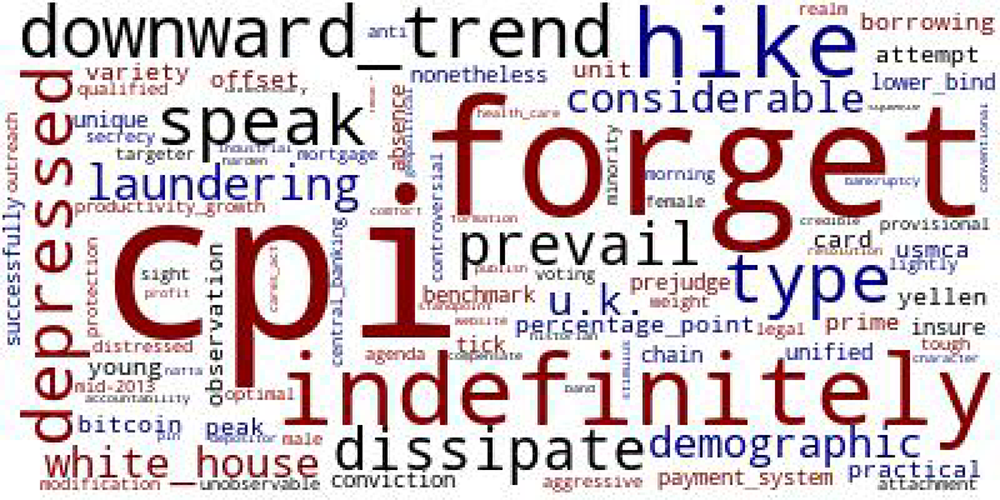
(c) Topic 1: Inflation
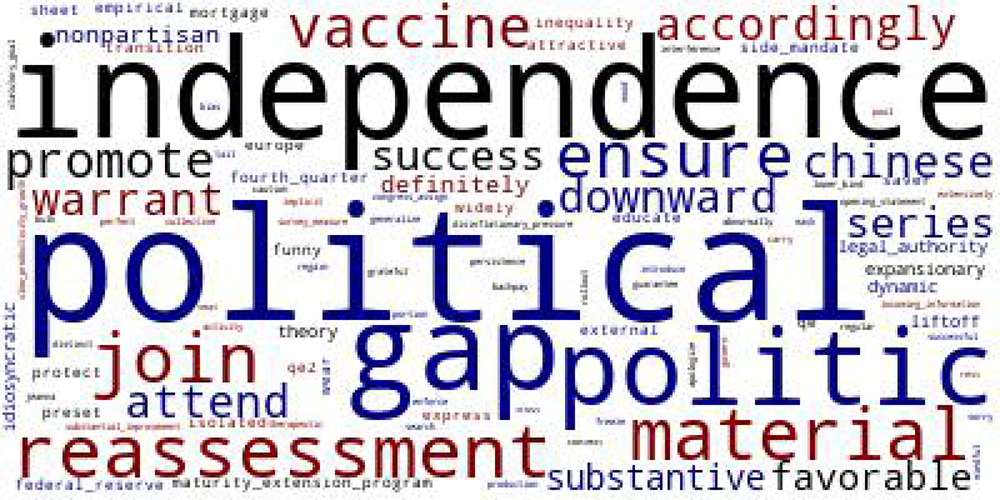
(d) Topic 7: Independence
Notes: Word clouds of key words of four topics identified by applying Latent Dirichlet Allocation on press conference answers during the Q&A portion of all post-FOMC meeting press conferences since 2011. The size of a word in each word cloud is proportional to the number of times it is used.
Source: www.federalreserve.gov, author's calculations.
Finally, I use the LDA output to determine which fraction of a Chair's answer during the Q&A is dedicated to each of the individual topics. This is a direct output from LDA and I aggregate these fractions by FOMC meeting. Figure 5 depicts the resulting time-series across FOMC meetings for the four named topics.14 Not surprisingly, the middle (gold) bars show that the FOMC's mandate and monetary policy is the predominant topic at every press conference. The amount of time spent on this topic varies over time, but on average it accounts for about 65 percent of the discussion of Chairs' answers to questions. The fraction of Q&As spent on discussing inflation (the blue bars at the bottom) shows notable time variation but is much smaller. However, judging from the key words in Figure 4, Panel A, the discussion of inflation (as well as labor market developments) is likely also captured in Topic 5. Finally, the banking topic (the parallel-hatched bars) also accounts for less of the overall discussion but has spiked at time to as much as 20 percent during some press conferences.
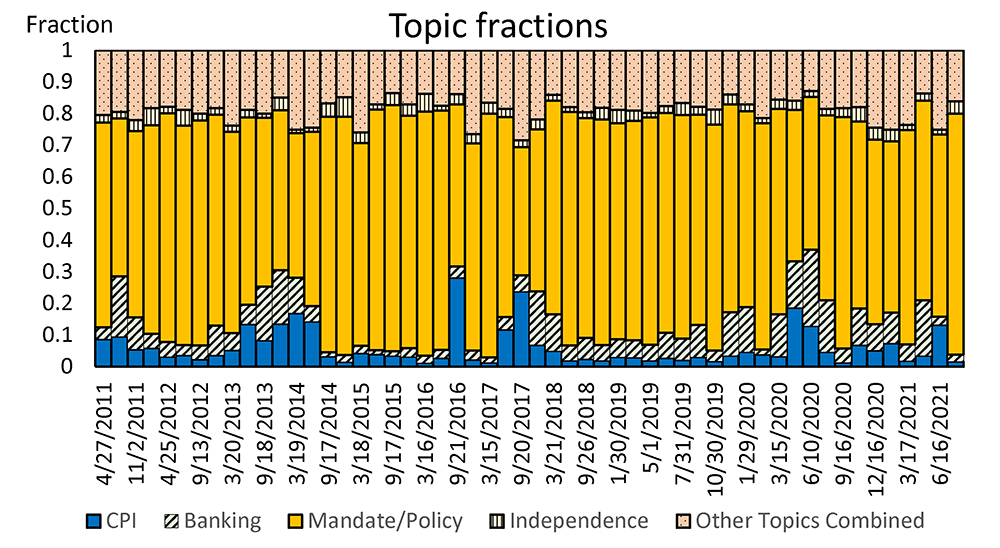
Notes: Topic fractions over time of topics identified by applying Latent Dirichlet Allocation on press conference answers during the Q&A portion of all post-FOMC meeting press conferences since 2011. Legend entries appear in the graph in order from bottom to top.
Source: www.federalreserve.gov, author's calculations.
Financial Market Reaction to Press Conferences
If investors and Fed watchers view the post-meeting press conferences as one of the most important Fed communication tools, one would expect financial market prices to react, and potentially significantly at times, to the Chair's opening statement and Q&A session. Figure 6 and 7, which show the market reaction in a range of asset prices around two FOMC meetings in 2014, indicate that this is indeed the case.
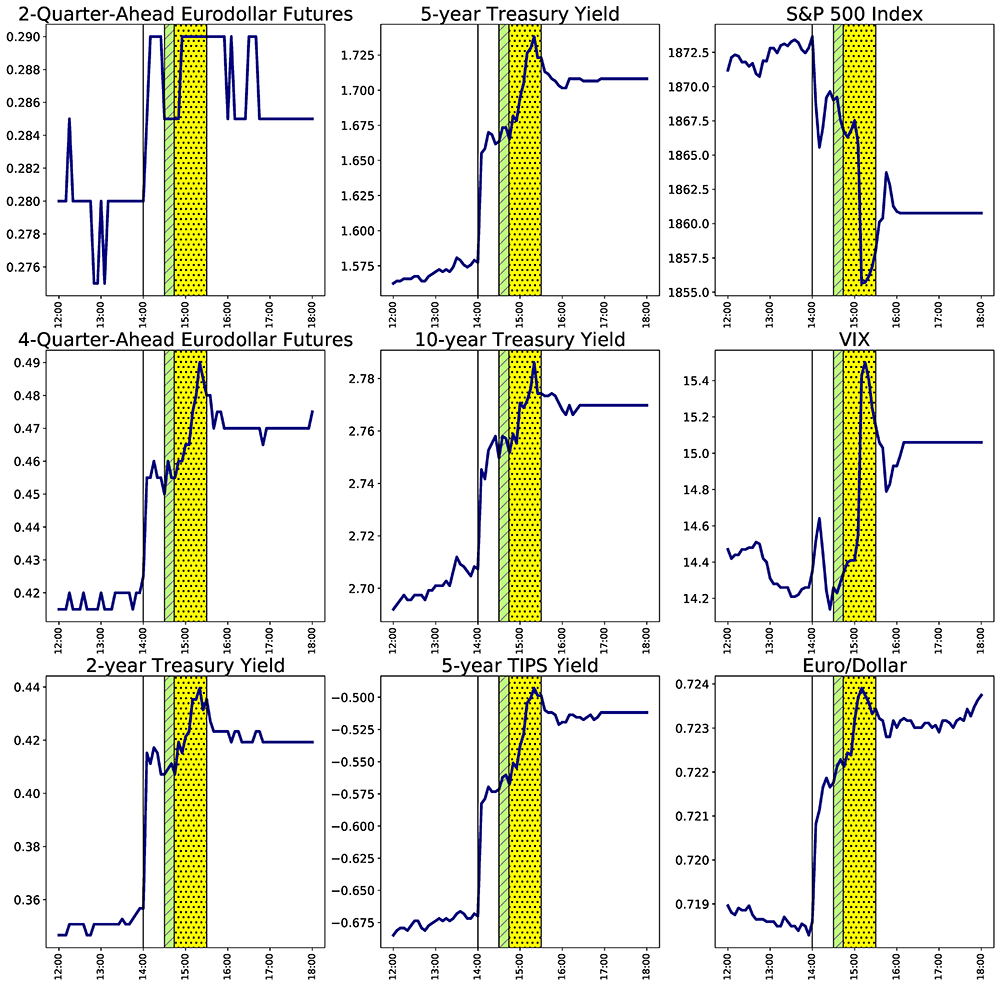
Notes: Market reaction on March 19, 2014 around the release of the FOMC statement and the Summary of Economic Projections at 2 p.m. (the first vertical line) and the press conference beginning at 2:30 pm using 5-minute data. The parallel-hatched area (in green) indicates the opening statement, the dotted area (in yellow) the Q&A session. The levels in the first two columns are in percent (with Eurodollar rates converted from prices). The euro/dollar in the bottom-right is expressed as the number of euros per dollar such that an upward move indicates dollar appreciation.
Source: Bloomberg Finance LP, Bloomberg Terminals (Open, Anywhere, and Disaster Recovery Licenses), Bloomberg Finance LP, Bloomberg Per Security Data License, and author's calculations.
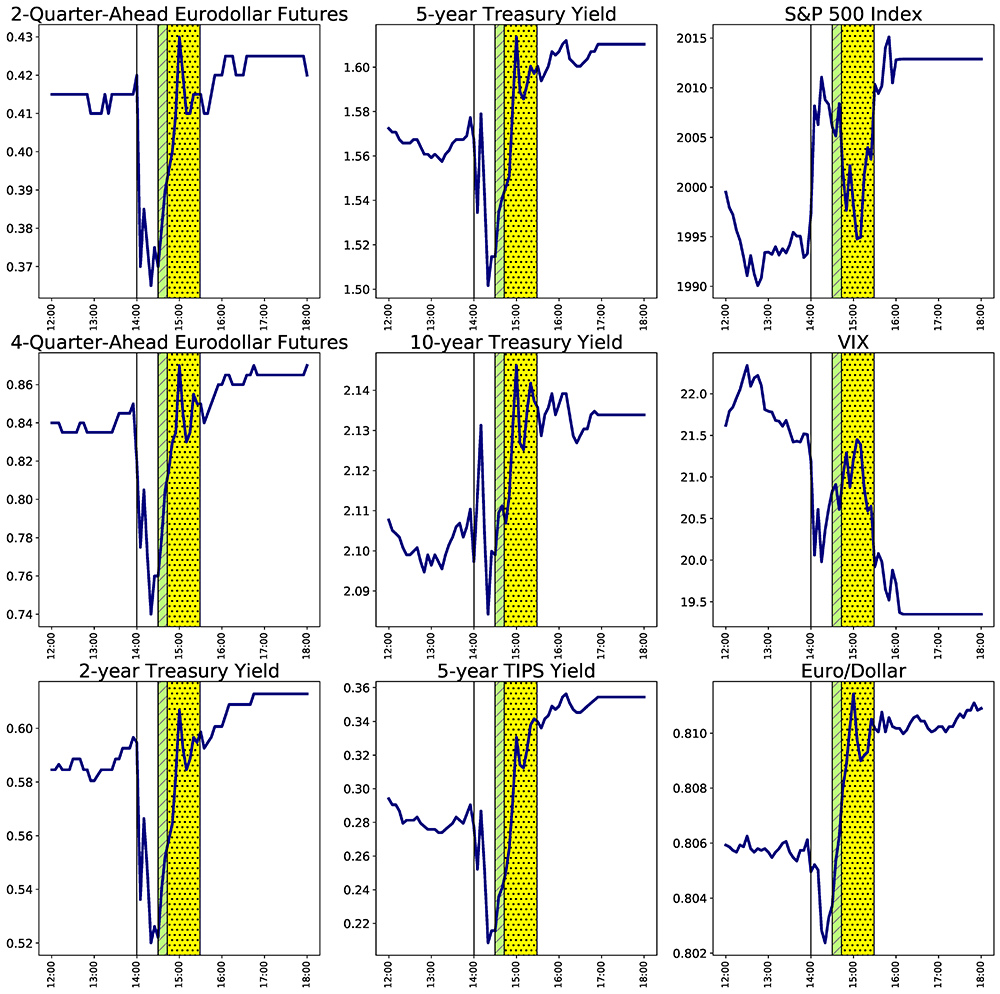
Notes: Market reaction on December 17, 2014 around the release of the FOMC statement and the Summary of Economic Projections at 2 p.m. (the first vertical line) and the press conference beginning at 2:30 pm using 5-minute data. The parallel-hatched area (in green) indicates the opening statement, the dotted area (in yellow) the Q&A session. The levels in the first two columns are in percent (with Eurodollar rates converted from prices). The euro/dollar in the bottom-right is expressed as the number of euros per dollar such that an upward move indicates dollar appreciation.
Source: Bloomberg Finance LP, Bloomberg Terminals (Open, Anywhere, and Disaster Recovery Licenses), Bloomberg Finance LP, Bloomberg Per Security Data License, and author's calculations.
Figure 6 illustrates how investors viewed the March 19, 2014 combined release of the statement and SEP as more hawkish than expected. The FOMC announced in the statement that it would further reduce the pace of asset purchases. It also shifted to qualitative forward guidance for the federal funds rate by removing its reference to an unemployment rate threshold and introducing that it would be appropriate at the time to maintain the target range of the federal funds rate "for a considerable time after the asset purchase program ends." While the Committee's changes to the FOMC statement were reportedly mostly in line with investor expectations, the rise in the SEP's medium "dot" for the federal funds rate at the end of 2015 and 2016 was larger than expected. As indicated by the left-most vertical line in each panel, following the 2 p.m. release, implied Eurodollar futures rates and yields on nominal and inflation-protected securities rose, and the S&P 500 index declined modestly. During Chair Yellen's subsequent press conference, rates rose further, and stocks in particular sold off further as Yellen commented on the meaning of the new "considerable time" forward guidance language in the statement. In particular, she stated that a rate hike might come as soon as six months after the end of the asset purchase program, which investors viewed as earlier than expected.
In contrast to Figure 6, which reveals that the direction of the price reaction to the statement and SEP was amplified during the press conference, Figure 7 indicates the opposite pattern. The FOMC statement and SEP on December 17, 2014 were seen as more dovish-than-expected, with yields falling and the S&P 500 index increasing. In its statement, the Committee changed its forward guidance language, stating that "it can be patient in beginning to normalize the stance of monetary policy." A decline in the median SEP "dots" for the federal funds rate reportedly also contributed to the dovish interpretation by investors. However, in this instance, these market moves more than reversed for Treasury yields during the subsequent press conference while the gain in stock prices all but fully retraced, when Chair Yellen indicated that the Committee considered it unlikely to begin raising interest rates "for at least the next couple of meetings." Investors interpreted this comment as indicating that a mid-2015 liftoff date, or even earlier, remained a possibility.
In order to examine the reaction in asset prices to the press conferences more systematically and to assess how much marginal information is provided during the press conference, conditional on the statement (and SEP) having already been released, I next conduct an event study analysis along the lines of Bernanke and Kuttner (2001), Gürkaynak, Sack, and Swanson (2005), among many others.15 In particular, I measure changes in asset prices from 10 minutes before the start of the press conference to 20 minutes after its completion. Moreover, I compare the change in prices during the press conference event window with the changes in asset prices in a 30-minute non-overlapping window around the release of the FOMC statement. For the latter, similar to Gürkaynak et al (2005), I use a "tight" window from 10 minutes before the release of the statement to 20 minutes after. No other news is typically released during the two events windows so that the price changes in these windows predominantly reflect a reaction to the statement and press conference, respectively.
Table 1 summarizes the results while Figure 8 provides the time series of surprises for the 2-year Treasury yield and the S&P 500 index. The first two columns in the table report the average of the absolute value of the reaction in a range of asset prices across all FOMC meetings with a post-meeting press conference since 2011, with the reaction around the statement in the first column and the reaction around the press conference in the second column.16 The results show that investors indeed respond to the information in the press conference. In particular, the average reaction in interest rates ranges from 1 to over 3 basis points, the reaction in the S&P 500 index is about 1/2 percent, while the dollar on average moves about 1/4 percent.
In order to assess how meaningful these moves are, I evaluate them against moves on non-FOMC meeting days. In particular, I first compute absolute asset price changes during the same statement and press conference event windows on all non-meeting days since 2013. From these, I then bootstrap a sample with replacement and compute percentiles. The superscripts *, **, and *** in Table 1 indicate that moves on days with a statement and/or press conference are larger than the 90th, 95th, or 99th percentile of this non-meeting-day distribution. Table 1 indicates that while not as exceptional as asset prices reactions following the statement—which are often in the 99th percentile—the press conference reaction is nevertheless nearly always in the 95th percentile of non-meeting-day moves, indicating that investors do indeed take additional signal from the press conference.
In the next two sets of columns, I split out meetings with and without a SEP release to assess whether the amount of perceived additional press conference information differs whether an SEP is released alongside the statement. The results reveal that the market reaction to the combined post-meeting statement and SEP is larger across all asset classes than when the Committee only releases its statement. In contrast, the market reaction to the press conference is larger for near-term rates when there is not an SEP, perhaps because investors cannot take signal from the federal funds rate path in the SEP and therefore look towards the press conference for additional guidance on the near-term path of monetary policy. The last column in Table 1 shows that the market reaction to meetings with only a post-meeting statement is the smallest on average. Of note, these include meetings during the 2013-2018 period when the federal funds rate was near the zero lower bound and investors appeared to generally expect significant policy changes to be announced at meetings that had an accompanying press conference. Finally, reinforcing the point from Figures 6 and 7, Figure 8 illustrates that the reaction to the press conference (the dark-shaded bars) can be sizeable and sometimes have an opposite sign from the statement reaction.17 The reaction in stock prices around the press conferences tends to be larger than around the statement and SEP, and this reaction has been notably negative at times.
Table 1: Event Window Response of Asset Prices to the FOMC Statement and Press Conference
| All press conference meetings | With SEP release | Without SEP release | Only Statement | ||||
|---|---|---|---|---|---|---|---|
| Statement | Press Conf | Statement | Press Conf | Statement | Press Conf | ||
| 2-quarter eurodollar | 2.48*** | 1.24** | 2.44*** | 1.17** | 2.58*** | 1.46** | 0.75** |
| 4-quarter eurodollar | 3.39*** | 2.19** | 3.74*** | 2.05** | 2.42*** | 2.58*** | 1.27** |
| 2-year Treasury | 3.18*** | 2.14** | 3.46*** | 2.02** | 2.39*** | 2.47** | 1.21** |
| 5-year Treasury | 3.86*** | 2.91** | 4.62*** | 2.96** | 1.78** | 2.78** | 1.72** |
| 10-year Treasury | 2.67*** | 2.30** | 3.18*** | 2.35** | 1.26* | 2.14* | 1.36** |
| 5-year TIPS | 4.90*** | 3.41** | 5.79*** | 3.83*** | 2.44*** | 2.25** | 1.90** |
| 10-year TIPS | 3.56*** | 2.60** | 4.21*** | 2.90** | 1.76*** | 1.77* | 1.50** |
| S&P 500 | 0.32** | 0.47* | 0.36** | 0.47* | 0.20 | 0.48* | 0.18 |
| euro/dollar | 0.31*** | 0.28** | 0.36*** | 0.31*** | 0.18** | 0.19** | 0.22*** |
| VIX | 0.59** | 0.74 | 0.64** | 0.66 | 0.46* | 0.94* | 0.26 |
| # meetings | 45 | 45 | 33 | 33 | 12 | 12 | 23 |
Notes: Average absolute change in selected asset prices around the release of the FOMC statement, SEP, and the post-meeting press conference during event windows that run from 10 minutes before the release (start) of the statement (press conference) until 20 minutes after the release (end) of the statement (press conference). Changes in implied futures rates and rates are in basis points, changes in the S&P 500 index and the euro/dollar exchange are in percent, change in the VIX is in percentage points. *, **, *** indicates that a price movement is larger than the 90th, 95th, or 99th percentile of a bootstrapped sample of size 10,000 of asset price movements during the same event windows on non-FOMC days. The sample includes FOMC meetings between March 2013 and July 2021.
Source: Bloomberg Finance LP, Bloomberg Terminals (Open, Anywhere, and Disaster Recovery Licenses), Bloomberg Finance LP, Bloomberg Per Security Data License, and author's calculations.
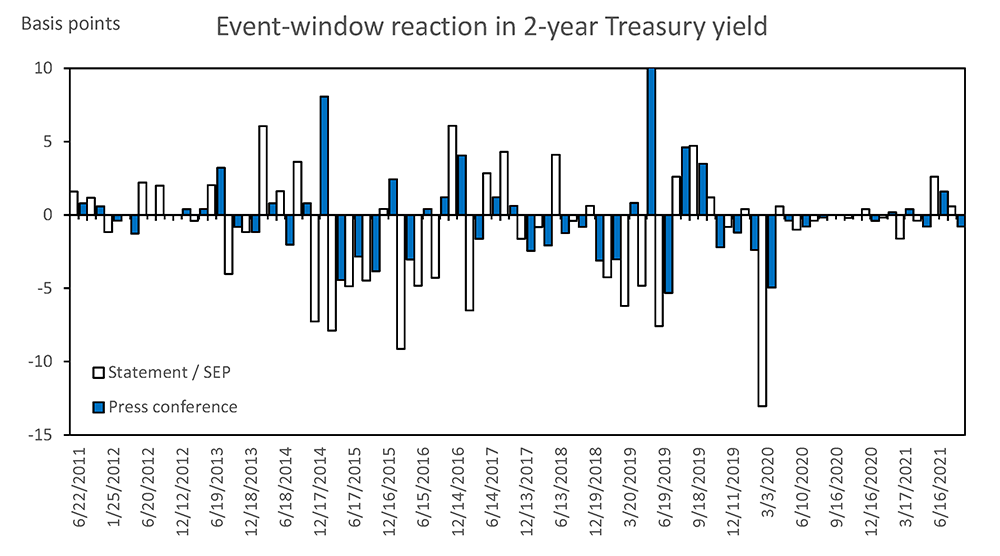
(a) 2-year Treasury Yield
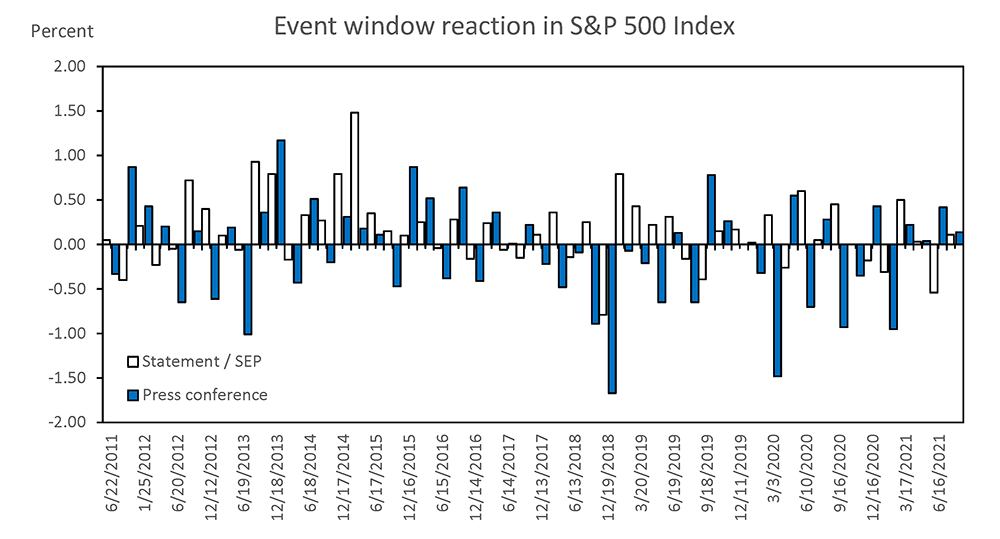
(b) S&P 500 Index
Notes: Reaction in the 2-year on-the-run Treasury yield (panel (a), in basis points) and the S&P 500 index (panel (b), in percent) around the release of the FOMC statement, SEP, and the post-meeting press conference during event windows that run from 10 minutes before the release (start) of the statement (press conference) until 20 minutes after the release (end) of the statement (press conference). The figures includes FOMC meetings between June 2011 and July 2021.
Source: Bloomberg Finance LP, Bloomberg Terminals (Open, Anywhere, and Disaster Recovery Licenses), Bloomberg Finance LP, Bloomberg Per Security Data License, and author's calculations.
References
Blei, D. M., A. Y. Ng, and M. I. Jordan (2003), "Latent Dirichlet Allocation." Journal of Machine Learning Research, 3, pp. 993-1022.
Blei, D. M. and J. D. Lafferty (2006), "Dynamic Topic Models," in Proceedings of the 23rd International Conference on Machine Learning, pp. 113-120.
Bybee, L., B. T. Kelly, A. Manela, and D. Xiu (2020), "The Structure of Economic News," working paper.
Cecchetti, S. G. and K. L. Schoenholtz (2019), "Improving U.S. Monetary Policy Communications," paper prepared for the Federal Reserve's Conference on Monetary Policy Strategy, Tools, and Communication Practices (A Fed Listens Event) on June 4-5, 2019.
Curti, F. and S. Kazinnik (2021), "Let's Face It: Quantifying the Impact of Nonverbal Communication in FOMC Press Conferences," Federal Reserve Bank of Richmond working paper.
van Dieijen, M. and R. L. Lumsdaine (2019), "What Say They About Their Mandate? A Textual Assessment of Federal Reserve Speeches," working paper.
Gómez-Cram, R. and M. Grotteria (2021), "Real-time Price Discovery via Verbal Communication: Method and Application to Fedspeak," working paper.
Gorodnichenko, Y., T. Pham, and O. Talavera (2021), "The Voice of Monetary Policy," NBER working paper 28592.
Gürkaynak, R. S., B. Sack, B., and E. T. Swanson (2005), "Do actions speak louder than words? The response of asset prices to monetary policy actions and statements," International Journal of Central Banking, 1(1), pp. 55–93.
Hansen, S. and M. McMahon (2016), "Shocking Language: Understanding the Macroeconomic Effects of Central Bank Communication," Journal of International Economics, 99(1), pp. 114-133.
Hansen, S., M. McMahon, and A. Pratt (20186), "Transparency and Deliberation Within the FOMC: A Computational Linguistics Approach," Quarterly Journal of Economics, 133(2), pp. 801-870.
Hernández-Murillo, R. and H. G. Shell (2014), "The Rising Complexity of the FOMC Statement," Economic Synopses, No 23, Federal Reserve Bank of St. Louis.
Kuttner, K. N. (2001), "Monetary policy surprises and interest rates: Evidence from the Fed funds futures market," Journal of Monetary Economics, 47(3), pp. 523–544.
Mimno, D., H. M. Wallach, E. Talley, M. Leenders, and A. McCallum (2011), "Optimizing Semantic Coherence in Topic Models," in Proceedings of the 2011 Conference on Empirical Methods in Natural Language Processing, pp. 262-272.
1. I thank Eric Engstrom, Josh Gallin, Don Kim, Ellen Meade, and Trevor Reeve for very helpful comments and suggestions. Return to text
2. See the November 2020 Report at the Hutchins Center on Fiscal and Monetary Policy at Brookings. Return to text
3. The Federal Reserve announced the start of the post-meeting press conference in an official release on March 24, 2011. At that time, press conferences were to be held four times a year to present the FOMC's current economic projections and to provide additional context for the FOMC's policy decisions. The introduction of press conferences was intended to "further enhance the clarity and timeliness of the Federal Reserve's monetary policy communication." Return to text
4. Table A2 in Cecchetti and Schoenholz (2019) summarizes notable changes in the FOMC's communications over time. Return to text
5. The analysis of this Note includes all press conferences up to and including the July 28, 2021 FOMC meeting. Of note, on April 27, 2011, the day of the very first post-FOMC meeting press conference, the FOMC statement was released at 12:30 pm, while the start of the press conference at 2:15 pm coincided with the release of the Summary of Economic Projections. During the remainder of 2011 and in 2012, the FOMC statement and the SEP were released at separate times, at 12:30 pm and 2 pm, respectively, while the press conference started at 2:30 pm. Since March 2013, the FOMC statement and SEP have been released jointly at 2 pm with the press conference starting at 2:30 pm. Return to text
6. To set up the corpus of press conference texts, I parsed the press conference transcripts that are available in pdf format on the Federal Reserve website. Return to text
7. The FOMC announcement and very short press conference on March 3, 2020 followed an unscheduled meeting on March 2. At that meeting, the FOMC lowered the target range for the federal funds rate by 50 basis points, which was announced in a much shorter-than-normal statement the next day at 10 a.m. During the subsequent 11-minute long press conference, the Chair answered just 10 questions and follow-ups. Return to text
8. I measure length in terms of the number of words spoken; while Chair Powell tends to say more words on average, he uses a below-average number of long (3+-syllable) and/or complicated words (i.e., words not in the Dale-Chall word list). As discussed next, this translates into a lower grade-level score for press conference communications. Return to text
9. Here I use the Flesch-Kincaid Grade Level (FKGL) measure because it is one of the most used. Others common measures include the Automated Readability Index, the Coleman-Liau Index, the Gunning-Fog Index, the Linsear-Write, and the SMOG Index; using these indexes instead yields similar results. Most readability formulas are based on two factors related to (i) sentence structure (average sentence length) and (ii) word structure (proportion of difficult words in a sentence). The Flesch-Kincaid measure calculates the grade level of a text as FKGL = 0.39 x average sentence length + 11.8 x average number of syllables per word – 15.59. Of note, correctly counting the number of syllables programmatically in a text is surprisingly unreliable. I found the Python package 'Big Phoney' to be quite accurate, see https://github.com/repp/big-phoney. Return to text
10. For a description of U.S. grade levels, see e.g. https://en.wikipedia.org/wiki/Education_in_the_United_States. Return to text
11. To prepare the press conference texts, I first separate the opening statement from the questions and answers segment of the press conference transcripts and remove the former. Next, I use Spacy with the 'en_core_web_lg' English pipeline to tokenize the text, remove stop words and punctuation, and lemmatize the remaining individual words. Finally, I use WordCloud to generate the word clouds, allowing for n-grams to be included. Return to text
12. I omit questions because these are often short and I found that they tend to introduce noise in the identified topics. In addition to the text-cleaning steps detailed earlier, I use a bag-of-words approach where I first augment individual words with commonly-occurring bi-grams and tri-grams, and then weight the resulting document-term matrix using term frequency-inverse document frequency to downweight both frequent and rare words. In total, the sample consists of 1199 answers by Bernanke, Yellen, and Powell, containing 99,140 tokens (words), 4677 of which are unique. I implemented LDA using gensim https://radimrehurek.com/gensim/. In the aggregation for Figure 5, I weigh each answer during a press conference by the length (in words) of that answer relative to the combined length of all answers in a Q&A. Return to text
13. In general, I found the themes of the various topics for this corpus to be somewhat unstable and quite dependent on the number of topics chosen, as well as on the LDA hyperparameters. In ongoing research, I am closely examining the robustness of the identified press conference topics, including by allowing for topics to evolve dynamically over time using Blei and Lafferty (2006) and as applied in van Dieijen and Lumsdaine (2019), as well as using alternative approaches to LDA for identifying latent topics. Return to text
14. The "Other Topics" category at the top of Figure 5, which consists of topics 3, 4, 6, 8, 9, and 10 combined, accounts for a non-negligible fraction of the discussion during press conferences. However, each of these topics consists of a general collection of key words that do not appear to share a single and easily identifiable common theme. Return to text
15. Gómez-Cram and Grotteria (2021) also examine the financial market reaction to the press conferences. Moreover, they provide a within-press conference analysis while I focus exclusively on the market reaction to the overall press conference communications. However, in contrast to Gómez-Cram and Grotteria (2021), I use a more up-to date sample that includes the press conferences since the start of the COVID-19 pandemic and look at a somewhat broader set of financial market prices. Other studies that examine the information content of the press conferences are Curti and Kazinnik (2021) and Gorodnichenko, Pham, and Talavera (2021), who focus on the effect on financial market prices of Fed Chairs' facial expressions and tone of voice, respectively. Return to text
16. I start the analysis with the March 2013 FOMC meeting, and therefore drop the meetings between April 2011 and January 2013. As explained in more detail in footnote 5, during those years the statement and SEP were released separately and released at different times than the FOMC's current practice of a joint release at 2 pm. In addition, during those early years the press conference started 15 minutes earlier than is currently the case. All this would complicate the bootstrap method I use in Table 2, which is why these meetings are dropped. However, the event study estimates in Table 1 are qualitatively similar when I do incorporate the earlier meetings (either with using one single event window that encompasses both the statement and SEP releases for meetings with both, or by summing market responses during separate event windows around the statement and SEP releases). Finally, I also dropped the press conference meeting on March 15, 2020, because the release of the statement came on a Sunday at 5 p.m., when markets were closed. All 45 remaining press conferences through the July 2021 meeting are included in the table. Return to text
17. For the FOMC meetings in 2011 and 2012, when the FOMC statement and SEP were released at different times, the bars in Figure 8 labelled "Statement / SEP" show the sum of the market reaction during event windows of 10 minutes before the release to 20 minutes after the release of the FOMC statement and 10 minutes before to 10 minutes after the release of the SEP, while the bars labelled "Press conference" show the market reaction during an event window of 5 minutes before the start of the press conference to 20 minutes after its conclusion. This ensures there is no overlap between the event windows for the SEP release and the press conference. Return to text
De Pooter, Michiel (2021). "Questions and Answers: The Information Content of the Post-FOMC Meeting Press Conference," FEDS Notes. Washington: Board of Governors of the Federal Reserve System, October 12, 2021, https://doi.org/10.17016/2380-7172.2997.
Disclaimer: FEDS Notes are articles in which Board staff offer their own views and present analysis on a range of topics in economics and finance. These articles are shorter and less technically oriented than FEDS Working Papers and IFDP papers.