FEDS Notes
October 06, 2021
Sizing hedge funds' Treasury market activities and holdings
Ayelen Banegas, Phillip J. Monin, and Lubomir Petrasek1
Hedge funds play an increasingly important role in U.S. Treasury (UST) cash and futures markets, a role that has been widely discussed following the March 2020 U.S. Treasury sell-off. In this note, we analyze hedge funds' holdings of UST securities and their UST market activities in normal times and in times of financial market stress using regulatory data from the SEC Form PF. We also develop an approach to decompose the reported aggregate UST exposures into UST holdings and derivatives exposures.
Overall, we find that UST exposures of large hedge funds doubled from early 2018 to February 2020, reaching $1.45 trillion and $0.94 trillion in long and short exposure, respectively. This doubling was primarily driven by relative value arbitrage trading and was supported by corresponding increases in repo borrowing. Moreover, our estimates indicate that UST holdings accounted for three-quarters of hedge funds' total long UST exposure in February 2020, while derivatives positions accounted for most of their short UST exposure. In addition, we show that hedge funds' Treasury and repo exposures have become increasingly concentrated over the recent years. For instance, the 50 funds with the largest Treasury exposure —representing less than 3% of qualifying hedge funds—accounted for 85 percent of the gross Treasury exposure and 90 percent of hedge fund repo and reverse repo in early 2020, up from around 70 and 80 percent, respectively, two years prior.
Our analysis also sheds light on the role of hedge fund UST selling during the March 2020 Treasury market turmoil. We find that large hedge funds' gross Treasury exposures declined by $426 billion in March 2020. After accounting for valuation changes, we estimate that they sold, on net, $173 billion of Treasury securities, and reduced their short derivatives positions by $232 billion. Furthermore, we document that most of the decline in Treasury holdings and short derivatives positions in March was driven by funds likely trading the cash-futures basis. Finally, we show that, although hedge fund selling of Treasury securities in Q1 2020, at just over $170 billion, was sizable, it was not outsized relative to the selling by other types of investors such as the foreign and mutual fund sectors.
Hedge funds play an increasingly important and diverse role in U.S. Treasury markets
Hedge funds are a heterogeneous set of institutions that interact with UST markets in several ways, including as arbitrageurs of different relative-value spreads and as investors in UST securities. As arbitrageurs, hedge funds execute relative-value trades that involve UST exposure on either one (e.g., swap spread arbitrage) or both sides of the relative-value trade (e.g., on/off the run arbitrage, UST cash/futures basis trade). Through their arbitrage activities, hedge funds link related markets including UST cash, futures, and because they typically finance their holdings in repo, UST repo markets. As investors, hedge funds hold UST exposures either as part of a broader investment strategy (e.g., risk parity funds), or as a source of liquidity.
Hedge funds' participation in the U.S. Treasury market increased notably in the years prior to the pandemic. According to our estimates, the UST holdings of so-called qualifying hedge funds (QHFs) – those with at least $500 million in assets under management – including both domestic and foreign funds but excluding derivatives positions, exceeded $1 trillion dollars at the end of 2019, a 72 percent increase from the levels observed in early 2018. QHFs account for 83 percent of gross hedge fund assets. As the largest hedge funds, they are required to make more frequent and granular disclosures on Form PF than smaller hedge funds, including quarterly disclosures of their exposures, assets, and liabilities. We therefore focus on the set of QHFs in our analysis. Although the estimated UST holdings of QHFs were smaller than those of U.S. mutual funds ($1.3 trillion) and buy-and-hold investors such as insurance companies and pension funds ($3.3 trillion), hedge funds' active investment styles and use of leverage place them among the most important participants in the U.S. Treasury market.2
Hedge funds' Treasury exposures have grown and become increasingly concentrated
The extent of hedge funds' Treasury market activities can be measured by their gross Treasury exposures, as reported in Form PF, and defined as the sum of their long and short exposures of both cash Treasury securities and UST derivatives. As shown by the left panel in Figure 1, hedge fund long and short UST exposures doubled in the two-year span between early 2018 and early 2020. As of February 2020, hedge fund gross UST exposures – long plus short – totaled $2.4 trillion. Hedge funds typically finance their cash Treasury holdings with repo, with the vast majority of hedge fund repo borrowing taking place in the bilateral repo market. Hedge fund repo borrowing, shown in the right panel, also doubled over the two years preceding the pandemic.
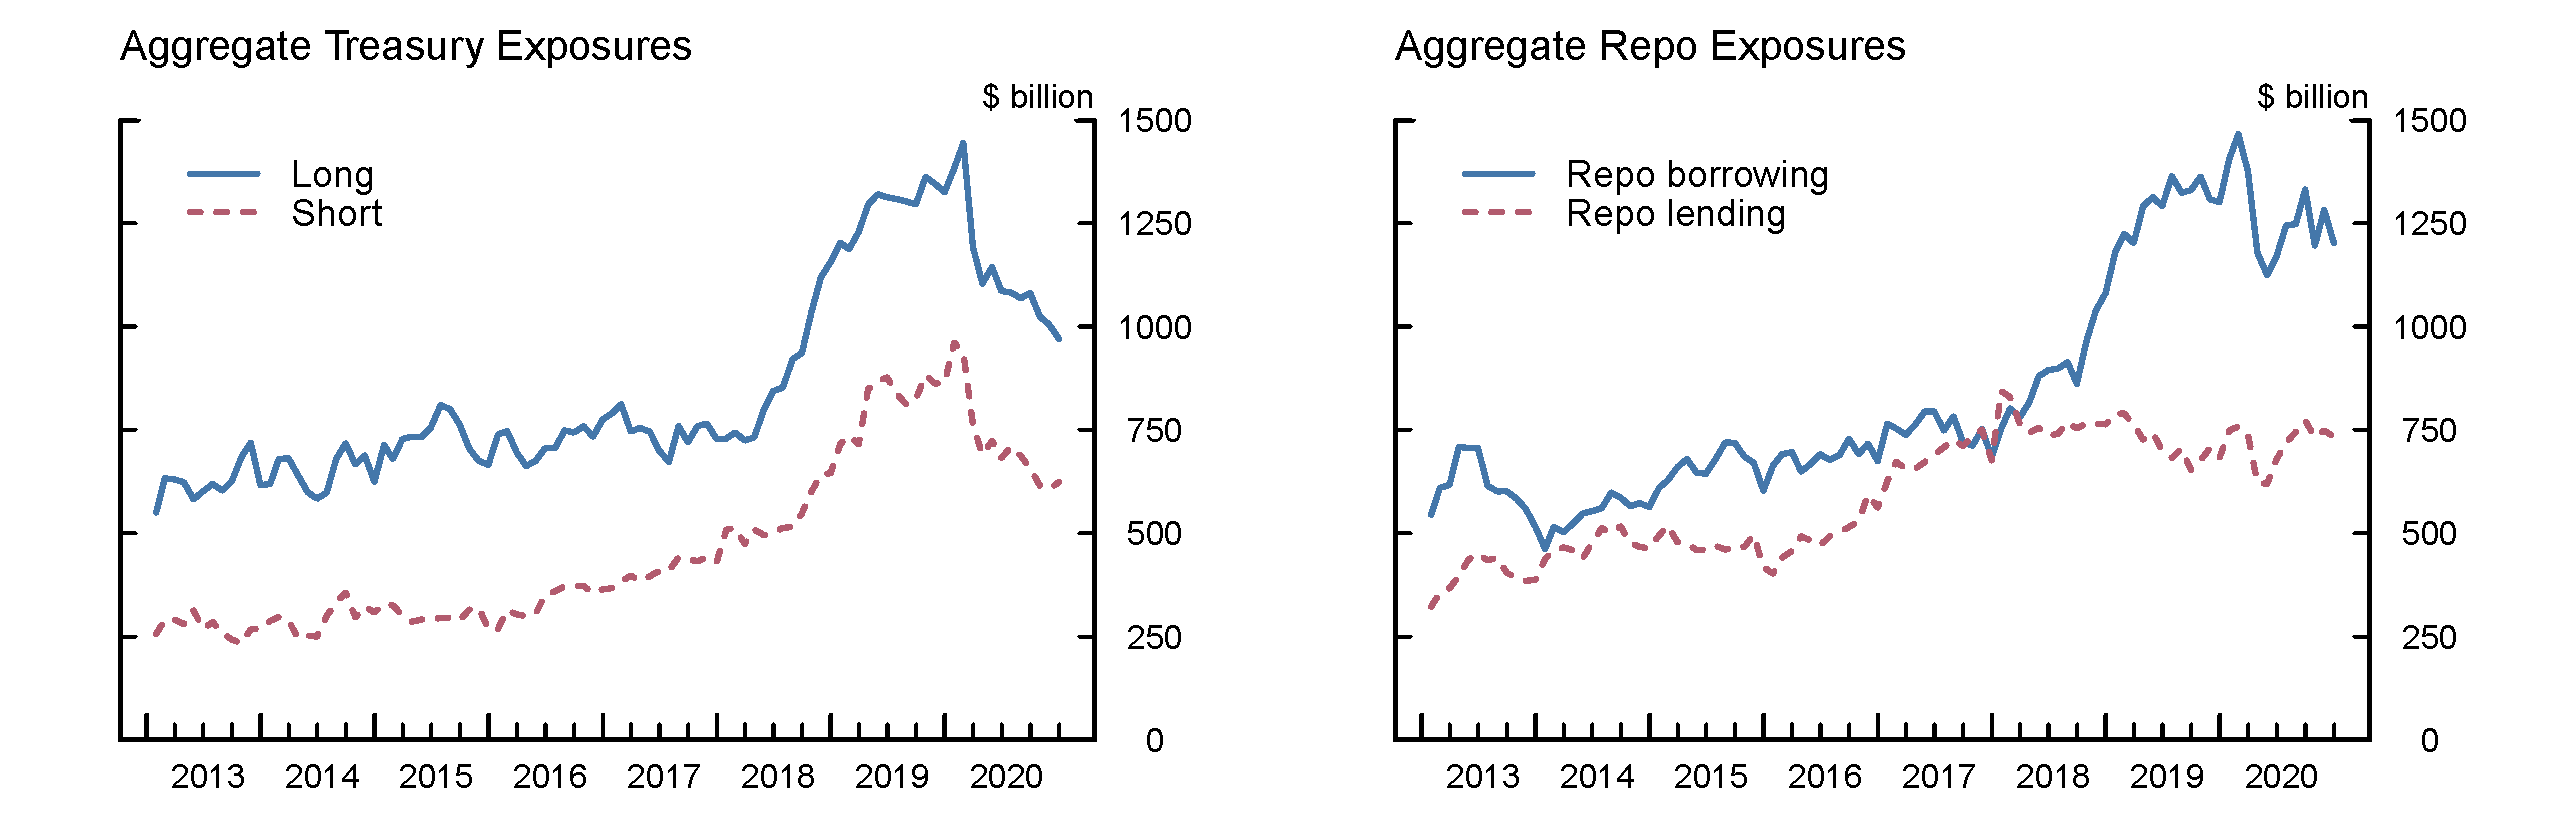
Note: The left panel shows monthly Treasury exposures of qualifying hedge funds, including securities holdings and derivatives exposure. The right panel shows monthly repo exposures of qualifying hedge funds.
Source: SEC Form PF.
Figure 2 demonstrates that hedge fund UST and repo exposures and leverage are concentrated in the top 50 funds ranked by gross UST exposure, and this concentration has increased over time. As shown in the left panel, the top 50 funds accounted for 85 percent of the total Treasury exposure and almost 90 percent of the repo activity of all QHFs in early 2020, although they managed only 12 percent of the net assets of these large funds. The right panel shows that these 50 funds were significantly more leveraged than an average QHF, and their leverage – measured as the ratio of gross balance sheet assets over net assets – has increased markedly since 2018.
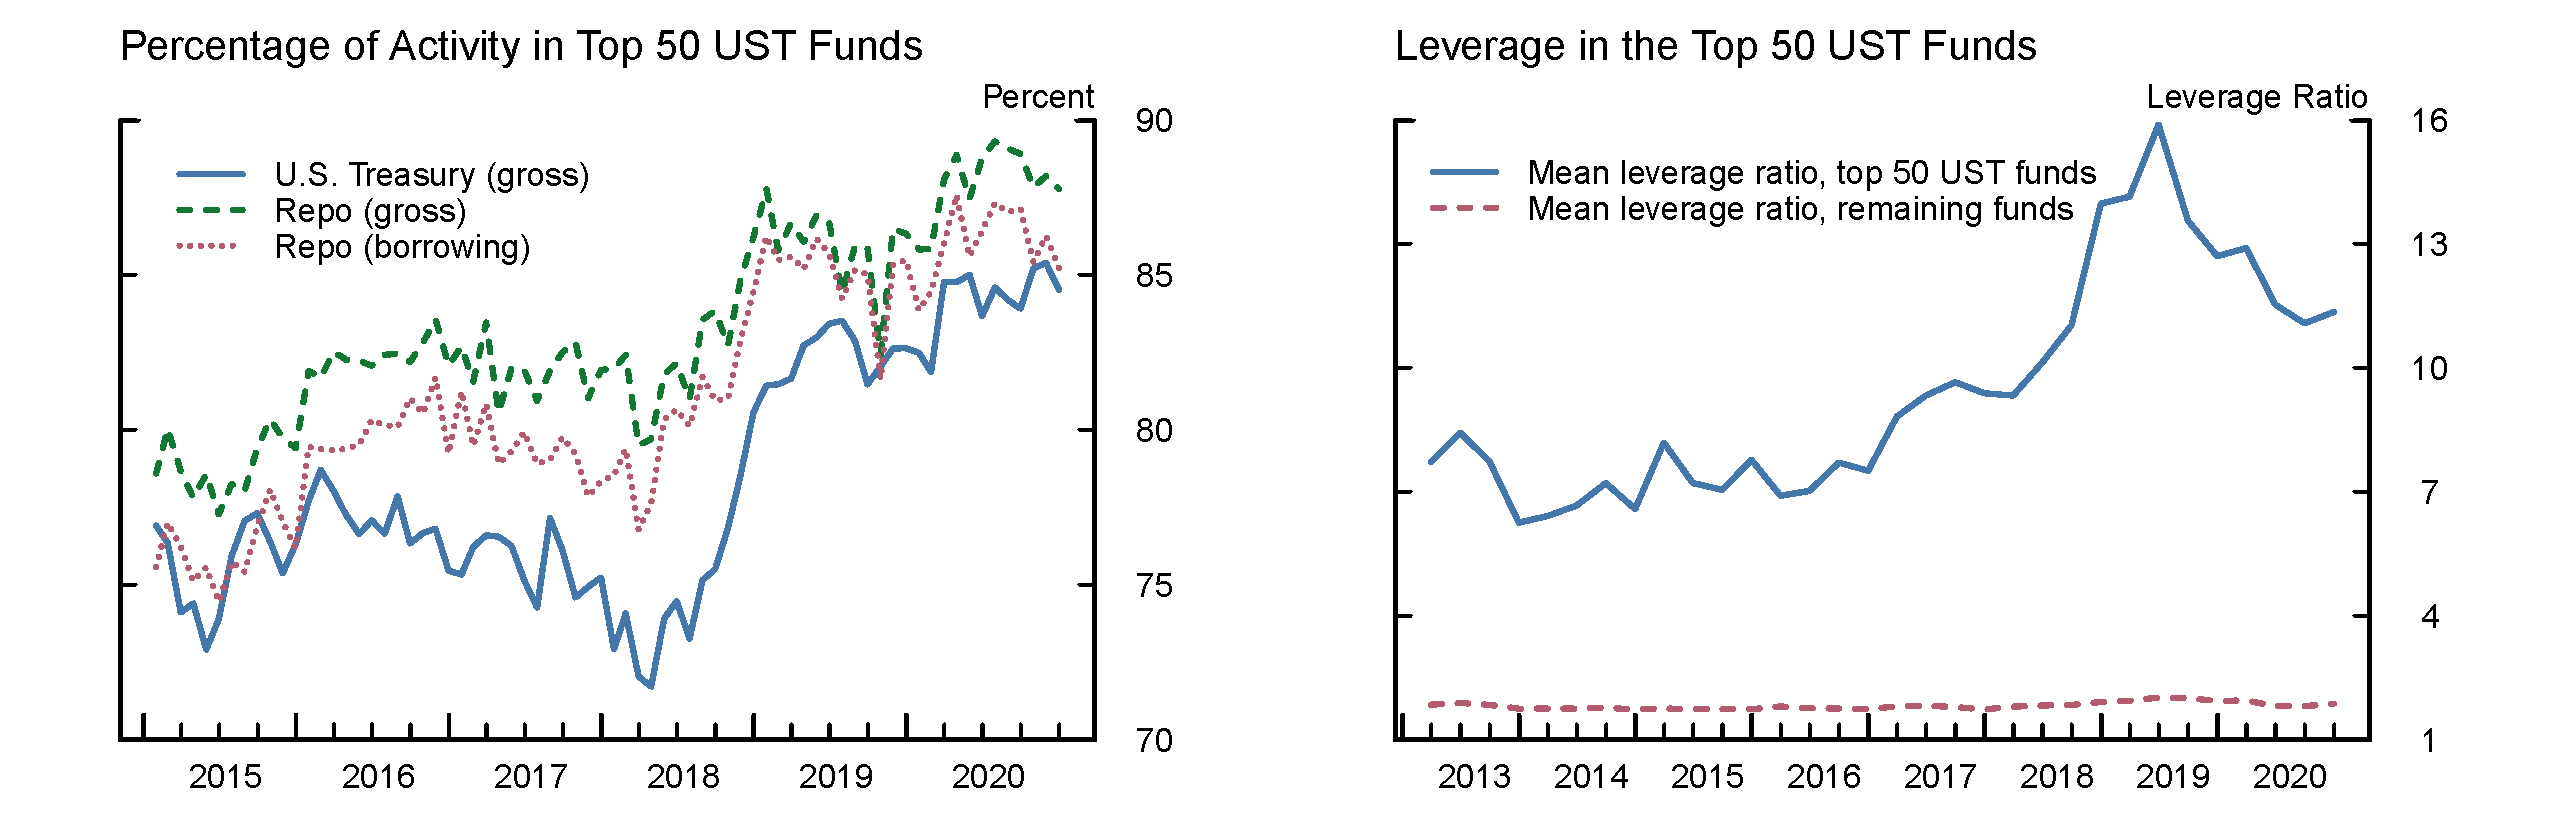
Note: Hedge funds are sorted each month by gross exposure to U.S. Treasury securities. The left panel plots the percentage of the total managed in the top 50 funds. The right panel plots equally−weighted mean balance sheet leverage ratios.
Source: SEC Form PF.
The growth in Treasury exposures was driven by arbitrage activities, mostly the Treasury cash-futures basis trade
The growth of hedge fund UST activity was mainly driven by an increase in arbitrage activity. Figure 3, left panel, provides a decomposition of gross UST exposures (the sum of long and short exposures in Figure 1) into arbitrage and directional exposures. Arbitrage exposures – those that are long/short balanced – accounted for most of the increase in Treasury exposures prior to the pandemic, and more than 68 percent of the total Treasury exposure in February 2020. Non-arbitrage, directional (mostly net long) exposures also increased prior to the pandemic, but still accounted for less than 32 percent of the total gross exposures of QHFs. The increasing importance of Treasury arbitrage is further confirmed by the increase in gross assets allocated to a relative value sovereign strategy shown in the right panel in Figure 3. As of 2019 Q4, almost $1 trillion in gross assets was allocated to relative value sovereign arbitrage strategies, about double the gross assets allocated to all other relative value strategies.
Figure 3: Treasury arbitrage activity and gross assets allocated to relative value sovereign strategies
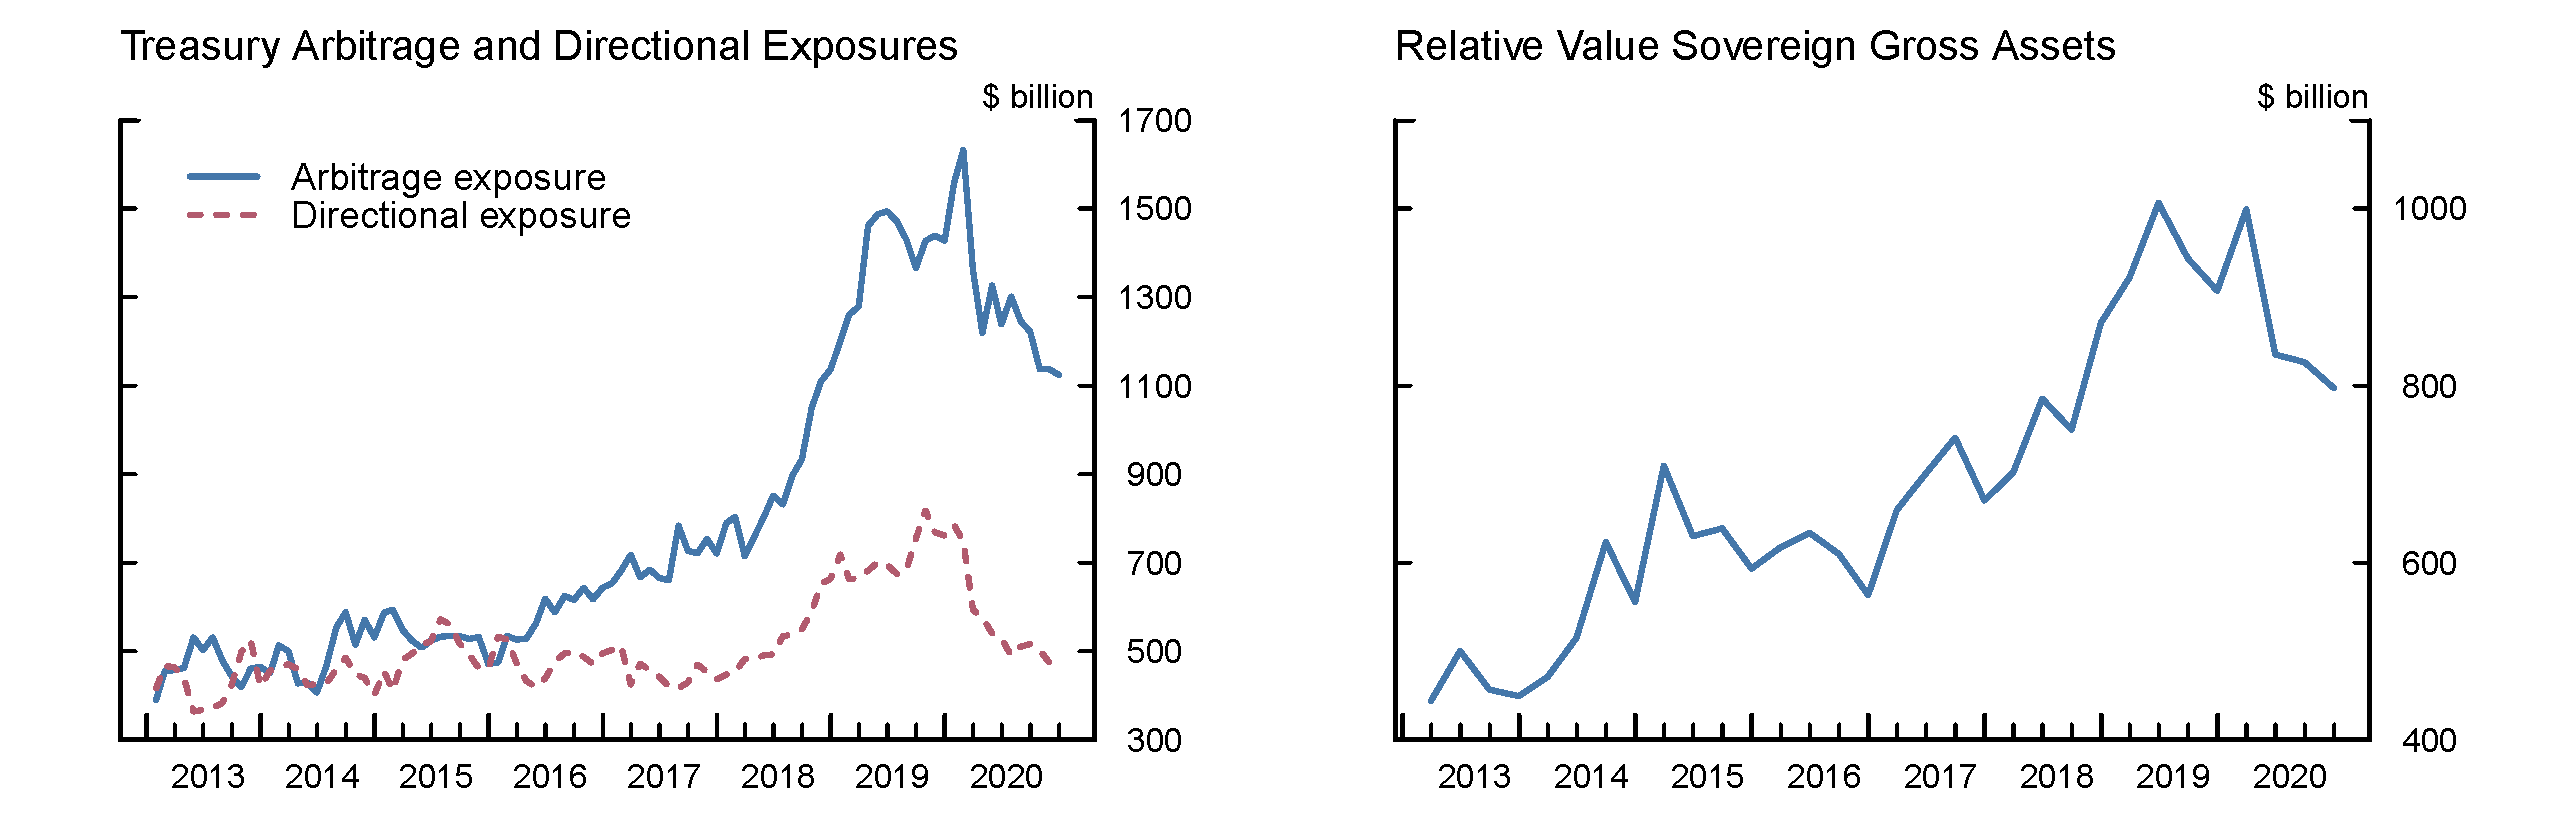
Note: Treasury arbitrage exposure is proxied by the minimum of long and short exposure. Directional exposure is proxied as the absolute net exposure.
Source: SEC Form PF.
What explains the increase in hedge funds' Treasury arbitrage activities between 2018 and 2020? Our analysis suggests that much of the increase is due to the increased popularity of the cash-futures basis trade among hedge funds. Treasury issuance rose following the Tax Cut and Jobs Act (passed November 2017). There was a coincident increase in demand from traditional asset managers for long Treasury duration exposure in futures, which was met by hedge funds.3 As shown in Figure 4, left panel, asset manager long UST futures positions increased notably over this period, about in line with the increase with leveraged fund short UST futures positions. Hedge funds were likely in a better position to meet the demand of asset managers for long UST futures during this period than other potential arbitrageurs such as broker dealers. Although dealer inventories of Treasury securities rose during this period, their selling of UST futures increased only modestly. Dealers' capital and balance sheet costs, internal risk limits, and regulatory constraints such as the SLR/eSLR, which came into effect in 2018, may have limited dealer willingness or capacity to intermediate between Treasury cash and futures markets, increasing the role of non-dealer arbitrageurs including hedge funds.
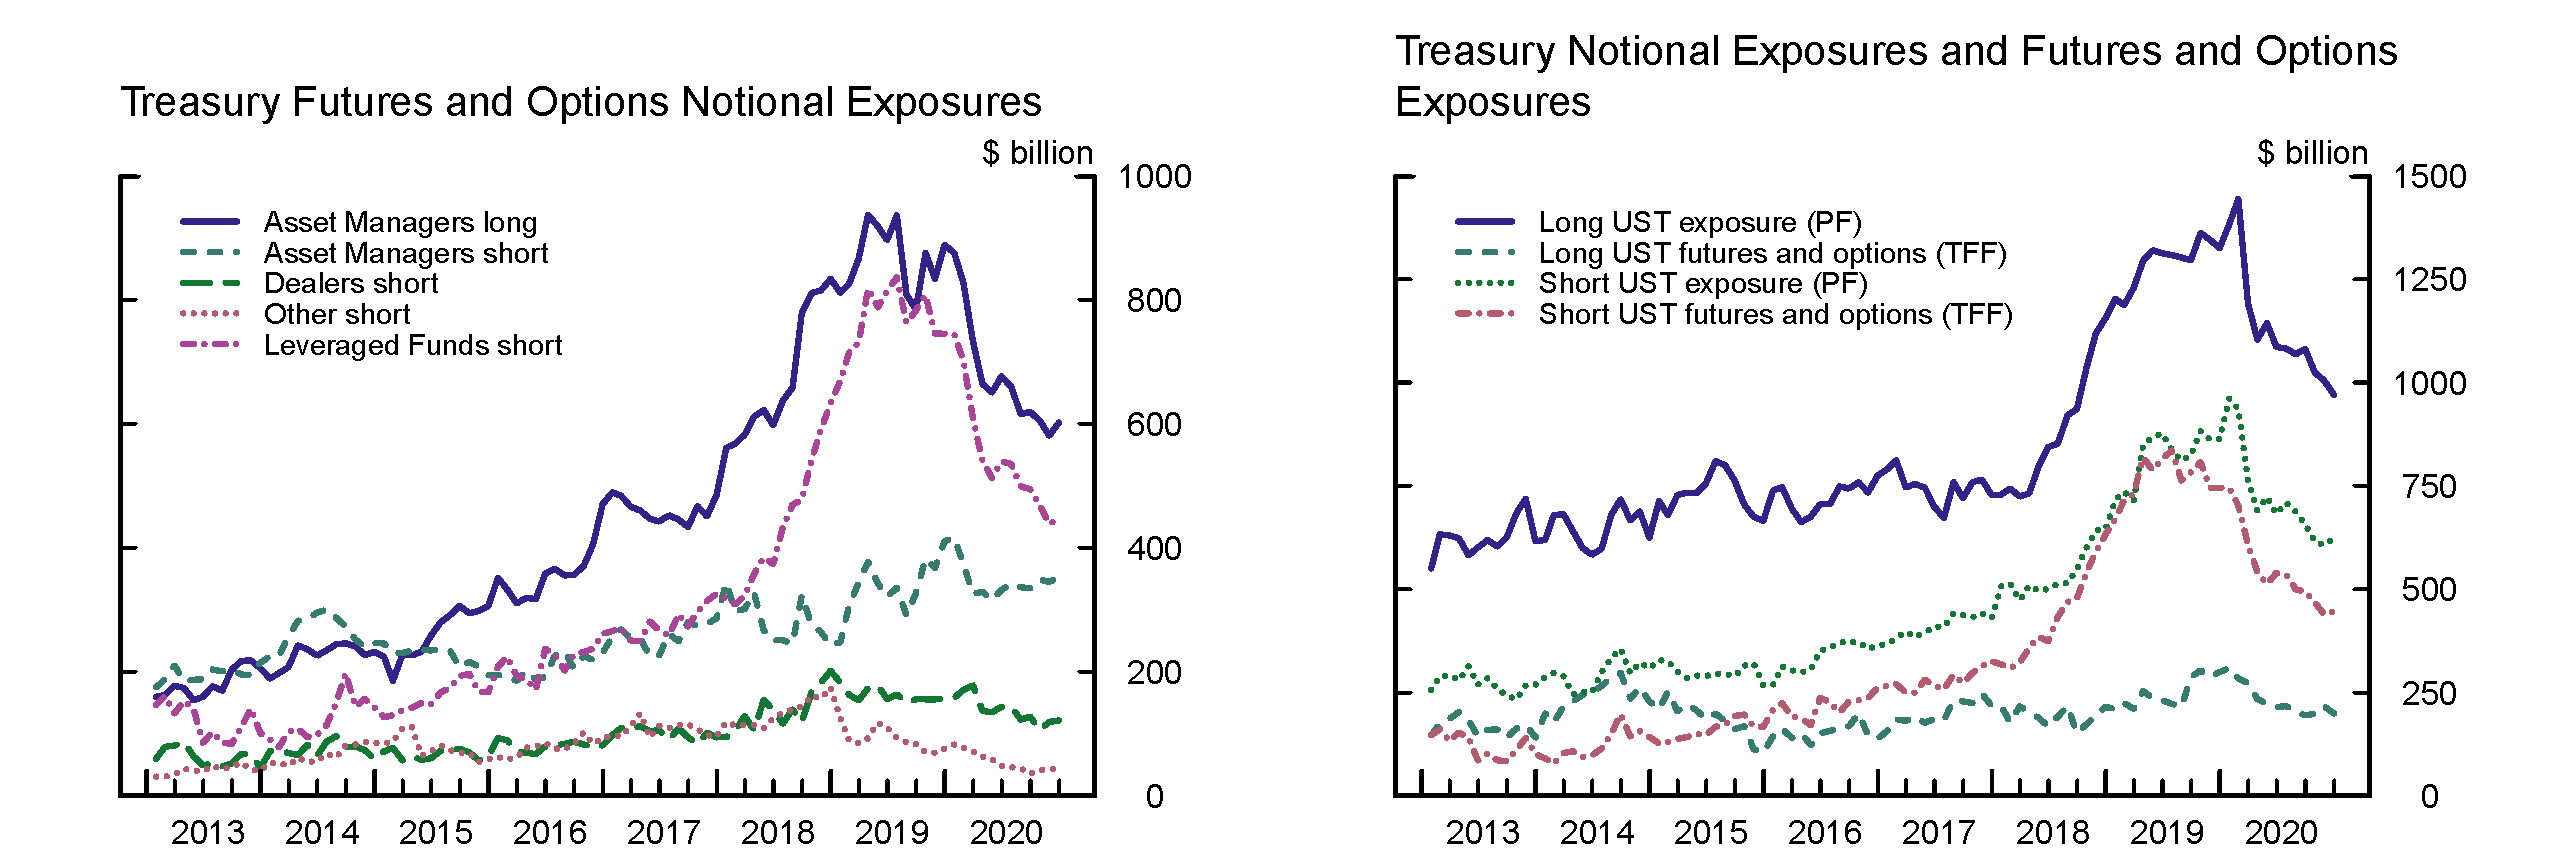
Note: The left panel shows monthly Treasury futures and options notional, by investor type, from CFTC Traders in Financial Futures. The right panel shows Treasury notional exposures and futures and options notional exposures.
Sources: SEC Form PF and CFTC Traders in Financial Futures.
The Treasury cash-futures basis trade became popular with hedge funds between mid-2018 and February 2020. As demonstrated in Figure 5, this trade involves shorting a UST futures contract and going long a UST note deliverable into that contract, with the note financed by repo. Given low haircuts on Treasury repo and low margin levels on Treasury futures,4 the cash-futures basis trade has the potential to be very highly leveraged. In addition, as repo financing supporting these trades is typically short-term and futures margins can change, arbitrageurs are exposed to margin risk and rollover risk inherent in maintaining the trade.
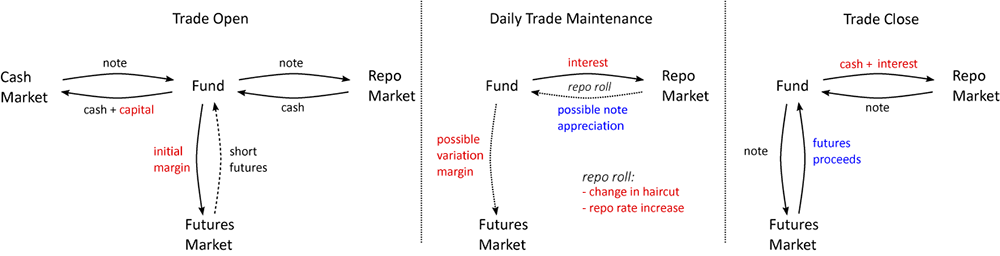
Reported Treasury exposures on Form PF combine UST holdings and derivatives exposures and repo borrowing data is not broken out by collateral class, making it difficult to measure the basis trade. However, suggestive evidence for the growth of the basis trade can be gleaned by comparing the data from Form PF and from the CFTC's Traders in Financial Futures (TFF) (Figure 4, right panel). Between 2018 and 2020, both long and short UST exposures reported in Form PF grew. The growth in QHFs' short positions aligns well with the increase in leveraged funds' short Treasury futures reported to the CFTC. In contrast, the growth in the long UST positions in Form PF cannot be explained by an increase in leveraged funds' long futures positions, which remained largely flat based on the CFTC data. In addition, as shown in Figure 1, right panel, repo cash borrowing and lending by QHFs, which had been approximately balanced before 2018, began to diverge and continued diverging into 2020. All three sets of evidence are consistent with increasing usage by leveraged funds of repo borrowing to finance the long position but with no corresponding reverse repo position supporting the short, as is typical in UST cash-futures basis trades.5
Estimated Treasury holdings of qualifying hedge funds peaked at $1.1 trillion in February 2020
Although the reported Treasury exposure on Form PF aggregates Treasury holdings and derivatives exposures, we can take advantage of other cross-sectional data available on the form to estimate a monthly fund-level decomposition of reported exposures into holdings and derivatives exposures. This estimation is done for both the long and short exposures. The estimation is based on the reported total UST and other fixed income exposures, and the reported repo and gross derivatives exposures. The intuition behind the algorithm is simple. Short fixed income exposures that are not supported by reverse repo are classified as short derivatives exposures. These exposures are allocated across fixed income instruments based on the reported total exposures for each instrument and assumptions about how these exposures are typically financed. Long fixed income derivatives exposures are estimated as the difference between the reported gross derivatives exposures and the estimated short fixed income derivatives exposures, and then allocated to UST and other fixed income instruments in a similar way as the short exposures. We then define long (short) UST holdings as the difference between the reported long (short) total UST exposures and the estimated long (short) UST derivatives exposures. This estimation procedure allows for the fact that not all of hedge funds' holdings of UST securities are financed in repo, as some Treasury holdings are used as liquidity buffers. Details for the algorithm are available in Appendix 1.
Figure 6 shows the decomposition of QHFs' UST exposures into securities holdings and derivatives exposures. Based on these estimates, securities holdings accounted for 76 percent of hedge funds' long UST exposures in February 2020, or $1.1 trillion, with most of the increase in these exposures taking place prior to the outbreak of the pandemic. In contrast to long UST exposures, most of the short UST exposures are derivatives positions, with short securities positions accounting for only 19 percent, or $179 billion, of short UST exposures as of February 2020.
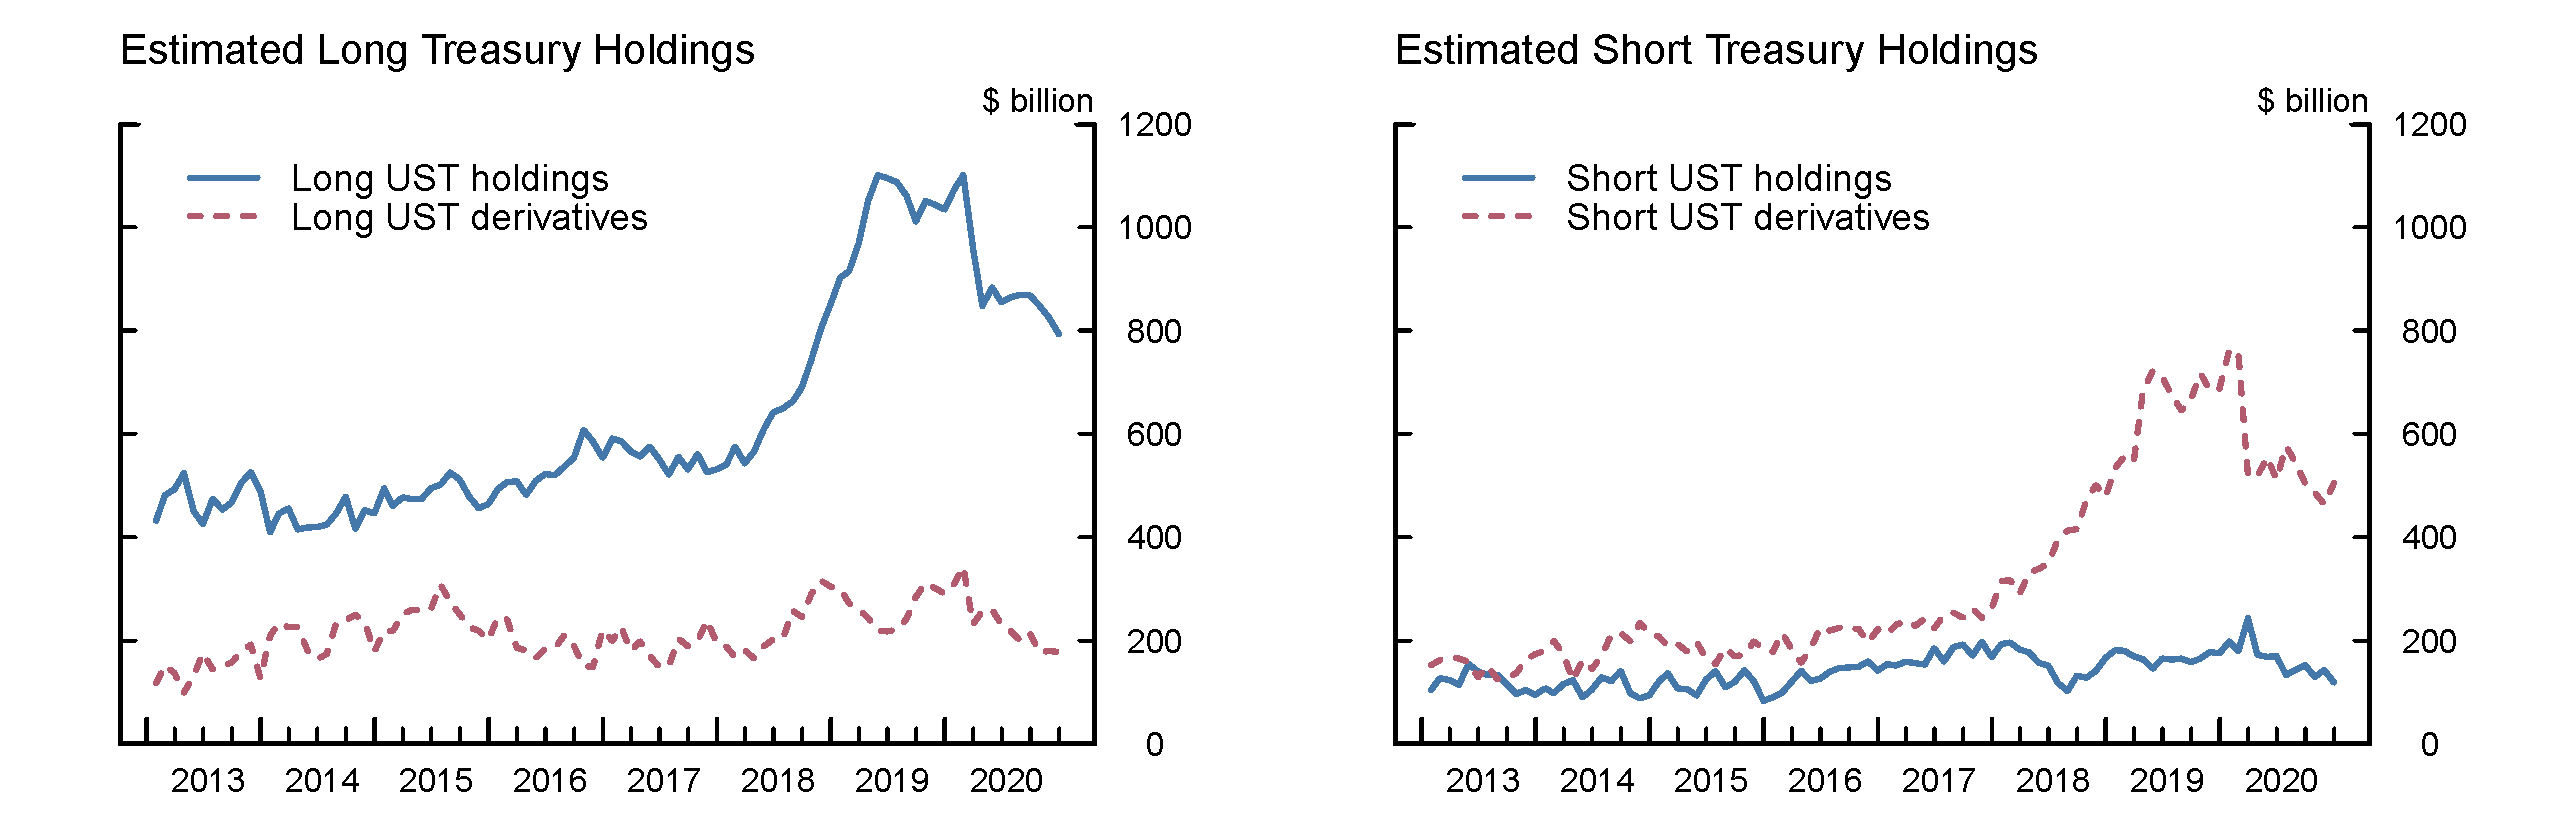
Sources: SEC Form PF, authors’ calculations.
The cash-futures basis trade accounted for most of the growth in hedge fund Treasury exposures (and holdings) before March 2020
We follow an algorithm developed by Kruttli et al. (2021) to classify likely basis traders based on how the trade is likely to be reflected in Form PF. Specifically, for each fund, we consider the correlation between the fund's Treasury arbitrage positions, proxied by the long-short balanced part of its Treasury exposure, to its net repo borrowing. The correlations are estimated between January 2018 and February 2020, a period when the basis trade was most popular with hedge funds. If this correlation is positive and statistically significant, and if the fund indicates that it follows either a relative value sovereign strategy or a global macro strategy, then we classify the fund as a likely basis trader.6 Further details are in Appendix 1. We note that, in addition to conducting the basis trade, funds classified as likely basis traders may have had Treasury exposures for other uses or trades.
Based on this estimation procedure, we arrive at Figure 7, which depicts the previously estimated long holdings of Treasury securities in blue, the portion financed in repo in orange, and the estimated short Treasury derivatives positions in green, for both likely basis traders (left panel) and other Treasury traders (right panel). As shown by the left panel, these series are highly correlated for likely basis traders and their magnitudes align well, as the trade mechanics would suggest. In contrast, for funds classified as other UST traders, long UST holdings and short UST derivatives positions do not follow the same pattern, and less than a half of their long UST positions is financed in repo.
Under the assumption that all the Treasury exposures of funds classified as likely basis traders were due to that trade, our estimates suggest that the basis trade grew by $400 billion between 2018 and early 2020, accounting for about 2/3 of the increase in qualifying hedge funds' Treasury exposures during that time. Moreover, basis trades came to represent most of the holdings of Treasury securities by hedge funds, an indication that hedge funds were essentially warehousing Treasury securities on behalf of non-hedge fund asset managers.
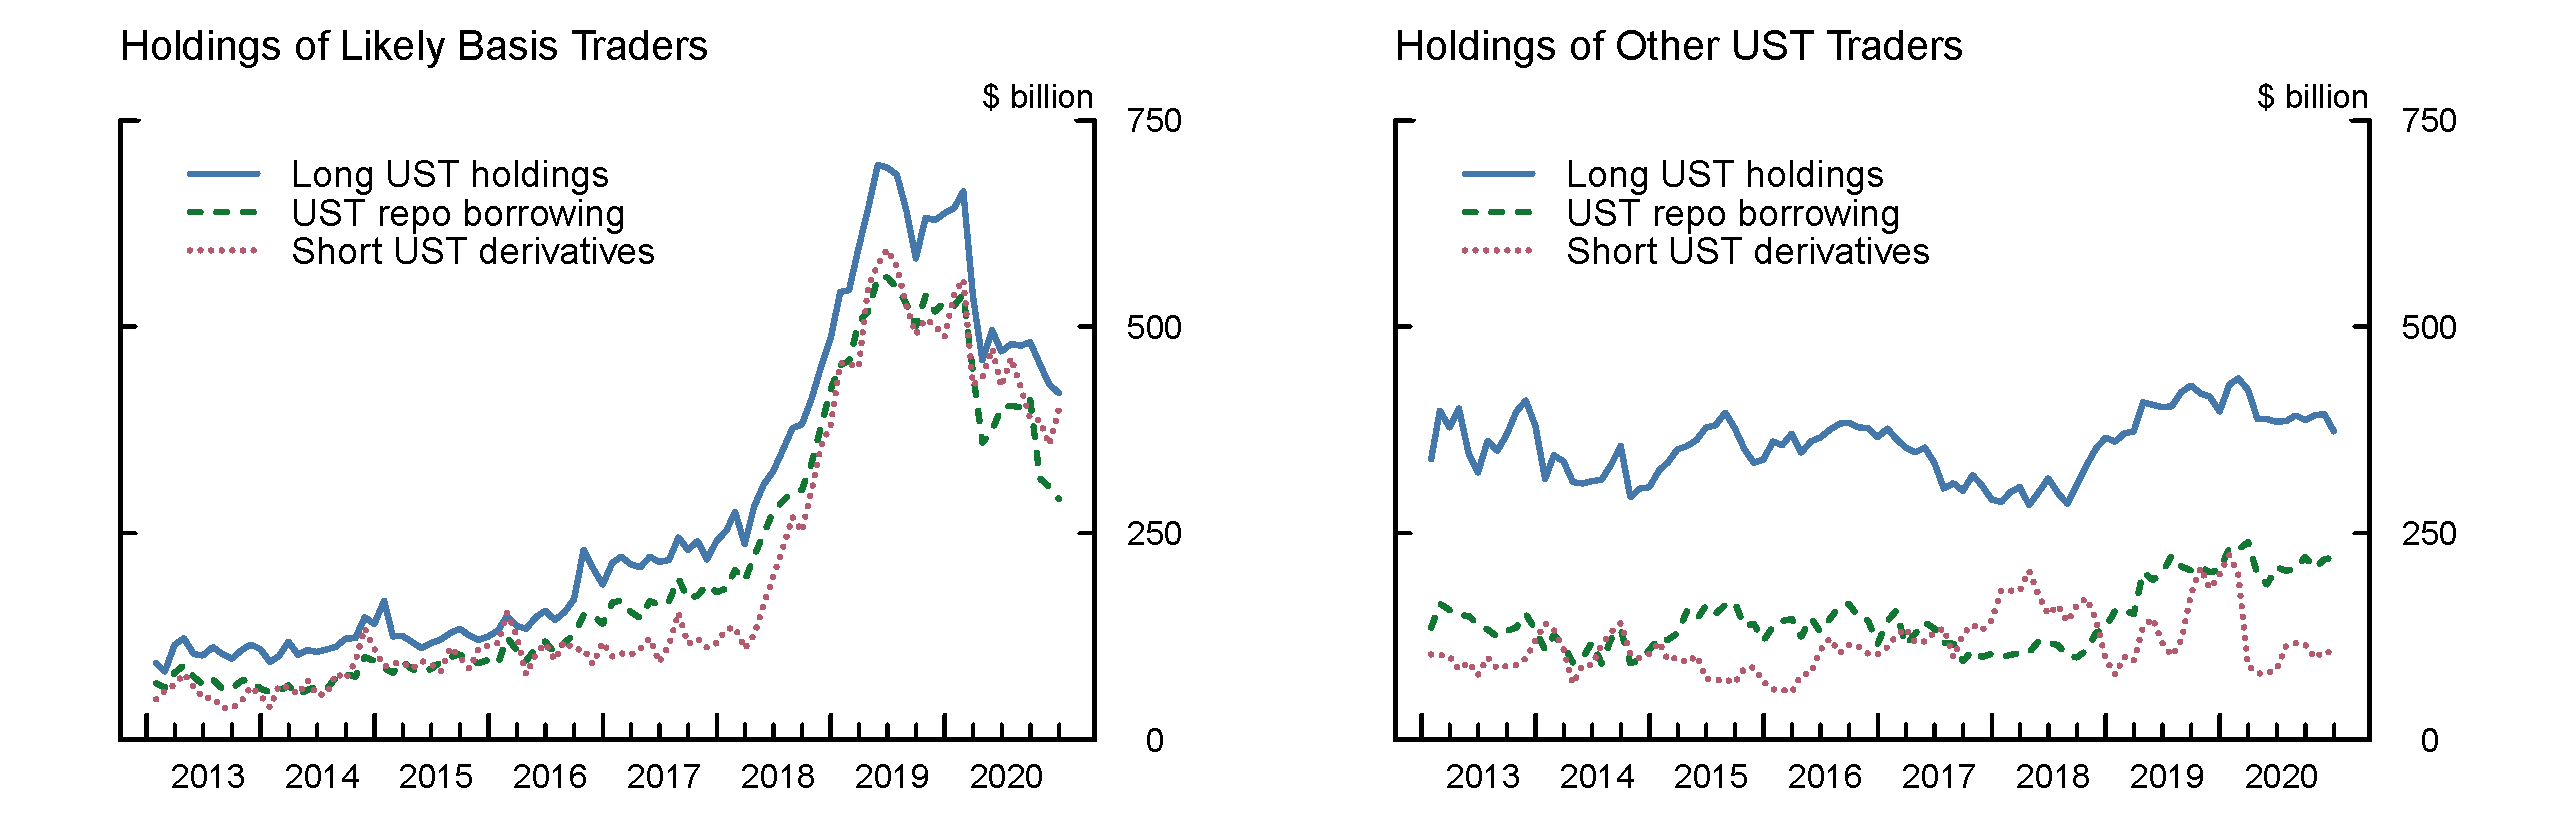
Note: Estimated long UST securities holdings, repo borrowing with UST collateral, and short UST derivatives exposures for funds classified as likely basis traders (left panel) and other UST traders (right panel).
Sources: SEC Form PF, authors’ calculations.
Hedge funds Treasury holdings declined by an estimated $141 billion in March 2020
Beginning in late February and early March, amid growing concerns about the effects of the COVID-19 outbreak on global economic activity, a wide range of investors rushed for liquidity. By the second week of March, Treasury markets suffered severe dislocations, and market functioning was unusually strained. Long-term Treasury yields increased and bid-ask spreads widened dramatically as investors, in a rush to raise cash, sold large volumes of medium- and long-term Treasury securities, straining dealers' capacity and willingness to intermediate. Liquidity conditions remained strained until a series of policy actions by the Federal Reserve later in March helped restore smooth market functioning.7 Following these measures, disruptions to the functioning of the Treasury market began to subside, and market functioning was restored.
Treasury market functioning during the March turmoil may have been affected by the activities of relative-value hedge funds. Market commentary at the time pointed to the selling of Treasury positions by hedge funds exiting their basis trades as a major amplifier of the Treasury market dislocations in mid-March. According to Form PF data, long QHF Treasury exposures fell by $252 billion in March 2020, suggesting that hedge fund de-risking may have indeed contributed to the sell-off. These declines in UST exposures likely reflect some combination of outright sales of Treasury securities and reductions in derivatives positions. Large sales of Treasury securities, especially to dealers who were likely already under pressure due to the selling by non-hedge fund clients, would likely have more severe implications for Treasury market functioning than the closing of (typically exchange-traded) derivatives positions. However, due to a lack of detailed data on hedge funds' Treasury cash and derivatives positions, it has thus far been difficult to assess the extent of hedge funds' Treasury selling in March.8
Based on our estimates, shown in Table 1, hedge funds' holdings of Treasury securities declined by $141 billion in March 2020, or 13 percent of their total estimated holdings as of February 2020. Hedge funds' long UST derivatives exposures also decreased over the same period, by $111 billion. Thus, more than one-half of the decrease in hedge funds' Treasury exposures in March is explained by reductions in UST securities holdings, much of which was likely sold to dealers. It is therefore likely that hedge funds' selling in March was one important factor contributing to the inventory pressures at broker-dealers.
As further shown in Table 1, most of the decline in hedge fund UST holdings was due to funds likely engaged in trading the cash-futures basis. These funds reduced their Treasury holdings by an estimated $127 billion in March, accounting for about 90 percent of the total decline in QHFs' UST holdings. This finding is consistent with market commentary that the unwinding of basis trades contributed to the March UST sell-off.
In addition to selling Treasury securities, hedge funds significantly reduced their derivatives positions in March 2020. In particular, short derivatives positions fell by an estimated $238 billion, due to both an unwinding of the basis trades as well as reductions of exposures by other UST trading hedge funds.
Table 1: Estimated changes in hedge funds' Treasury holdings and derivatives positions in March 2020
| All qualifying hedge funds | Feb-20 | Mar-20 | Change ($ billions) | Change % |
|---|---|---|---|---|
| Long UST holdings | 1,101 | 960 | -141 | -13% |
| Long derivatives positions | 343 | 232 | -111 | -32% |
| Short UST holdings | 179 | 243 | 64 | 36% |
| Short derivatives positions | 757 | 519 | -238 | -31% |
| Basis traders | ||||
| Long UST holdings | 664 | 536 | -127 | -19% |
| Long derivatives positions | 96 | 73 | -23 | -24% |
| Short UST holdings | 93 | 162 | 69 | 74% |
| Short derivatives positions | 557 | 429 | -128 | -23% |
| Other UST trading funds | ||||
| Long UST holdings | 437 | 423 | -14 | -3% |
| Long derivatives positions | 247 | 159 | -88 | -35% |
| Short UST holdings | 86 | 81 | -5 | -6% |
| Short derivatives positions | 199 | 90 | -109 | -55% |
On net, hedge funds sold an estimated $173 billion of Treasury securities in March 2020, after adjusting for valuation changes
The estimated changes of QHF holdings, shown in Table 1, reflect both net hedge fund transactions and valuation changes due to the interest rate sensitivity of the Treasury positions. Since interest rates decreased notably in March 2020, increasing the value of long UST positions, the estimated changes in holdings understate the amount of Treasury selling by QHFs during that period. To provide an estimate of the net transactions by QHFs, we adjust the holdings for the valuation effect. The adjustment is based on the reported duration of hedge fund Treasury positions and interest rate changes. As of February 2020, the average duration of hedge funds' Treasury positions was 6.8 years, and the corresponding zero-coupon interest rate decreased by about 45 basis points from February to March. This suggests that in the absence of trading, hedge funds' Treasury positions would have increased by about 3 percent, or $32 billion, in March, and the change in hedge funds' holdings should be adjusted downward correspondingly to estimate the net transaction volume. A similar procedure is applied to estimate the net UST transactions of QHFs in each month. Details of the estimation can be found in Appendix 1.
Figure 8 shows the estimated monthly net UST transactions of QHFs, separately for likely basis traders and other hedge funds. Hedge funds sold, on net, $173 billion of Treasuries in March 2020, or about 16 percent of their February holdings. This transaction volume estimate is highly significant, corresponding to 6 standard deviations of the historical net transactions estimate. Much of the selling was done by hedge funds likely trading the Treasury cash-futures basis, which sold an estimated $148 billion in Treasury securities in March 2020.
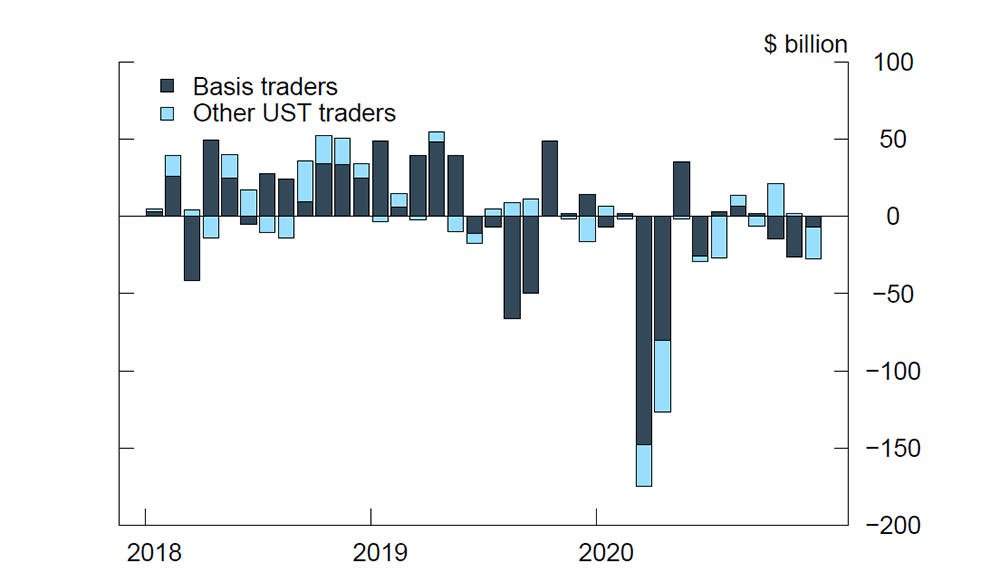
Note: Estimated net UST transactions for funds classified as likely basis traders and other funds.
Sources: SEC Form PF, authors’ calculations.
Hedge fund selling of Treasury securities in Q1 2020, though large, was not outsized compared to the selling by other types of investors
How do the estimates for hedge funds' selling compare to those for other types of investors? The Financial Accounts of the U.S., available at the quarterly frequency, point to a widespread selling of Treasury securities by a large group of market participants in Q1 2020. As shown in Figure 9, mutual funds sold, on net, an estimated $266 billion dollars in Treasury securities in the first quarter, or 20 percent of their holdings at the end of 2019. Foreign investors were also among the largest sellers, with foreign official Treasury outflows reaching close to $178 billion (4 percent of their Q1 holdings), while foreign private holdings declined by $72 billion (3 percent).9 The household sector also reported large net sales at $152 billion (8 percent).10 Similarly, insurance companies, retirement funds, dealers, depository institutions and the state and local government sector, among others, saw net outflows of Treasury securities in the first quarter. In contrast, money market funds increased their holdings of Treasury securities over the same period, likely by purchasing T-bills and other short-term Treasury securities.
In comparison, based on our estimates, QHFs sold, on net, $172 billion worth of Treasury securities in Q1 2020, or 17 percent of their holdings at the end of 2019.11 This estimate suggests that hedge fund selling in Q1 2020, though large, was not outsized compared to that of other types of institutional investors, such as mutual funds.
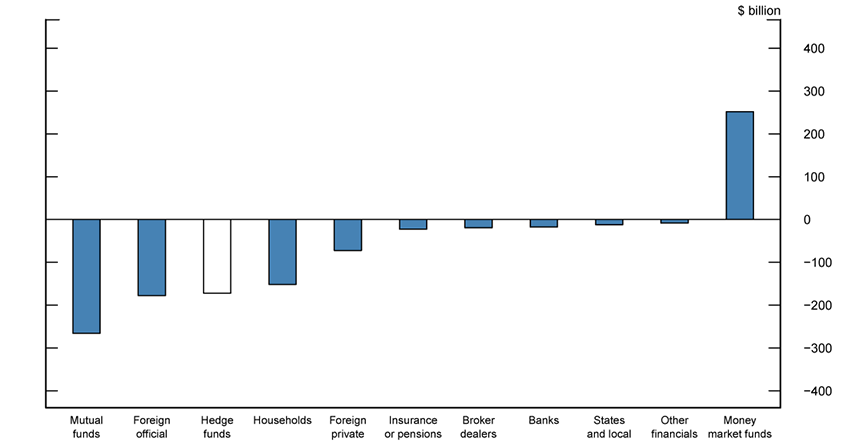
Note: Hedge fund flows are based on staff estimates of hedge fund holdings from the reported exposures in Form PF, adjusted for changes in valuations. Both domestic and foreign hedge funds are included. Domestic flows are from Z.1 Financial Accounts of the United States, F.210 Treasury Securities. Foreign flows are based on a method developed in Bertaut and Judson (2014) using monthly data from Treasury International Capital. Data is not seasonally adjusted.
Hedge funds continued to reduce their Treasury market exposures in the months following March 2020, but their exposures nonetheless remain large
In the aftermath of the March 2020 sell-off, hedge funds continued to reduce their Treasury positions, though at a slower pace than in previous months. Between Q2 and Q4 2020, QHFs reduced their Treasury holdings by another $167 billion, on net, and they reduced their gross derivatives positions by another $69 billion. In part, the continued declines in hedge funds' Treasury positions were driven by the diminished importance of the basis trade. Given that the basis trade return profile is essentially that of a T-bill plus a financing liquidity risk premium, and that the recent post-crisis environment has featured extremely low T-bill rates and abundant liquidity, the expected return of the trade has diminished, likely making it less attractive.
Despite having reduced their UST market activities in the aftermath of March 2020, hedge funds continue to maintain a significant presence in the UST market. As of December 2020, QHFs had a gross UST exposure of $1.6 trillion, much less than the $2.4 trillion in February 2020 but still large. They held an estimated $793 billion in Treasury securities, compared to $1.1 trillion in February 2020. Their gross notional UST derivatives exposures stood at $682 billion, compared to $1.1 trillion in February 2020. Given their large and concentrated exposures, active investment styles, and the potential for their exposures to increase or decrease rapidly, hedge funds are likely to continue to play a significant role in UST markets.
References
Bertaut, Carol, and Ruth Judson (2014). "Estimating U.S. Cross-Border Securities Positions: New Data and New Methods." International Finance Discussion Papers Number 1113. Washington: Board of Governors of the Federal Reserve System, August.
Kruttli, Mathias S., Phillip J. Monin, Lubomir Petrasek, Sumudu W. Watugala (2021). "Hedge Fund Treasury Trading and Funding Fragility: Evidence from the COVID-19 Crisis." Finance and Economics Discussion Series 2021-038. Washington: Board of Governors of the Federal Reserve System, June.
Securities and Exchange Commission (2021). Form PF, Reporting Form for Investment Advisers to Private Funds and Certain Commodity Pool Operators and Commodity Trading Advisors.
Appendix 1: Basis Traders and UST Holdings
Estimating monthly UST holdings
- We assume that short fixed income exposures to U.S. Treasury and other G10 sovereign bonds are obtained using both derivatives and reserve repo (DR). In contrast, other fixed income exposures, such as those to corporate bonds (except CDS contracts, which are reported separately) are assumed to be obtained only through repo, as indicated in the table below (RO). Note that long and short exposures to interest rate derivatives are reported separately.
| Classification | Asset classes |
|---|---|
| Derivatives & Repo (DR) | UST, G10 Sovn ex-US |
| Repo Only (RO) | Other Sovn, Corp Bond (ex-CDS), Agency/GSE/Muni Bond, MBS, ABS |
- Under the above assumptions, we estimate the short notional exposure to fixed income securities through derivatives (FI Short Derivatives) as the amount of short exposure in DR fields that is not sourced through reverse repo: FI Short Derivatives = SNE of DR fields - (Rev. Repo – SNE of RO fields), where SNE stands for Short Notional Exposure.
We allocate FI Short Derivatives proportionally among DR securities based on SNE to estimate Short UST Derivatives. Our estimate of Short UST Holdings is then UST SNE – Short UST Derivatives.
- Next, we obtain two alternative estimates of long UST holdings – one based on the difference between Long Notional Exposure (LNE) and the estimated long fixed income derivatives exposures; the other based on the amount of long repo collateral that can be attributed to Treasury financing.
- Allocate FI Long Derivatives (= FI Gross Derivatives – FI Short Derivatives) proportionally based on LNE; estimate LongUST1 as Long UST LNE – Long UST Derivatives
- Let LongUST2 = Repo Treasury and Agency Collateral – Agency LNE
Given the above, we define Long UST Holdings = max(LongUST1, LongUST2)
- Finally, we allocate repo borrowing proportionally based on LNE to estimate UST Repo Borrowing.
Estimating monthly net UST transactions
- Changes in hedge fund holdings between month t-1 and t are due to both valuation changes and net transactions:
Chg in Holdings(t-1,t) = Chg in Valuation(t-1,t) + Net Transactions(t-1,t).
We can thus estimate Net Transactions(t-1,t) given the change in hedge fund holdings Chg in Holdings(t-1,t) and an estimate of the change in valuation Chg in Valuation(t-1,t) over the period. Note that Net Transactions(t-1,t) includes UST securities holdings that mature during the period but whose proceeds are not used to purchase other UST securities.
- Valuation changes for Treasury positions can be approximated using the duration of hedge funds' Treasury exposures reported in Form PF Duration(t-1) and changes in zero-coupon Treasury yields over the period:
Chg in Valuation(t-1,t) = Holdings(t-1) * Duration(t-1) * Estimated Chg in Zero-Coupon Yield Over (t-1,t)
Here, Chg in Zero-Coupon Yield Over (t-1,t) is estimated using the Gurkaynak, Sack, and Wright (2006) zero-coupon yield curve, resampled at a monthly frequency. Because Duration(t-1) is based on the total Treasury exposures reported in Form PF, we assume that the durations of UST holdings and derivatives exposures are the same within each fund.
Classifying likely basis traders
We classify hedge funds as likely basis traders based on the ways in which the basis trade differs on Form PF from other fixed income trades. To see this, consider the following table that compares the Form PF presentations of a cash-futures basis trade, a yield curve arbitrage or on-the-run/off-the-run arbitrage trade, a long repo-financed note, and a swap spread arbitrage trade. The first five columns represent distinct fields on Form PF. For simplicity, repo haircuts and futures margins, which are each typically small, are ignored.
Form PF Presentation of Hedge Fund Treasury Trades
| Long UST | Short UST | Repo | Rev. Repo | Other | UST Arb | Net Repo | |
|---|---|---|---|---|---|---|---|
| cash-futures basis trade | 100 | 100 | 100 | 0 | 100 | 100 | |
| yield curve arb./OTR-OFR | 100 | 100 | 100 | 100 | 100 | 0 | |
| long repo-financed note | 100 | 0 | 100 | 0 | 0 | 100 | |
| swap spread arb. | 0 | 100 | 0 | 100 | 100 | 0 | -100 |
The cash-futures basis trade involves a short futures position and the purchase of a repo-financed deliverable note. The magnitudes of the long UST exposure, short UST exposure, and repo borrowing are approximately equal. On the other hand, an on-the-run/off-the-run trade (OTR-OFR), for example, involves a long position in an off-the-run note, financed in repo, and a short position in an on-the-run note, sourced in reverse repo. The magnitudes of the long and short UST exposures are similar, as is the case for the basis trade. Unlike the cash-futures basis trade, the OTR-OFR trade makes use of reverse repo.
The last two columns are derived from the first two and serve to highlight the differences among the UST trades. UST Arb, a proxy for the fund's UST arbitrage activity, is equal to min(UST LNE, UST SNE), while Net Repo is equal to repo borrowing minus repo lending (reverse repo). We see from the table that UST Arb and Net Repo are positively correlated for funds whose UST trading activities are predominantly composed of cash-futures basis trades.
Accordingly, we classify a hedge fund as a likely basis trader if its UST arbitrage activity (UST Arb) is significantly positively correlated with its Net Repo activity between January 2018 and February 2020, during which the basis trade was most popular among hedge funds. We also require that a likely basis trader have non-zero allocation to either a relative value sovereign or global macro strategy. Finally, we manually inspect the results of the algorithm to ensure consistency.
Appendix 2: Other indicators of hedge fund UST selling during the March 2020 turmoil
Since Treasury holdings are not reported in Form PF, our estimates of hedge fund Treasury holdings are based on several assumptions (see Appendix 1). It is therefore useful to contrast our estimates with other available indicators, including those from the U.S. financial accounts and from the Treasury International Capital (TIC) data. These alternative estimates also indicate that hedge fund UST holdings declined in Q1 2020, although the magnitudes of the estimated declines differ. For instance, an estimate of hedge funds' holdings of Treasury securities from the Enhanced Financial Accounts, based on a different methodology, indicates that hedge funds in the aggregate reduced their Treasury holdings by only about $19 billion in Q1 2020, notably less than our estimate of $75 billion.12 Since many hedge funds are domiciled in Cayman Islands, another rough proxy for hedge fund trading can be based on the transaction of Cayman Island Residents. According to TIC data, Cayman Islands residents sold on net close to $118 billion in UST securities in March, which is more consistent with our estimate of a $173 billion net sales by all QHFs. Data from the Commodity Futures Trading Commission on UST futures positions show that leveraged funds, including hedge funds, reduced their short futures positions by about $71 billion in March 2020, suggesting that hedge funds unwound some of their Treasury-futures basis trades. This drop in leveraged funds' Treasury short futures positions is in line with our $69 billion dollar decline in net short UST derivatives by likely basis traders shown in Table 1.
Overall, although available indicators are consistent with the narrative that hedge fund selling contributed to the Treasury market selloff, the wide range of estimates underscores significant uncertainty regarding the extent of hedge funds' selling of Treasury securities during the onset of the pandemic.
1. We thank Benjamin Iorio and Stephen Zoulalian for excellent research assistance. Return to text
2. The U.S. Treasury market stood at $19.4 trillion at the end of 2019. Foreign official investors, the largest investor group prior to the pandemic, held an estimated $4.1 trillion in Treasury securities outstanding, while foreign private investors held $2.8 trillion. U.S. insurance companies and retirement funds held $3.3 trillion. Other large private market participants included mutual funds at $1.3 trillion, while depository institutions and broker-dealers held about $1 trillion in total. Return to text
3. Anecdotally, asset managers increased duration exposure using UST futures because of their greater liquidity and ease of trading compared to UST securities and to free up cash for use in yield-enhancing instruments or as liquidity buffers. Return to text
4. Typical haircuts on Treasury repo are around 2 percent. Return to text
5. Note that the foregoing comparison of Form PF and CFTC TFF data assumes that the sets of respondents are identical. However, this is not expected to be true given the different reporting requirements of the two filings (Form PF does not include family offices; CFTC data may include CTAs that are not hedge funds, or may include other "leveraged funds" such as leveraged ETFs). Return to text
6. Most funds with a positive and significant correlation between Treasury arbitrage activity and net repo positions follow, at least in part, a relative value sovereign or global macro strategy. Return to text
7. These actions included the expansion of repurchase operations, an increase in purchases of Treasury securities and agency MBS, the establishment of the PDCF to support dealer-intermediated markets, and a temporary change to the regulatory capital requirements of bank holding companies and depository institutions. Return to text
8. See Appendix 2 for a discussion on other estimates of hedge fund selling of Treasury securities during the March 2020 turmoil. Return to text
9. The flow estimates for foreign official and foreign private investors are based on the method developed in Bertaut and Judson (2014), in which flows are calculated as (change in holdings) – (estimated valuation change) – (other changes). Bertaut and Judson (2014) use TIC annual survey positions whereas these estimates use monthly positions data from TIC Form SLT. By construction, TIC annual survey positions and TIC Form SLT positions are usually very close. Return to text
10. Note that the household sector includes domestic hedge funds, while foreign hedge funds are part of the foreign private sector. Return to text
11. Our estimate of net sales over Q1 2020 is nearly identical to our estimate of net sales in March 2020 alone. Estimated net transactions in January and February 2020 were insignificant in magnitude (see Figure 8). Return to text
12. Our estimates differ from the EFA estimates in the methodology used to separate securities holdings from derivatives notional exposures. For details about the EFA methodology, see https://www.federalreserve.gov/releases/efa/efa-hedge-funds.htm. Return to text
Banegas, Ayelen, Phillip J. Monin, and Lubomir Petrasek (2021). "Sizing hedge funds' Treasury market activities and holdings," FEDS Notes. Washington: Board of Governors of the Federal Reserve System, October 6, 2021, https://doi.org/10.17016/2380-7172.2979.
Disclaimer: FEDS Notes are articles in which Board staff offer their own views and present analysis on a range of topics in economics and finance. These articles are shorter and less technically oriented than FEDS Working Papers and IFDP papers.