FEDS Notes
December 13, 2019
Spike in 2019Q1 Leverage Ratios: The Impact of Operating Leases
1. Introduction/Motivation
In 2019:Q1, the leverage ratio for nonfinancial sector corporations headquartered in the United States – commonly measured as the ratio of total debt to total book value of assets – increased dramatically, as shown in Figure 1, with the aggregate ratio (dashed blue line) increasing by about 1.8 percentage points and the median ratio (solid red line) increasing by about 3.7 percentage points. These quarterly changes are large by historical standards and are not associated with a corresponding increase in corporate debt issuance. In this note, we show that the key driver of the 2019:Q1 increase in the leverage ratio appears to be a change in accounting rules – which requires the inclusion of operating leases as financial liabilities on U.S. corporations' balance sheets – and also provide a methodology for adjusting the leverage ratio to allow for cleaner historical comparisons.
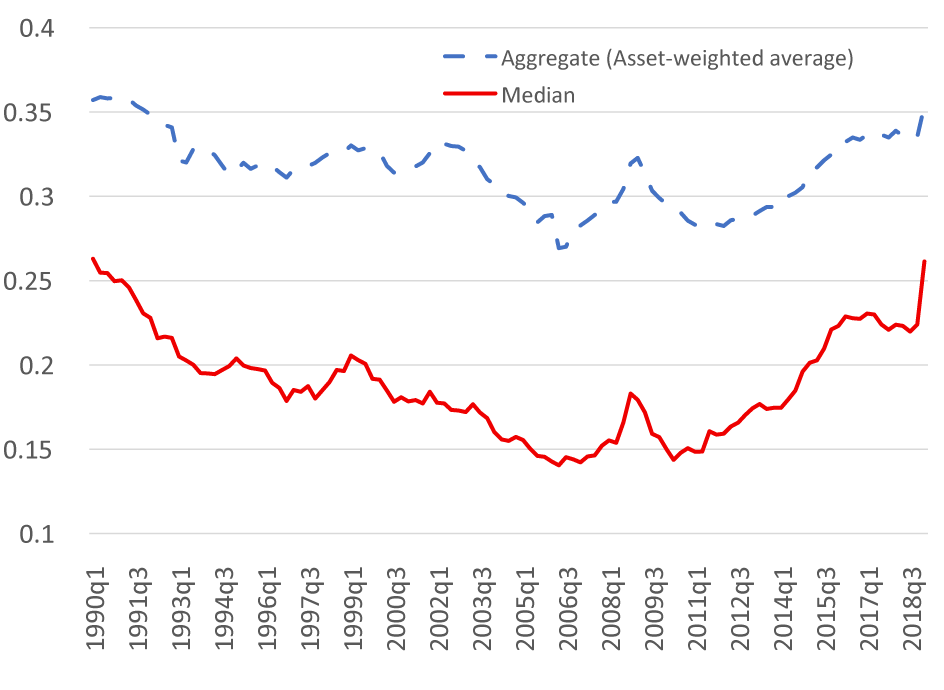
Source: Standard & Poor's Compustat.
In early 2016, the Financial Accounting Standards Board (FASB) released an update to accounting standards that requires the recognition of all leases on the balance sheet by January 2019. Prior to this change only capital leases were included on corporations' balance sheets, with company payments toward operating leases treated as an expense in the calculation of net income.
We collect data on firm-level operating lease liabilities exploiting the Extensible Business Reporting Language (XBRL) feature for corporations' 10-Q and 10-K filings from the SEC website and examine the impact of operating lease liabilities on the 2019:Q1 change in debt and change in leverage ratios. Our analysis shows that the inclusion of operating leases on the balance sheet contributes 69% to the 2019:Q1 increase in corporate leverage ratio on average, while net debt issuance contributes only 8%. We propose an adjusted leverage ratio for 2019:Q1 that removes the impact of operating leases and allows for the more direct comparison of leverage ratios over time. Despite the notable spike in the unadjusted ratio, our adjusted leverage ratio shows only a 0.3 (0.8) percentage point increase in the aggregate (median) leverage ratio in 2019:Q1 and remains within the range of leverage ratios reported over the past few years.
The rest of this note is organized as follows. Section 2 discusses the details of the new accounting rule, section 3 details the measurement of operating leases, and section 4 explores the impact of the new accounting rule on leverage ratios. We conclude in section 5.
2. New Accounting Rule on Operating Leases
On February 25, 2016, the Financial Accounting Standards Board (FASB) released an accounting standards update – FASB Accounting Standards Update No. 2016-02, Leases (Topic 842) – that requires lessees to record nearly all leases as financial liabilities on their balance sheets by the first filing in the fiscal year beginning after December 15, 2018 (effectively January 2019 for the majority of public firms). Prior to this update, only capital leases (also called finance leases) were included on the balance sheet while payments for operating leases were only recognized as expenses on the income statement.2
While the new accounting standard was issued in February 2016, public firms had until January 2019 (and private firms until January 2020) to implement this new standard. To ensure compliance, firms are expected to incur non-negligible costs in preparing their financial statements, including in some cases hiring entire teams to assess all contracts for correct classification as leases under the new standard.3 Moreover, firms face indirect costs of implementation as the inclusion of operating leases, which are typically much larger than capital leases, are expected to load heavily into a firm's liability and leverage. Although many financial professionals, such as Moody's Investors Service and Standard and Poor's, already account for operating leases in their credit quality assessments, reconciling leases estimated by analysts against new disclosures of leases as reported by firms themselves may cause extended reviews and possible revisions to ratings.4 Furthermore, investor confusion over changes in financial ratios based on new reporting standards may impact timely access to capital markets and funding. Given the presumably high cost of implementation, the vast majority of firms appeared to have delayed these changes until the first quarter of 2019.
3. Data and Measuring Operating Leases
We focus primarily on corporate leverage changes occurring between 2018:Q4 and 2019:Q1. We restrict our sample to U.S. non-financial firms traded on either the NYSE, NASDAQ, or AMEX stock exchanges. We winsorize all variables used in our analysis at the 1st and 99th percentile tails to remove the impact of outliers. This leaves us with 2,964 firms in 2019:Q1.
To study the impact that the inclusion of operating leases have on 2019:Q1 leverage ratios, we need a measure for operating lease liability. S&P's Compustat collects data on a firm's rental expenses and future minimum rental payments, which, in theory, should be discounted at the firm's cost of debt to arrive at a present value of operating lease liability. In practice, the difficulty of measuring a firm's cost of debt and the lack of precision around the firm's rental expenses and future minimum rental payments render such an approach fragile, as we discuss in the Appendix. To overcome these issues, we exploit the Extensible Business Reporting Language (XBRL) feature from the SEC website to extract data referring to operating leases accounted for on a firm's balance sheet.
The Extensible Business Reporting Language (XBRL) is an "open international standard for digital business reporting" of information via common and individualized tagging embedded into SEC filings.5 Specifically, we pull data from firms' 10-Q and 10-K reports with the following XBRL tags: "Operating Lease Liability" (OLL_XBRL), "Operating Lease Liability Current" (OLL_C), and "Operating Lease Liability Non-Current" (OLL_NC). OLL_XBRL is the value of all operating lease liabilities, including current and future rent payments, and is the sum of the current (OLL_C) and non-current (OLL_NC) operating leases liabilities tags.
Using XBRL, we manage to retrieve a measure of operating liabilities directly from the balance sheet for 1,858 firms in 2019:Q1. These are firms in our sample with a first fiscal quarter starting after December 15, 2018. The remaining firms without XBRL data have either not yet adopted (having a first fiscal quarter later than 2019:Q1) or have missing XBRL data (which includes not having operating leases).
4. Main Analysis
Having obtained a measure for operating lease liability (OLL_XBRL), we now examine how the new accounting standards update on operating leases contributed to the 2019:Q1 increase in leverage ratios.
First, we show that firms without a XBRL-based value for operating lease liability do not show any significant change in leverage (even if they report minimum rental commitments, MRC, in their annual reports). Next, we examine the determinants of the change in debt between 2018:Q4 and 2019:Q1, normalized by total book value of assets in 2018:Q4. Finally, we exploit the latter analysis to calculate an adjusted leverage ratio that removes the impact of operating leases on the debt-to-assets ratio.
Table 1: 2019:Q1 Change in Leverage Across Subsamples of Data Availability
| All firms | Firms with XBRL Data | Firms without XBRL Data but with MRC Data | Firms without XBRL or MRC Data | |||||
|---|---|---|---|---|---|---|---|---|
| (1) | (2) | (3) | (4) | (5) | (6) | (7) | (8) | |
| Mean | Median | Mean | Median | Mean | Median | Mean | Median | |
| Leverage Ratio in 19Q1 | 0.29 | 0.26 | 0.32 | 0.30 | 0.22 | 0.17 | 0.24 | 0.21 |
| Leverage Ratio in 18Q4 | 0.26 | 0.23 | 0.28 | 0.25 | 0.20 | 0.16 | 0.24 | 0.20 |
| Change in Leverage Ratio | 0.03 | 0.02 | 0.05 | 0.03 | 0.01 | 0.00 | 0.00 | 0.00 |
| Net Debt Issuance-to-Assets Ratio | 0.01 | 0.00 | 0.01 | 0.00 | 0.01 | 0.00 | 0.00 | 0.00 |
| No. of Firms | 2,878 | 1,858 | 637 | 383 | ||||
Source: Standard & Poor's Compustat and Securities Exchange Commission.
In Table 1, we compare the leverage ratio and net debt issuance for firms in 2019:Q1 split across categories of having available operating lease information. In Columns (1) and (2), across all firms, there was a substantial increase in 2019:Q1 leverage ratios, but no significant increase in debt issuance activity. The average (median) firm-level difference between the leverage ratio in 2019:Q1 and 2018:Q4 is 3.2 (1.7) percentage points, while the average (median) firm-level net debt issuance-to-assets ratios is 0.8 (0.0) percentage points.6 In Columns (3) and (4), focusing only on the subset of firms with XBRL-based operating lease liability – likely those who have adopted the new accounting standard, the median increase is larger (2.9 percentage points), while the debt issuance activity does not show any significant increase. In Columns (5) and (6), for the subset of firms with a missing XBRL-based measure but a non-missing value of minimum rental commitments in the annual reports – those who have not yet adopted, the increase in average leverage (1.3 percent) can be mostly explained by an increase in net debt issuance (0.9 percent) and there is little change in the median leverage and net debt issuance. Finally, in Columns (7) and (8), for firms without XBRL or MRC data – likely those who are unaffected by the accounting standards update potentially due to lack of operating leases – we observe little change in either the average or median leverage between 2018:Q4 and 2019:Q1. In other words, the dramatic increase in the 2019:Q1 leverage ratios appear to be predominantly driven by the adoption of the new accounting standard on operating leases.
4.1 Understanding the Impact of Operating Leases on Changes in Debt
Table 1 motivates a more in-depth analysis on the determinants of the debt increase during 2019:Q1. We start by defining the change in debt as the difference in debt levels between 2018:Q4 and 2019Q4 (Change in Debt). We normalize this by the book value of assets in 2018:Q4 to isolate the impact of operating leases on the change in debt, removing any potential impact from changes to asset value.7 We regress our normalized change in debt measure on net debt issuance and our XBRL-based measure of operating lease liability.
Table 2: Explaining the 2019:Q1 Change in Debt
| LHS: Change in Debt (19Q1) / Assets (18Q4) | |||||
|---|---|---|---|---|---|
| (1) | (2) | (3) | (4) | (5) | |
| Net Debt Issuance (19Q1) / Assets (18Q4) | 1.05*** (0.03) |
1.05*** (0.03) |
1.05*** (0.03) |
||
| Operating Lease Liability (OLL_XBRL) (19Q1) / Assets (18Q4) |
0.48*** (0.04) |
1.08*** (0.06) |
1.07*** (0.05) |
||
| [OLL_XBRL (19Q1) / Assets (18Q4)] Squared | -0.91*** (0.09) |
-0.89*** (0.09) |
|||
| Operating Lease Liability (OLL_XBRLTOT) (19Q1) / Assets (18Q4) |
1.02*** (0.04) |
||||
| [OLL_XBRLTOT (19Q1) / Assets (18Q4)] Squared | -0.83*** (0.08) |
||||
| Constant | 0.00*** (0.00) |
0.00*** (0.00) |
0.01*** (0.00) |
-0.00 (0.00) |
0.00*** (0.00) |
| No. Observations | 2,964 | 1,858 | 1,858 | 1,858 | 2,964 |
| R^2 | 0.30 | 0.36 | 0.47 | 0.74 | 0.67 |
Source: Standard & Poor's Compustat and Securities Exchange Commission.
Table 2 presents the results. Column (1) examines the impact of net debt issuance on the change in 2019:Q1 debt. As noted earlier in Table 1, the net debt issuance in 2019:Q1 was not sizeable enough to justify the record-setting increase in the leverage ratio in 2019:Q1. Here, we confirm that while net debt issuance has a positive and significant impact on the change in debt, the estimated constant of 4 percentage points suggests that there remains a large and significant increase in the change in debt that is unexplained by any increases in net debt usage.
When including only the XBRL-based measure of operating lease liability (OLL_XBRL) as the sole explanatory variable in Column (2), we find a positive and significant coefficient.8 Moreover, the R2 in this model (0.36) is higher than the R2 in a model using only the net issuance of debt (0.30). However, we are still left with an unaccounted for 3.3 percentage point increase in the change in debt. It possible that the relation between change in debt and operating lease liability is non-linear. To account for nonlinearities, we include the squared term of (OLL_XBRL/Assets) in Column (3). Doing so decreases the unexplained increase in the change in debt to 0.8 percentage points and improves the R2 of the model to 0.47.
We include both net debt issuance and operating leases as drivers for the increase in the 2019:Q1 change in debt in Column (4). Doing so explains 74 percent of the variation in the debt change for the subsample of firms with available XBRL data. In addition, the constant term drops close to zero and becomes insignificant. This suggests that net debt issuance and operating lease liabilities jointly explain the 2019:Q1 increase in debt.
The analysis in Columns (2) through (4) focuses on the subset of firms with available XBRL data. In Column (5), we expand our sample to use all firms in 2019:Q1 by setting OLL_XBRL to zero when missing, OLL_XBRLTOT, for direct comparison to Column (1). Including XBRL-based measures for operating lease liability produces a large increase in the R2 relative to the model in Column (1) that only includes net debt issuance (0.67 versus 0.30) and a large reduction in the constant term, which, albeit significant, is one order of magnitude smaller in Column (5).
Overall, we see that the unusually large change in debt during 2019:Q1 is almost exclusively due to firms that adopt the new accounting standard for operating leases. In the next section, we calculate the overall impact of the new accounting standard adoption on the aggregate and median leverage ratios.
4.2 Adjusting for Operating Leases in the Leverage Ratio
In addition to studying the change in debt levels, we also examine the impact of operating lease liabilities on the change in leverage ratios, defined as the debt-to-assets ratio. Studying the change in leverage ratios serve two main purposes. First, leverage ratios, rather than normalized changes in debt, are more commonly used by practitioners and academics to measure corporate indebtedness. Second, studying the change in leverage ratio additionally allows us to account for possible changes to assets due to the accounting standards update. Although liability (and specifically debt) increases due to the reporting of operating lease liabilities on the balance sheet, assets should also increase due to the inclusion of operating lease rights of use. Altogether, this suggests that the change in leverage should be dampened relative to the change in debt.
Table 3 provides the corresponding analysis from the previous section using the change in leverage ratio in 2019:Q1 as the left-hand-side dependent variable. For the most part, the results in Table 3 follow the implications reached from Table 2. Breaking down the change in leverage ratio for XBRL-based measures for operating lease liability, we find that for the average (median) firm 8% (0%) of the change in the leverage ratio is due to changes in net debt usage and 69% (76%) is due to the inclusion of operating leases on the balance sheet, with the remaining 23% (24%) unexplained.9
Table 3: Explaining the 2019:Q1 Change in Leverage (Debt/Asset) Ratio
| LHS: Change in Leverage Ratio = Debt/Assets (19Q1) Minus Debt/Assets (18Q4) | |||||
|---|---|---|---|---|---|
| (1) | (2) | (3) | (4) | (5) | |
| Net Debt Issuance (19Q1) / Assets (18Q4) | 0.57*** (0.03) |
0.58*** (0.04) |
0.58*** (0.03) |
||
| Operating Lease Liability (OLL_XBRL) (19Q1) / Assets (18Q4) |
0.25*** (0.02) |
0.60*** (0.05) |
0.60*** (0.05) |
||
| [OLL_XBRL (19Q1) / Assets (18Q4)] Squared | -0.52*** (0.07) |
-0.51*** (0.06) |
|||
| Operating Lease Liability (OLL_XBRLTOT) (19Q1) / Assets (18Q4) |
0.60*** (0.04) |
||||
| [OLL_XBRLTOT (19Q1) / Assets (18Q4)] Squared | -0.52*** (0.06) |
||||
| Constant | 0.03*** (0.00) |
0.02*** (0.00) |
0.01*** (0.00) |
0.01** (0.00) |
0.01*** (0.00) |
| No. Observations | 2,964 | 1,858 | 1,858 | 1,858 | 2,964 |
| R^2 | 0.16 | 0.20 | 0.27 | 0.42 | 0.39 |
Source: Standard & Poor's Compustat and Securities Exchange Commission.
To arrive at an adjusted leverage ratio that excludes the impact from operating lease liabilities, we use two methods: an indirect method based on the estimation results from the specification in Column (4) and a more direct method consisting in netting out the actual value of operating lease liability from total debt and total assets.
Indirect adjustment
We use the estimation results from the specification in Column (4) of Table 3 to predict the change in leverage ratio and subtract the contribution from the operating lease liability measures, keeping only the contribution from net debt issuance. Using adjusted leverage ratios, we find that for 2019:Q1, the aggregate leverage ratio is 0.339 (versus an unadjusted value of 0.354) and the median leverage ratio is 0.240 (versus an unadjusted value of 0.264).
Direct Adjustment
A simpler and more direct procedure to generate an adjusted measure of leverage consists of (i) subtracting the 2019:Q1 XBRL-based measure of operating lease liabilities from the value of total assets and total liabilities in 2019:Q1, and (ii) taking the ratio of adjusted total assets over adjusted total liabilities.10 Using this direct adjustment method, we find that for 2019:Q1, the aggregate leverage ratio is 0.338 (versus unadjusted value of 0.354) and the median leverage ratio is 0.232 (versus an unadjusted value of 0.264). These adjusted values are very close to and consistent with the adjusted values obtained using the linear regression indirect approach.
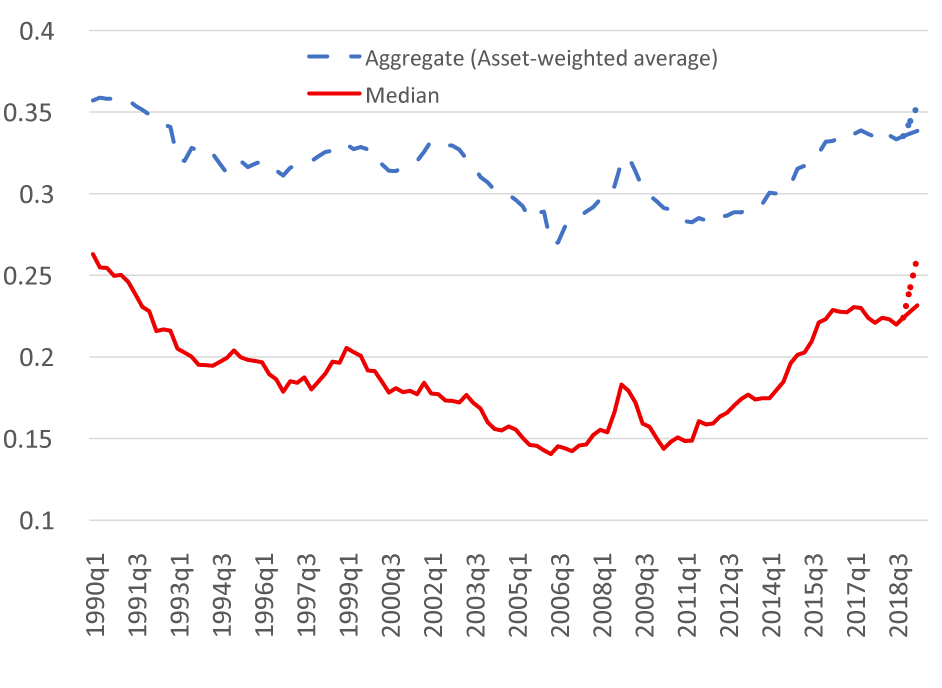
Source: Standard & Poor's Compustat.
Figure 2 presents the aggregate and median leverage ratios (dashed blue and solid red lines, respectively), with adjustment for the impact of operating leases in 2019:Q1. From 1990Q1 through 2018:Q4, the actual leverage ratios are plotted, identical to that in Figure 1. In 2019:Q1, the actual leverage ratios (the dotted portions of the blue and red lines) – which includes the impact of operating leases from the accounting standards update – is plotted against the adjusted leverage ratios (the solid portions of the blue and red lines) – which removes the impact of operating leases using the direct method described above. After adjusting for the impact of operating leases on the leverage ratio, we find changes in leverage within the typical bounds of its historical distribution and leverage ratios at levels consistent with recent past quarters.
5. Conclusion
We examine the large increase in leverage ratios in 2019:Q1. We find that this increase is mainly driven by the inclusion of operating leases on the balance sheet in accordance with a new accounting standards update required by January 2019 (FASB Accounting Standards Update No. 2016-02, Leases, Topic 842). We propose a method to calculate an adjusted leverage ratio that removes the effect of operating leases on leverage ratios. Using this adjusted leverage ratio, we find that leverage ratios in 2019:Q1 did not deviate considerably from the values of the past few years.
References
Barclay, M.J. and C.W. Smith, 1995, "The Priority Structure of Corporate Liabilities," Journal of Finance, 50 (3), 899-917.
Eisfeldt, A.L. and A.A. Rampini, 2008, "Leasing, Ability to Repossess, and Debt Capacity," Review of Financial Studies, 22(4), 1621-1657.
Graham, J.R., M.L. Lemmon, and J.S. Schallheim, 1998, "Debt, Leases, Taxes, and the Endogeneity of Corporate Tax Status," Journal of Finance, 53(1), 131-162.
Sharpe, S.A. and H.H. Nguyen, 1995, "Capital Market Imperfections and the Incentive to Lease," Journal of Financial Economics, 39(2), 271-294.
Yan, A., 2006, "Leasing and Debt Financing: Substitutes or Complements?" Journal of Financial and Quantitative Analysis, 41 (3), 709-731.
Standard & Poor's. Compustat Xpressfeed North America, via Wharton Research Data Services, http://wrds-web.wharton.upenn.edu/wrds/.
Securities and Exchange Commission, SEC (2019). Financial Statement and Notes Data Sets, https://www.sec.gov/dera/data/financial-statement-and-notes-data-set.html (XBRL data).
Appendix: Comparing Operating Lease Liability Measures
In the main draft, we use the XBRL-based measure for our operating lease liability measure. Not only is this measure directly pulled from the firm's balance sheet, it also serves as an indicator for the firms that have adopted the new accounting standards update. However, as mentioned above, prior to the accounting rule update, firms reported rental expenses and future committed minimum rental payments in the footnotes of their annual reports. We pull this data using the annual Compustat database to create an alternative measure of operating lease liability and compare against the XBRL-based measure.
A.1 MRC-based Operating Lease Liability Measure
Specifically, we pull information on the rental expenses and future minimum rental payments committed for each of the next five years and thereafter as reported in the footnotes of firms' annual reports from the annual Compustat database to create our MRC-based measure for operating lease liability:
Operating Lease Liability (OLL_MRC) = XRENT + MRC1 + MRC2 + MRC3 + MRC4 + MRC5 + MRCTA (A.1)
where XRENT is the rent due, MRC1 through MRC5 are the minimum rental commitment payments due in the next 1 through 5 years, respectively, and MRCTA is the minimum rental commitment thereafter.11
To study the impact of short-term and long-term operating lease liabilities on changes in leverage, we further split the total operating lease liability into three components: rent due, minimum rental commitments over the next five years, and minimum rental commitments after 5 years:
Current Operating Lease Liability (OLL_DUE) = XRENT,
Short-term Operating Lease Liability (OLL_ST) = MRC1 + MRC2 + MRC3 + MRC4 + MRC5, (A.2)
Long-term Operating Lease Liability (OLL_LT) = MRCTA.
A.2 Comparing Operating Lease Liability Measures
To examine the consistency and quality of our operating lease measures, we compare the latest available data on both the MRC-based and XBRL-based measures for operating lease liability. Figure A.1 provides a scatter plot of the MRC-based total operating lease liability measure (OLL_MRC) against the XBRL-based total operating lease liability measure (OLL_XBRL) for 2019:Q1, both normalized by the 2018:Q4 total book value of assets.
Reassuringly, the two measures are well aligned, with a correlation of 0.89. Furthermore, as expected, there are sectoral differences in the intensity of operating lease liabilities – firms in the utilities, oil & metal mining, and business & personal services sectors have relatively lower amounts of operating lease liability relative to their previous quarter assets, while those in the retail, airlines & air transport, and legal & social services industries have relatively larger amounts.
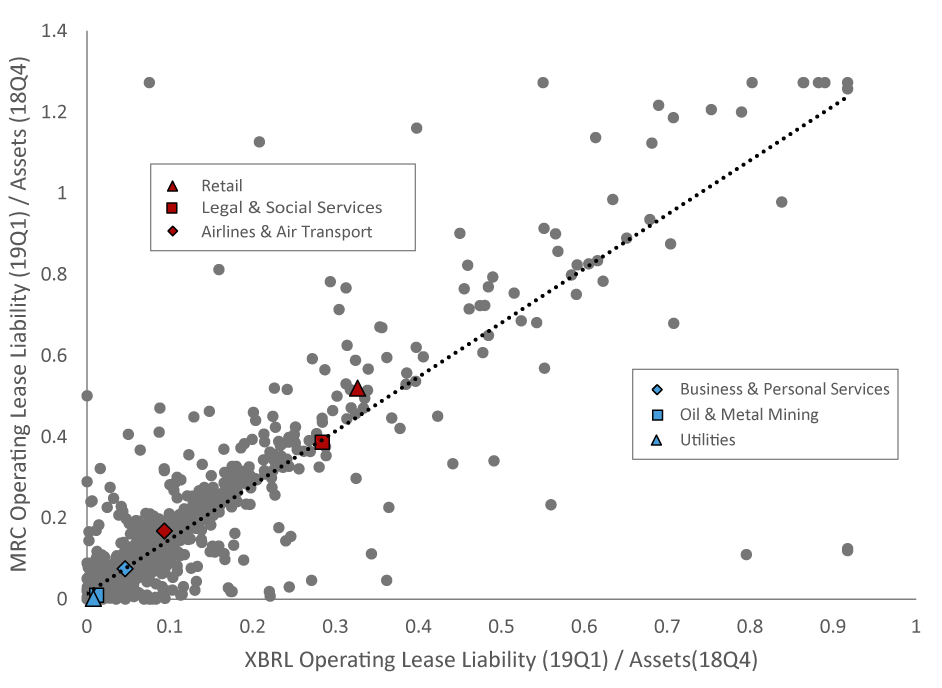
Source: Standard & Poor's Compustat and Securities Exchange Commission.
In Table A.1, using the sample of firms with consistent values for XBRL-based measures12, we regress OLL_XBRL on OLL_MRC to examine how well the minimum rental commitments pulled from the footnotes of firms' annual reports translate to the newly reported operating lease liabilities on the balance sheet. Using only the MRC-based operating lease liability measure (OLL_MRC) as the explanatory variable in Column (1), we find a positive and highly significant coefficient and an R2 of 0.83. However, we are left with a significant, albeit small, constant. When we decompose OLL_MRC into its three OLL_DUE, OLL_ST, and OLL_LT components in Column (2) – allowing us to capture the impact of discounting, we find that all three contribute significantly in explaining OLL_XBRL and the R2 increases to 0.86. Moreover, the constant has decreased in magnitude and is no longer significant. Overall, the results in Table A.1 suggests that the minimum rental commitments reported in the footnotes of the annual reports are consistent with operating lease liability as reported on the balance sheet.
Table A.1: Regressing XBRL-based Measure on MRC-based Measures
| LHS: Operating Lease Liability (OLL_XBRL) (19Q1) / Assets (18Q4) | ||
|---|---|---|
| (1) | (2) | |
| Total Operating Lease Liability (OLL_MRC) (19Q1) / Assets (18Q4) | 0.60*** (0.02) |
|
| Current Operating Lease Liability (OLL_DUE) (19Q1) / Assets (18Q4) | 0.70*** (0.31) |
|
| Short-term Operating Lease Liability (OLL_ST) (19Q1) / Assets (18Q4) | 0.73*** (0.10) |
|
| Long-term Operating Lease Liability (OLL_LT) (19Q1) / Assets (18Q4) | 0.44*** (0.06) |
|
| Constant | 0.01*** (0.00) |
0.00 (0.00) |
| No. Observations | 1635 | 1635 |
| R^2 | 0.83 | 0.86 |
Source: Standard & Poor's Compustat and Securities Exchange Commission.
1. We thank Zach Fernandes and Kenny Green for excellent research assistance. Return to text
2. There is a wide academic literature discussing the important role that leases play in supporting corporate financing. See, e.g., Barclay and Smith (1995), Sharpe and Nguyen (1995), Graham, Lemmon, and Schallheim (1998), Yan (2006), Eisfeldt and Rampini (2008), among others. Return to text
3. On July 30, 2018, FASB issued ASU 2018-11 Leases (Topic 842) – Targeted Improvements that reduces the costs and eases the implementation of the leases standard for financial statement preparers. Return to text
4. Per Moody's statement on the new FASB operating lease accounting requirements, the rating agency already brings operating leases onto the balance sheets of firms and does not expect any material impact from the new accounting rule standard on their rating assessments: https://www.moodys.com/research/Moodys-changes-its-treatment-of-leases-in-response-to-new--PR_386685 Return to text
5. For more information on the Extensible Business Reporting Language: https://www.xbrl.org/the-standard/what/an-introduction-to-xbrl/. For more information on SEC's history with and requirements on the use of XBRL: https://www.sec.gov/page/osdhistoryandrulemaking Return to text
6. Note that the values reported in Table 1 differ from the values reported for Figure 1, which reflect the time-series evolution of the aggregate and median leverage ratios. Return to text
7. Although we focus this discussion on the impact of the accounting standard update on the liability side of the balance sheet, there are corresponding adjustments on the asset side of the balance sheet as firms also required to report any operating lease rights of use. Return to text
8. We do not expect the coefficient to be 1.0 as it is possible that some firms may preemptively reduce their debt in order to partially or fully offset the increase in leverage from the accounting rule change. Consistent with this intuition, we find that firms with larger amounts of operating lease liabilities have larger debt reductions than firms with lesser amounts of or no operating lease liabilities. Return to text
9. Taken altogether with the analysis in the previous section, the majority of the unexplained increase in the leverage ratio is likely driven by changes in assets, rather than liabilities. Return to text
10. We assume that the impact of operating lease on the asset side of the balance sheet can be well approximated by the XBRL-based measure of operating lease liabilities. If we obtain a negative value for adjusted total assets (1 instance), we use the unadjusted value. If we obtain negative values for adjusted total liabilities (113 instances), we set total liabilities to zero. Return to text
11. In theory, a firm's operating lease should be discounted using the firm's cost of debt. Yan (2006) uses a measure of operating lease that discounts each minimum rental commitment to present value, using a constant discount rate of 10 percent for all firms. Our regression-based analysis is consistent with such a discounted measure. Return to text
12. A XBRL-based measure is defined as consistent if the sum of Operating Lease Liability Current (OLL_C) and Operating Lease Liability Non-Current (OLL_NC) does not deviate from the Operating Lease Liability (OLL_XBRL) by more than 1 percent. If OLL_C or OLL_NC values are not available, then a XBRL-based measure is consistent if Operating Lease Right Use of Assets and Operating Lease Liability (OLL_XBRL) do not deviate by more than 1 percent. Return to text
Palazzo, Dino, and Jie Yang (2019). "Spike in 2019Q1 Leverage Ratios: The Impact of Operating Leases," FEDS Notes. Washington: Board of Governors of the Federal Reserve System, December 13, 2019, https://doi.org/10.17016/2380-7172.2464.
Disclaimer: FEDS Notes are articles in which Board staff offer their own views and present analysis on a range of topics in economics and finance. These articles are shorter and less technically oriented than FEDS Working Papers and IFDP papers.