


Commercial Paper Rates and Outstanding Summary
Year-end Commercial Paper Outstanding
RSS
Data Download
FRED
XML
Derived from data supplied by The Depository Trust & Clearing Corporation
Data as of October 14, 2026Posted October 15, 2026
This page will be updated weekly from October through December. The weekly pattern of commercial paper maturing after December 31 chart and table will be replaced each week. A new row will be added to the commercial paper maturing after December 31 table each week.
Weekly pattern of commercial paper maturing after December 31
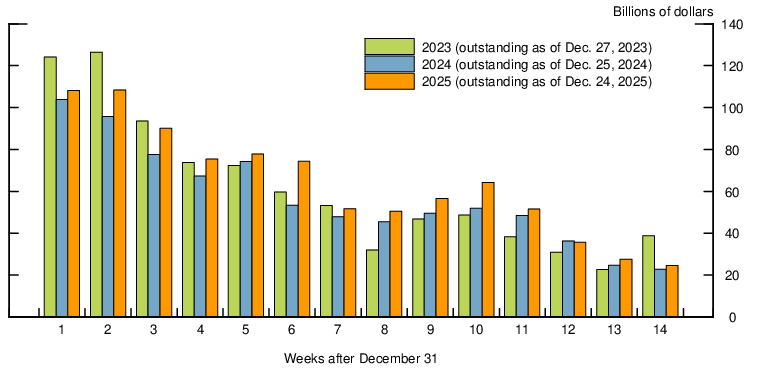
Billions of dollars
| Year | Weeks after December 31 | |||||||||||||
|---|---|---|---|---|---|---|---|---|---|---|---|---|---|---|
| 1 | 2 | 3 | 4 | 5 | 6 | 7 | 8 | 9 | 10 | 11 | 12 | 13 | 14 | |
| 2024* | 31.8 | 28.7 | 23.6 | 24.9 | 28.1 | 26.4 | 22.9 | 17.7 | 27.7 | 21.4 | 17.7 | 21.4 | 19.4 | 17.2 |
| 2025** | 43.4 | 37.1 | 33.1 | 21.4 | 30.2 | 31.1 | 21.2 | 26.7 | 30.6 | 31.5 | 18.2 | 19.2 | 17.0 | 15.6 |
| 2026*** | 44.3 | 26.5 | 27.6 | 22.5 | 36.6 | 25.6 | 24.1 | 25.6 | 22.4 | 20.0 | 23.5 | 26.5 | 18.0 | 17.1 |
* Outstanding as of October 16, 2024.
** Outstanding as of October 15, 2025.
*** Outstanding as of October 14, 2026.
** Outstanding as of October 15, 2025.
*** Outstanding as of October 14, 2026.
Commercial paper maturing after December 31
Last Update: October 15, 2026