FEDS Notes
November 05, 2019
Assessing Major Country Exposures of U.S. Banks Using 009a Data Reports: A Brexit Case Study
Alexander H. von Hafften1
- Introduction
The 009a Data Reports from the E.16 Country Exposure Lending Survey Statistical Release provide a bank-level view into major international exposures of U.S. commercial banks and bank holding companies.2 This bank-level view allows for detailed analysis of how international risks may affect the U.S. financial system. In this note, I describe the 009a Data Reports and discuss their features. The major benefit of the 009a Data Reports over aggregate U.S. banking system data is that we can see how international exposures have changed for banks individually. In addition, as an example of using the 009a Data Reports, I analyze how the U.K. and E.U. exposures of U.S. global systemically important banks (G-SIBs) have changed since the Brexit referendum on June 23, 2016.3,4,5
What are 009a Data Reports and where do they come from? The 009a Data Reports are based on the FFIEC 009a form, which supplements the FFIEC 009 form. The FFIEC 009 form requires respondent banks to detail international exposures to all foreign countries.6 In contrast, FFIEC 009a focuses on international exposures above a certain level based on the bank's size. While aggregate data based on FFIEC 009 are publically available, the bank-level data of FFIEC 009 are confidential.7 In contrast, the bank-level data from the FFIEC 009a are publically available.
The FFIEC 009a form and by extension the 009a Data Reports are broken up into two parts: Part A and Part B. The major difference between the parts is Part A provides more detail about these exposures than Part B. More specifically, Part A includes country exposures that exceed the lesser of 1 percent of the banks' total assets or 20 percent of its total capital.8 In the section 2, I'll explain some of the details that are included in Part A. In Part B of FFIEC 009a, the respondent bank lists (1) all other countries where its exposure exceeds the lesser of 0.75 percent of its total assets or 15 percent of its total capital and (2) the total exposures to all listed countries.
For all U.S. G-SIBs, their U.K. exposures are large enough to show up in Part A, while exposures to some smaller E.U. countries – for example, Ireland – often show up in Part B. As we walk through the details provided in Part A in section 2, we'll look at how the U.K. exposures of U.S. G-SIBs have changed over time. In section 3, we'll combine data from Part A and Part B to look at how their exposures have changed across Europe.
- Part A of the 009a Data Reports
In general, the 009a Data Reports include three types of country exposures: direct cross-border claims, foreign office claims, and gross derivative claims. In Part A, each of these exposures is reported separately. Part A also provides various breakdowns, including by borrower-type (i.e., bank, nonbank financial institution, public, and other) and maturity (i.e., over one year and one year or under).9 While the instructions for the FFIEC 009a ask banks to do the borrower-type and maturity breakdowns excluding gross claims on derivatives, reporting is inconsistent across the sample – in particular, some U.S. G-SIBs break out both derivative exposures and non-derivative exposures by borrower-type.
Country Exposure Breakdown by Borrower-Type
The borrower-type breakdown allows analysts to examine possible differences in credit risk associated with the exposures. For example, we can differentiate private sector exposures from public sector exposures. My approach is to designate "Private Sector Exposures" as direct cross-border claims and foreign office claims on banks, nonbank financial institutions, and other nonpublic entities as well as all gross derivative claims and "Public Sector Exposures" as direct cross-border claims and foreign office claims on public entities.10,11
Shown in the left panel of figure 1, U.K. private sector exposures across U.S. G-SIBs dropped from $466 billion to $295 billion (37 percent) between 2016:Q1 and 2019:Q1, likely representing a dramatic decline in these banks' vulnerability to Brexit-related risks.12,13 Furthermore, each G-SIB reduced their U.K. private sector exposure individually between 2016:Q1 and 2019:Q1. The largest reductions were Citigroup, Goldman Sachs, and Morgan Stanley, whose exposures each declined between $35 billion and $40 billion. The smallest reductions were Bank of New York Mellon and Wells Fargo, whose U.K. private sector exposures declined by $573 million and $498 million, respectively. All components of aggregate private exposures decreased over this period, but aggregate gross derivative claims dropped the most – from $121 billion to $46 billion – and account for the majority of the particularly steep decline in U.K. private sector exposures during 2016.14
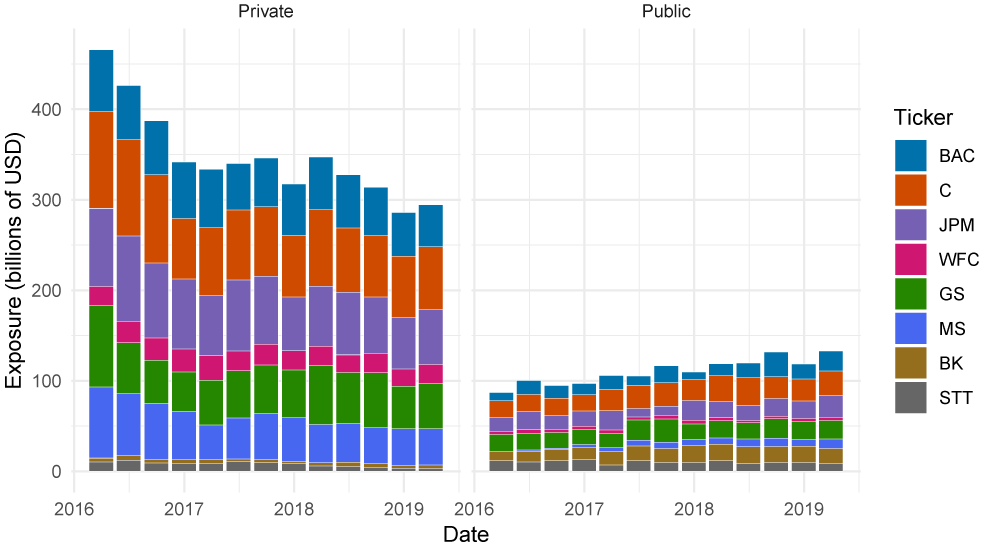
Note: Private sector exposures include all gross derivative claims and cross-border and foreign office claims on banks, nonbank financial institutions, and other. Public sector exposures include cross-border and foreign office claims on public entities. Legend entries appear in order from top to bottom.
Source: Country Exposure Lending Survey (E.16) 009a Data Reports Part A.
Shown in the right panel of figure 1, U.S. G-SIBs total exposure to the U.K. public sector rose from $87 billion to $133 billion (52 percent) between 2016:Q1 to 2019:Q1. These U.K. public sector exposures represent a growing fraction of total outstanding U.K. public debt.15,16 In particular, Morgan Stanley and Bank of America increased their U.K. public sector exposure the most, each by over $10 billion.17 Larger U.K. public sector exposures likely do not nullify the sizeable reduction in risk from smaller private exposures because public exposure likely represent less credit risk than private exposures.
Country Exposure Breakdown by Maturity
Another breakdown in Part A of the 009a Data Reports is between exposures that mature in more than one year and exposures that mature in one year or under.18 This breakdown allows us to consider other risks associated with these exposures. For example, shorter-term U.K. exposures likely represent less risk than longer-term U.K. exposures for U.S. G-SIBs because a bank can choose not to rollover the portion of the shorter-term exposures that will mature before a possible disruptive or disorderly Brexit, while a bank may be locked into longer-term exposures.
U.S. G-SIBs total exposure (private plus public) to the U.K. have become shorter term between 2016:Q1 and 2019:Q1. In 2016:Q1, almost 40 percent of non-derivative exposures matured in more than one year, and in 2019:Q1, less than 30 percent of these exposures matured in more than one year. As shown in figure 2, the change in the maturity of universal banks' exposures – Bank of America, Citibank, JPMorgan Chase, and Wells Fargo – has driven the overall change, while the maturity of custodial bank exposures – Bank of New York Mellon and State Street – and investment bank exposures – Goldman Sachs and Morgan Stanley – have generally stayed the same.
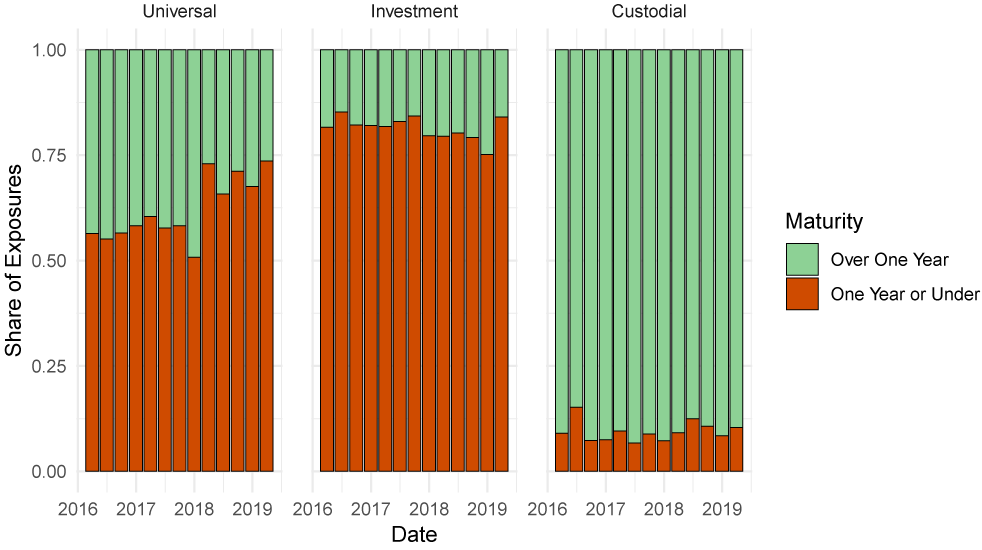
Note: Exposures include cross-border claims and foreign office claims and does not include gross derivative claims.
Source: Country Exposure Lending Survey (E.16) 009a Data Reports Part A.
Merging 009a Data Reports with Call Report Data
One approach for analysis of the 009a Data Reports data is to include other data, such as the FR Y-9C Call Reports. FR Y-9C Call Reports have ample information about bank holding company characteristics. One characteristic that could be particularly interesting is a measure of how large these country exposures are relative to the bank's capital. From a regulatory perspective, Tier 1 capital is the one of the primary measures of a bank's financial strength. In the context of looking at U.S. G-SIBs and U.K. exposures, higher U.K. private sector exposures relative to Tier 1 capital may reflect more vulnerability to a disruptive or disorderly Brexit.
As shown in figure 3, the investment banks – Goldman Sachs and Morgan Stanley – have the highest private sector exposures relative to their Tier 1 capital.19 Although they have declined dramatically, the private sector exposures of these banks still exceed 50 percent of their respective Tier 1 capital as of 2019:Q1. An important caveat to this observation is that the extent to which these exposures are hedged against adverse outcomes could mitigate concerns about the vulnerability to Brexit-related risks.
In comparison, the other U.S. G-SIBs appear to be less vulnerable to a disruptive or disorderly Brexit than the investment banks based on their U.K. exposures relative to Tier 1 capital. Although Bank of America, Citigroup, and JPMorgan have more private sector exposures in dollar terms, investment banks' exposures relative to their Tier 1 capital are much higher. Wells Fargo has very low U.K. exposures compared to the other seven G-SIBs, especially relative to its Tier 1 capital. The custodial banks fall between Wells Fargo and the three other universal banks; they appear to be less vulnerable to a disruptive or disorderly Brexit because most of their exposures—although longer-term (figure 2)—are to public entities (figure 1), which likely represent less credit risk.
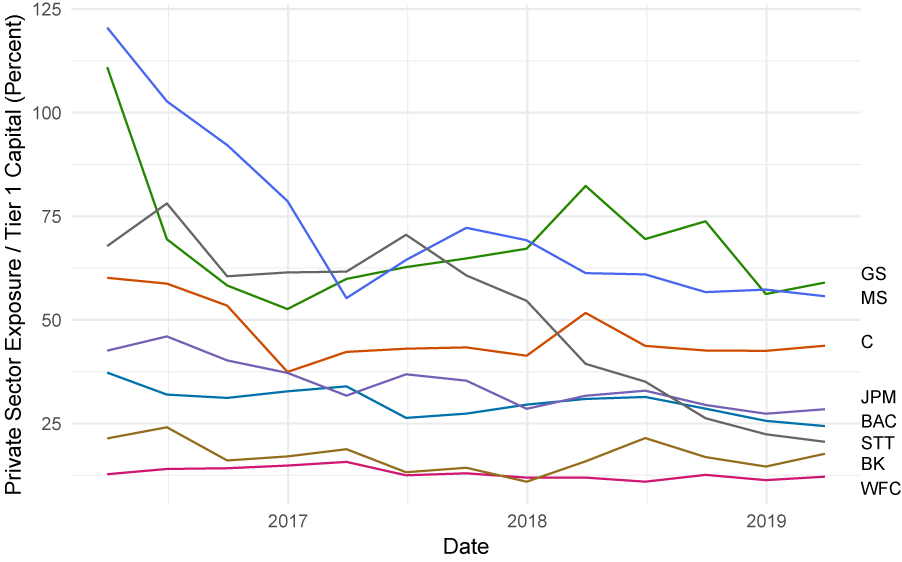
Note: Private sector exposures include all gross derivative claims and cross-border and foreign office claims on banks, nonbank financial institutions, and other.
Source: Country Exposure Lending Survey (E.16) 009a Data Reports Part A and FR Y9-C.
Based on looking at the 009a Data Reports and the FR Y-9C Call Reports, U.S. G-SIBs have substantially reduced their U.K. exposures since the 2016 Brexit referendum. This reduction has likely lowered the vulnerability of U.S. G-SIBs to Brexit-related risks, although the private sector exposures of the investment banks still appear high relative to their Tier 1 capital.
- Part B of the 009a Data Reports
As discussed in the introduction, Part B of the 009a Data Reports provide data on banks' exposures to additional countries. The country exposures in Part B exceed the lesser of 0.75 percent of the bank's total assets and 15 percent of its total capital.20 Instead of the detailed information provided in Part A, in Part B banks report the list of such countries and the total exposure across the list of countries.
Why might it be valuable to combine data from Part A with data from Part B? Including Part B provides a larger pool of countries to examine a bank's foreign exposures. For example, the finding that U.K. exposures decreased since the Brexit referendum raises questions about what happened to these exposures. Specifically, did the U.S. G-SIBs phase out their U.K. exposures or did they move them to other European countries? And if they moved exposures to other countries within the E.U., are these banks now more exposed to lower-risk core E.U. countries or higher-risk peripheral E.U. countries? Using Part A and Part B data together, I find that core E.U. exposures – to Belgium, Germany, France, Luxembourg, and the European Central Bank – of U.S. G-SIBs have steadily increased between 2016:Q1 and 2019:Q1. Their exposures to peripheral E.U. countries – Ireland, Italy, and Spain – are much smaller and, during the same period, have bounced up and down and in 2019:Q1 are about the same as in 2016:Q1.21
How much does incorporating Part B help us get a view into U.S. G-SIB exposures to the E.U.? For all U.S. G-SIBs, U.K. exposure are large enough to appear in Part A, but some smaller E.U. countries only appear in Part B for these banks during this period. As shown in table 1, incorporating Part B data more than doubles the number of observations for peripheral E.U. countries during this period.
Table 1: Number of Observations in Part A and Part B by Region
| Part A | Part B | |
|---|---|---|
| U.K. | 104 | 0 |
| Core E.U. | 248 | 44 |
| Peripheral E.U. | 49 | 55 |
| Other | 432 | 121 |
Note: Observations are at the bank-country-quarter level between 2016:Q1 and 2019:Q1 for the eight U.S. G-SIBs. Of countries listed by U.S. G-SIBs, the core E.U. countries are Belgium, Germany, France, and Luxembourg and peripheral E.U. countries are Ireland, Italy, and Spain. In addition, core E.U. include exposures to the European Central Bank.
Source: Country Exposure Lending Survey (E.16) 009a Data Reports Part A and B.
Since Part B only requires banks to list relevant countries and report the total exposure across listed countries, some approximation is required to combine data from Part A and Part B. To incorporate data from Part B data with Part A data, I use the following method:
- If the bank lists a single country in Part B, the exposure to that country is the total exposure reported;
- If the bank lists multiple countries, the exposure to each listed country is the lesser of 0.75 percent of the bank's total assets and 15 percent of the bank's total capital.
This approximation is, by construction, an underestimate; when a bank reports multiple countries in Part B, the approximation is the minimum exposure that would require the bank to report the exposure.
Figure 4 shows U.K. and E.U. exposures by region based on both Part A and Part B data. While the left panel shows U.K. exposures (in comparison to figure 1, figure 4 shows the sum of the private and public sector exposures), the center panel shows the core E.U. exposures. Between 2016:Q1 and 2019:Q1, core E.U. exposures steadily increased from $460 billion to $542 billion (18 percent). This increase accounted for 65 percent of the decrease in total U.K. exposures. The right panel of figure 4 shows peripheral E.U. exposures. Between 2016:Q1 and 2019:Q1, these exposures bounced around between $60 billion and $120 billion, starting and ending at $113 billion and $110 billion, respectively. This comparison suggests that the U.K. exposures of U.S. G-SIBs are not flowing into higher-risk peripheral E.U. countries.
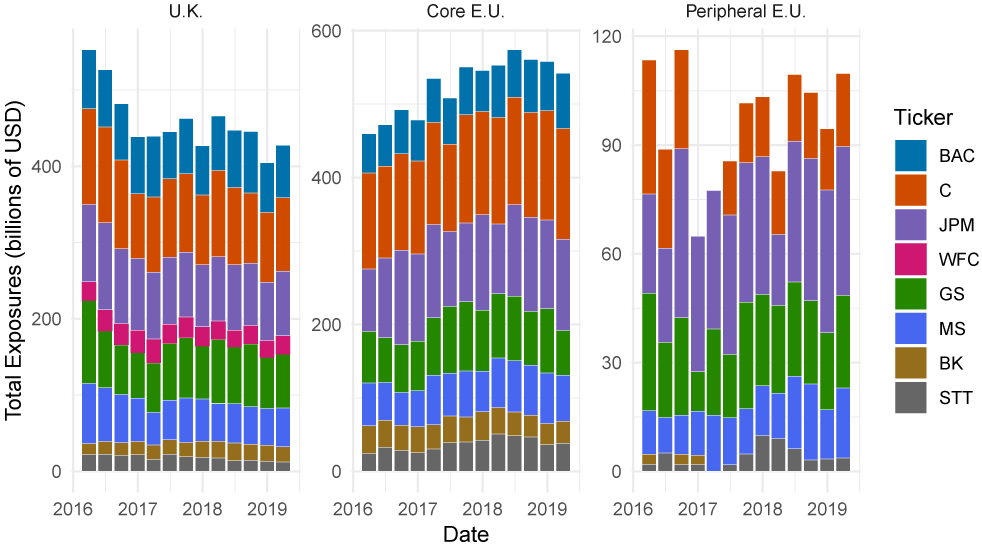
Note: Of countries listed by U.S. G-SIBs of 009a Data Reports Part A and B, the core E.U. countries are Belgium, Germany, France, and Luxembourg and peripheral E.U. countries are Ireland, Italy, and Spain. In addition, core E.U. include exposures to the European Central Bank. Legend entries appear in order from top to bottom. In the Core E.U. panel, WFC does not appear. In the Peripheral E.U. panel, BAC and WFC do not appear; BK only appears in 2016Q1, 2016Q3 and 2016Q4; C does not appear in 2016Q4 or 2017Q1; and STT does not appear in 2017Q1.
Source: Country Exposure Lending Survey (E.16) 009a Data Reports Part A and Part B and FR Y9-C.
- Conclusion
The 009a Data Reports provide a bank-level view into the major foreign exposures of large U.S. bank holding companies and commercial banks. In comparison to other public sources – namely, aggregate U.S. banking system statistics – these Data Reports provide this information on foreign exposures at the bank-level. Because exposures to a country are only included if they exceed a threshold based on the bank's size, these data are less helpful for analyzing country exposures that are relatively small.
1. I am grateful to Diana Hancock, Nathan Foley-Fisher, Michael Palumbo, and Doriana Ruffino for many helpful comments and suggestions. Return to text
2. The 009a Data Reports are available as PDFs with the E. 16 Country Exposure Lending Survey Statistical Release, available here: https://www.ffiec.gov/E16.htm. Because the data are in PDFs, assembling the data is nontrivial. The task of putting the data together for recent quarters is eased considerably by consistent formatting since 2013:Q4. Return to text
3. The outcome of Brexit remains uncertain: in April 2019, the U.K. government and the E.U. agreed to push the Brexit deadline until October 31st, 2019, and in August 2019, U.K. Prime Minister Boris Johnson prorogued the U.K. House of Commons. The Bank of England estimated that a disruptive or disorderly Brexit would reduce U.K. GDP by 4¾ to 7¾ percent relative to its trend. See "EU withdrawal scenarios and monetary and financial stability", Bank of England, November 2018. Return to text
4. Every year since 2011, the Financial Stability Board has identified eight U.S. banks as G-SIBs (tickers in parentheses): Bank of America (BAC), Bank of New York Mellon (BK), Citigroup (C), Goldman Sachs (GS), JPMorgan Chase (JPM), Morgan Stanley (MS), State Street (STT), and Wells Fargo (WFC). Return to text
5. The ultimate form of Brexit may affect U.S. G-SIBs through their U.K. exposures. In addition, U.S. G-SIBs may not be able to use London as a base for their operations in European markets, if the future relationship between the U.K. and the E.U. precludes passporting rights, which allows firms in the U.K. to do business in the E.U. without additional permits and licenses. An additional concern is the regulatory uncertainty around central counterparties for derivative clearing, namely the LCH Group, located in London. Return to text
6. Respondent banks include all U.S. commercial banks and bank holdings companies with $30 million or more in claims on residents of foreign countries. Return to text
7. Aggregate data from the FFIEC 009 feed into the international banking statistics published by the Bank of International Settlements: https://www.bis.org/statistics/about_banking_stats.htm. Return to text
8. Total capital is defined as the sum of Tier 1 and Tier 2 capital. Return to text
9. Beyond these elements, Part A includes details on foreign-office liabilities, securities (trading assets as well as held-to-maturity and available-for-sale), collateral, commitments and guarantees, and credit derivatives (purchased and sold). Return to text
10. The inclusion of all gross derivatives claims as "Private Sector Exposures" is based on the inconsistency of whether banks breakout non-derivative exposures or both non-derivative and derivate exposures in their borrow-type breakdown. Return to text
11. Public sector exposures include exposures to central, state, provincial, and local governments and their departments, and agencies; Treasuries, ministries of finance, central banks, stabilization funds, exchange authorities, and diplomatic establishments; and those government-owned banks, including development banks, that perform as an important part of their activities, the functions of a treasury, central bank, exchange control office, or stabilization fund. Return to text
12. Media coverage has focused on the process of U.S. G-SIBs moving their operations from London to cities in other European countries in anticipation of a severe form of Brexit. For example, Bank of America moved its European banking and markets operations to Dublin (https://www.reuters.com/article/us-britain-eu-bank-of-america/bank-of-america-completes-brexit-switch-to-dublin-idUSKBN1O20PD) and JPMorgan Chase shifted some of its London wealth management operations to Luxembourg (https://www.ft.com/ content/43e9d804-b5bf-11e8-bbc3-ccd7de085ffe). Recent coverage has highlighted that some U.S. G-SIBs are delaying planned moves (for example, https://www.bloomberg.com/news/ articles/2019-06-19/ goldman-citi-among-banks-postponing-assets-move-as-brexit-looms). Return to text
13. Some of this decline may be attributed to exchange rate changes as the pound has depreciated against the USD during this period. At prevailing exchange rates, the aggregate U.K. private sector exposures of U.S. G-SIBs dropped from £324 billion to £225 billion (31 percent) between 2016:Q1 and 2019:Q1. Return to text
14. Derivative exposures represent between 25 and 10 percent of aggregate exposures each quarter between 2016:Q1 and 2019:Q1. Return to text
15. Adjusting for depreciation of the pound against the USD expands this increase in exposures. At prevailing exchange rates, U.S. G-SIBs total exposure to the U.K. public sector rose from £61 billion to £101 billion (66 percent). Return to text
16. According the U.K. Office of National Statistics, U.K. general government gross debt grew by about 10 percent from £1,652 billion in 2016:Q1 to £1,821 billion in 2019:Q1. Due to the depreciation of the pound sterling over this period, U.K. public debt in USD was approximately constant. Return to text
17. Unique among the U.S. G-SIBs, Bank of New York Mellon's increase in public sector exposures is large enough that its total U.K. exposures (private plus public) have increased. Not all G-SIBs' public exposures increased; State Street decreased their U.K. public sector exposures. Return to text
18. Unlike the borrower-type breakdown, U.S. G-SIBs consistently report this breakdown only for cross-border claims and foreign office claims. Return to text
19. This comparison is similar relative to total assets – instead of Tier 1 capital – with only slight changes in the ordinal ranking across G-SIBs in 2019:Q1. The G-SIBs with the largest exposures relative to total assets are Goldman Sachs and Morgan Stanley at about 5 percent. Return to text
20. If the exposure exceeds the lesser of 1 percent of the bank's total asset and 15 percent of the bank's total capital, the country appears in Part A. Return to text
21. The distinction between core and peripheral E.U. countries is based on Campos and Macchiarelli (2018): https://voxeu.org/article/history-european-core-and-its-periphery. Return to text
Von Hafften, Alexander H. (2019). "Assessing Major Country Exposures of U.S. Banks Using 009a Data Reports: A Brexit Case Study," FEDS Notes. Washington: Board of Governors of the Federal Reserve System, November 5, 2019, https://doi.org/10.17016/2380-7172.2469.
Disclaimer: FEDS Notes are articles in which Board staff offer their own views and present analysis on a range of topics in economics and finance. These articles are shorter and less technically oriented than FEDS Working Papers and IFDP papers.