FEDS Notes
February 02, 2026
A Decomposition of Balance Sheet Reduction1
Benjamin Eyal, Dave Na, and Arsenios Skaperdas
Since the Global Financial Crisis, central banks have used the size and composition of their balance sheets to influence financial conditions and economic activity when policy rates are constrained by the effective lower bound. A common measure of the size of the Federal Reserve's balance sheet is the System Open Market Account (SOMA) securities holdings expressed as a share of nominal gross domestic product (NGDP). In this note, we use this measure to focus on the recent reduction in the Fed's balance sheet and decompose that reduction into three components: inflation, real GDP growth, and active reductions in securities holdings. Comparing the balance sheet reduction episode of 2022-2025 with the 2014-2019 period, we find that the active component—reductions in securities holdings—has played a significantly larger role. We find that this shift is consistent with changes in FOMC policy communications following the pandemic, which in turn reflect a policy response to higher inflation and lower unemployment than during the prior episode.
1. Introduction
In response to elevated inflation and a tight labor market following the coronavirus pandemic, the Federal Open Market Committee (FOMC) began unwinding its accommodative monetary policy stance in 2022. Alongside raising the federal funds rate, the Committee communicated that balance sheet reduction would proceed more quickly than in the prior episode. The Federal Reserve subsequently began reducing its holdings of Treasury securities and agency MBS, increasing the supply of longer-term securities to the public and putting upward pressure on longer-term interest rates (Vayanos and Vila, 2021, Li and Wei, 2018).
A commonly used measure of the size of the Federal Reserve's balance sheet is the ratio of the securities held in the SOMA to nominal GDP (SOMA/NGDP). Figure 1 presents the path of this ratio over the past two decades. A key feature of this ratio is that it reflects the natural decline of securities holdings as a share of the nominal size of the economy over time. For example, over the 2014-2019 episode of balance sheet reduction, the SOMA/NGDP ratio declined by about 2 percentage points between 2014 and 2017 even as the Federal Reserve kept its securities holdings constant.
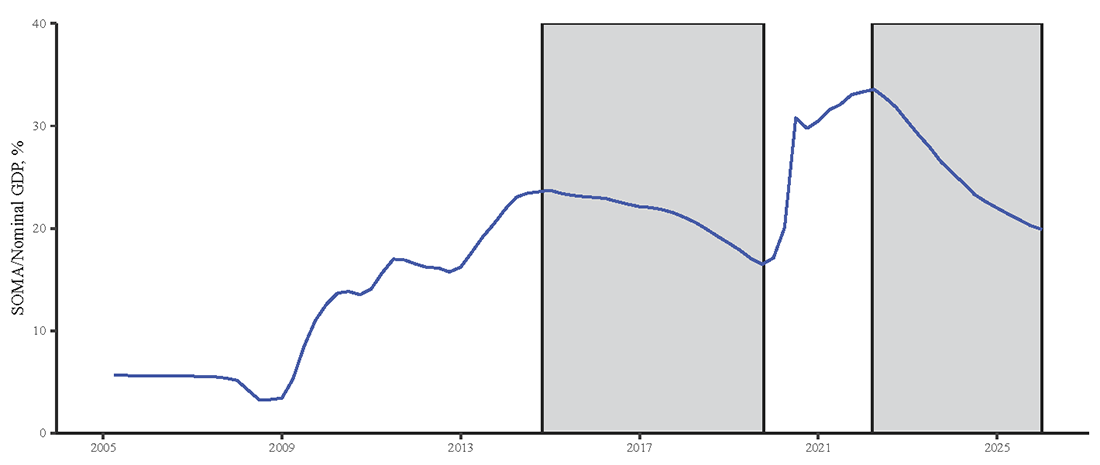
Note: Shaded areas represent the two episodes of balance sheet reduction (October 2014 – October 2019, March 2022 – December 2025).
Source: Federal Reserve Board, H.4.1; Bureau of Economic Analysis, Consumer Price Index; Bureau of Labor Statistics, Gross Domestic Product; Survey of Professional Forecasters; Authors' Calculations. Median forecasts from the Survey of Professional Forecasters are used for 2025:Q3 and 2025:Q4 values of RGDP growth and CPI inflation to calculate nominal GDP.
In contrast to the 2014-2019 period, balance sheet reduction over the 2022-2025 period has occurred over a shorter window and at a significantly faster pace. This note decomposes the factors driving balance sheet reduction into three components: inflation, real GDP growth, and active reductions in securities holdings. Consistent with changes in FOMC communications over the two episodes, we find that active reductions in securities holdings have played a significantly larger role in the current period and account for the faster pace of balance sheet reduction.
2. Methodology
To quantify the drivers of balance sheet reduction, we decompose changes in the SOMA-to-NGDP ratio into three components: declines in SOMA securities holdings, growth in real GDP, and growth in the price level (CPI inflation).
We begin by noting that the percentage change in the SOMA/NGDP ratio can be approximated as:
$$$$\Delta log(SOMA/NGDP)≈\Delta log(SOMA)-\Delta log(NGDP)$$$$
Because nominal GDP growth reflects changes in both the price level and real economic activity, we further decompose:
$$$$\Delta log(NGDP)≈\Delta log(Real GDP)+\Delta log(Price Level)$$$$
Combining these expressions yields:
$$$$\Delta log(SOMA/NGDP)≈\Delta log(SOMA)-\Delta log(Real GDP)-\Delta log(Price Level)\ (1)$$$$
For the purposes of this Note, we name declines in the SOMA/NGDP ratio caused by a decrease in SOMA securities holding as "active," as they require a direct policy decision by the FOMC. In contrast, we name reductions in this ratio that are due to growth in NGDP as "passive," as real economic growth and changes in the price level are affected by many factors other than the FOMC's policy decisions. To interpret magnitudes, we convert each log component $$i=SOMA, Real GDP$$, and the $$Price Level$$ in decomposition (1) into a share of the total log decline in the SOMA/NGDP ratio:
$$$${Share}^i=\Delta log(Component^i)/\Delta log(SOMA/NGDP)$$$$
Each share is then converted into a percentage‑point contribution by multiplying by the total change in the SOMA/NGDP ratio,
$$$${{Contribution}^i}_{t,t+h}={{Share}^i}_{t,t+h}\times\Delta (SOMA/NGDP)_{t,t+h}$$$$
where $$\Delta(SOMA/NGDP)_{t,t+h}$$ is the percentage-point reduction in the SOMA/NGDP ratio. We report these contributions from the quarterly peak $$t$$ of each balance sheet reduction episode through each quarterly horizon $$t+h$$. Contributions across the three components sum exactly to the total percentage‑point reduction in the SOMA/NGDP ratio.
As illustrated by the linearity of Equation (1), a key simplification in our analysis is that the components operate independently and do not interact with each other. In practice, however, reductions in the Fed's securities holdings are thought to put upward pressure on longer-term interest rates and thereby influence borrowing costs that may reduce economic activity and inflation (Crawley et al, 2022). In addition, under less conventional theories of central bank asset purchases, a decline in the quantity of central bank assets may reduce economic activity distinct from its effect on longer-term interest rates.2 Although the decomposition discussed in this note does not quantify the macroeconomic effects of balance sheet reduction, the associated effects on economic activity and inflation are likely to be modest (Krishnamurthy et al., 2022).
3. Findings
Figure 2 presents our decomposition on a quarterly frequency over the prior (left panel) and recent period (right panel) of balance sheet reduction. 3 Of note, the 14 percentage point decline over the current episode substantially exceeds the 7 percentage point reduction over the 2014-2019 period.
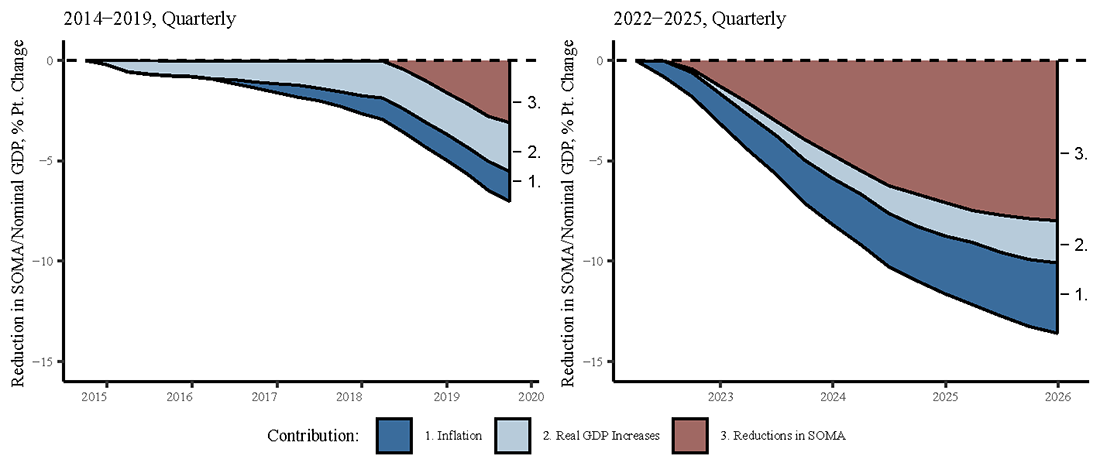
Note: Inflation and Real GDP Increases are considered passive factors.
Source: Federal Reserve Board, H.4.1; Bureau of Economic Analysis, Consumer Price Index; Bureau of Labor Statistics, Gross Domestic Product; Survey of Professional Forecasters; Authors' Calculations. Median forecasts from the Survey of Professional Forecasters are used for 2025:Q3 and 2025:Q4 values of RGDP growth and CPI inflation.
In the first episode of balance sheet reduction, the FOMC held its securities holdings constant for a few years before it began to reduce holdings in 2017. As a result, the passive factors of real GDP growth, represented in light blue, and inflation, represented in dark blue, drove more than half (56 percent) of the overall reduction in the SOMA to NGDP ratio between 2014 and 2019. Beginning in 2017, active reductions in securities holdings, represented in red, accounted for much of the additional decline.
In comparison, the current episode of balance sheet reduction is more accelerated than the 2014-2019 period and resembles the peak active phase of that period. The reduction has been primarily driven by reductions in the SOMA portfolio, with the active component comprising about 59 percent of the total decline in the SOMA to NGDP ratio. In a reflection of inflation associated with the aftermath of the coronavirus pandemic, the inflation component accounts for a 26 percent share of total balance sheet reduction, while growth in real GDP has accounted for about a 15 percent share.
The significantly larger role played by active reductions in securities holdings over the current period is consistent with changes in FOMC communications and the policy response to the post-pandemic economic environment. The 2014 Policy Normalization Principles and Plans emphasized a "gradual and predictable" reduction in the balance sheet following several years of inflation below target.4 In contrast, policymakers noted in 2022 that "the U.S. economy was very strong, with an extremely tight labor market, and that inflation was high and well above the Committee's 2 percent inflation objective." As a result, policymakers emphasized that a faster pace of balance sheet runoff "would play an important role in firming the stance of monetary policy."5 Moreover, participants at the January 2022 FOMC meeting noted that in light of the "high level of the Federal Reserve's securities holdings, a significant reduction in the size of the balance sheet would likely be appropriate."6 Our findings confirm that the subsequent pace and magnitude of balance sheet reduction since 2022 proceeded in line with these revised communications.
References
Auerbach, Alan J., and Maurice Obstfeld. "The case for open-market purchases in a liquidity trap." American Economic Review 95.1 (2005): 110-137.
Crawley, Edmund, Etienne Gagnon, James Hebden, and James Trevino (2022). "Substitutability between Balance Sheet Reductions and Policy Rate Hikes: Some Illustrations and a Discussion," FEDS Notes. Washington: Board of Governors of the Federal Reserve System, June 03, 2022.
Jacobson, Margaret, and Arsenios Skaperdas. "The Quantity Channel of Central Bank Asset Purchases," working paper (2025).
Krishnamurthy, Arvind, Sydney C. Ludvigson, and Jonathan H. Wright. "Panel on Shrinking the Federal Reserve Balance Sheet." Brookings Papers on Economic Activity 2022 (2022): 231-280.
Li, Canlin, and Min Wei. "Term Structure Modeling with Supply Factors and the Federal Reserve's Large-Scale Asset purchase Programs." 30th issue (March 2013) of the International Journal of Central Banking (2018).
Vayanos, Dimitri, and Jean‐Luc Vila. "A preferred‐habitat model of the term structure of interest rates." Econometrica 89.1 (2021): 77-112.
1. We thank Sriya Anbil, David Bowman, Chris Gust, Sebastian Infante, Kyungmin Kim, and Romina Ruprecht for helpful comments. Return to text
2. Auerbach and Obstfeld (2005) present a model in which a permanent change in central bank holdings of government debt affects output and inflation. Jacobson and Skaperdas (2025) study how the Federal Reserve's securities holdings influence output and inflation by altering the public's tax obligations. Return to text
3. Consistent with the FOMC’s October 2025 statement, we assume that reductions in securities holdings end on December 1, 2025. We set the runoff of Treasury and MBS in November 2025 to their values in October 2025. Return to text
4. https://www.federalreserve.gov/monetarypolicy/files/fomc_policynormalization.pdf. Return to text
5. https://www.federalreserve.gov/monetarypolicy/fomcminutes20220316.htm and https://www.federalreserve.gov/monetarypolicy/fomcminutes20140917.htm. Return to text
6. https://www.federalreserve.gov/monetarypolicy/fomcminutes20220126.htm. Return to text
Eyal, Benjamin, Dave Na, and Arsenios Skaperdas (2026). "A Decomposition of Balance Sheet Reduction," FEDS Notes. Washington: Board of Governors of the Federal Reserve System, February 02, 2026, https://doi.org/10.17016/2380-7172.3968.
Disclaimer: FEDS Notes are articles in which Board staff offer their own views and present analysis on a range of topics in economics and finance. These articles are shorter and less technically oriented than FEDS Working Papers and IFDP papers.