FEDS Notes
November 24, 2025
A Note on Recent Dynamics of Consumer Delinquency Rates
Robert Adams, Cord Barnes, Connor Bopst, and Kamila Sommer
Introduction
After plummeting to all-time lows during the pandemic, delinquencies on credit cards and auto loan debt increased to levels not observed since the Great Financial Crisis (GFC), raising concerns about the health of household balance sheets. In this note, we use credit records from the Federal Reserve Bank of New York Consumer Credit Panel/Equifax (CCP) — a nationally representative random sample of anonymized Equifax credit bureau data1— to discuss developments in the credit card and auto loan delinquency rates since the onset of the Covid 19 pandemic through the third quarter of 2025. We show that credit card and auto loan delinquency rates started to flatten, on net, in the quarters leading up to 2025:Q3. While the credit performance on credit cards remained stable across credit scores, income groups, and by homeownership status, auto loan delinquencies picked up for lower-income households in the third quarter.
Trends in credit performance during the Covid 19 pandemic
As shown in figure 1, the aggregate delinquency rates for credit cards and auto loans declined in the early stages of the pandemic against the backdrop of fiscal support and household deleveraging.2 As delinquency rates and leverage decreased, the credit score distribution of U.S. households moved up, leading to a decline in the share of nonprime borrowers (Goodman et al., 2021; Driscoll et al., 2024). However, starting in 2021:Q3, the credit card and auto loan delinquency rates started to rebound, reaching or exceeding pre-pandemic levels by 2023:Q1, and the upward credit migration started to gradually unwind (figure 2).
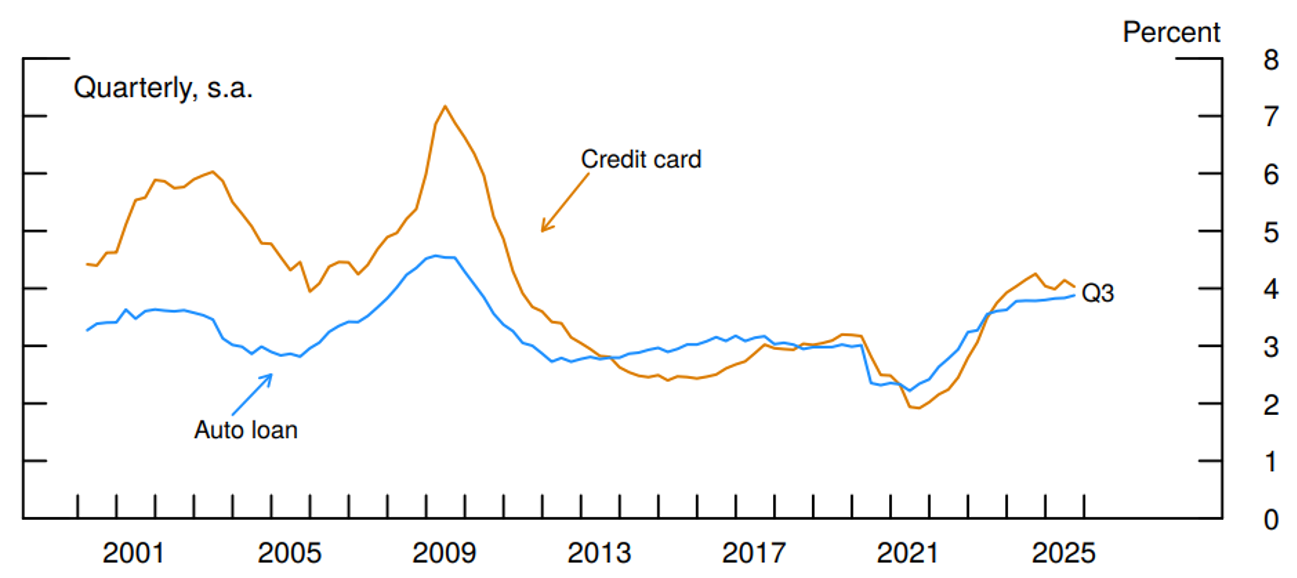
Note: Delinquency rate measures the fraction of balances at least 30 days past due, excluding severely derogatory balances. Data are seasonally adjusted.
Source: Federal Reserve Bank of New York Consumer Credit Panel/Equifax
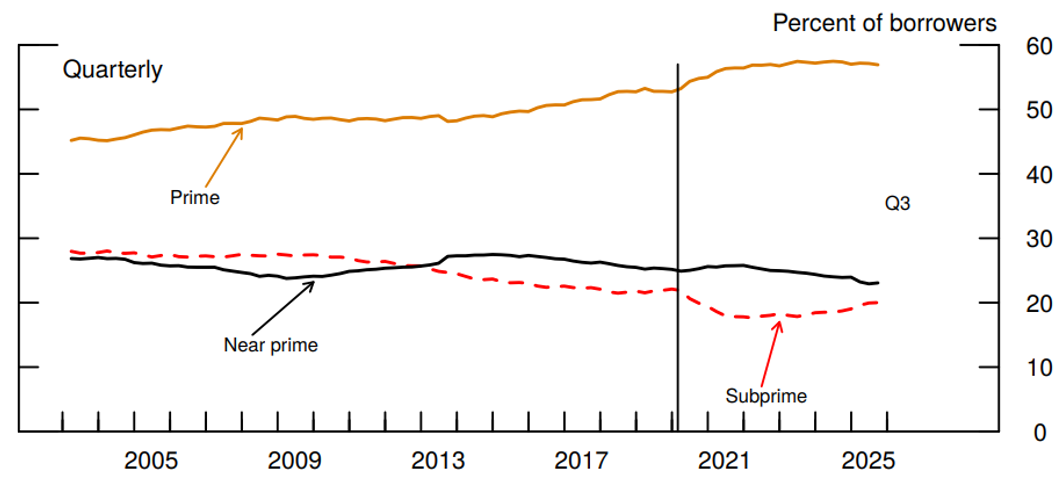
Note: Subprime is less than 620, near prime is between 620 and 719, prime is greater than 719. Credit scores are measured contemporaneously. The black line in 2020:Q1 marks the approximate start of the Covid-19 pandemic.
Source: Federal Reserve Bank of New York Consumer Credit Panel/Equifax
There are several factors that may be associated with the deterioration of consumer credit performance since 2021. For credit cards, studies of past episodes of economic stimulus generally find that households pay down credit card debt in months following the receipt of economic stimulus but start to re-leverage again as the effects of the stimulus fade, with the debt levels gradually reverting to (and sometimes exceeding) the pre-stimulus levels (Agarwal, Liu, and Souleles, 2007; Agarwal and Qian, 2014). The sharp increase in leverage can coincide with deterioration in credit performance. Indeed, Barnes et al. (2025) find that the rise in aggregate credit card debt, along with other factors such as laxer lending standards, is a strong predictor of the rise of credit card delinquencies and is likely one of the key drivers of the pandemic-period rise in credit card delinquency rates. During the pandemic, leverage also increased for auto loans, as higher auto prices required households to borrow more to finance their vehicle purchases. Larger amounts financed, along with higher interest rates, caused monthly payments to rise nearly 30 percent between 2020 and 2023, which in turn contributed to higher auto delinquency rates (Adams et al. 2024).3
Trends in credit performance in recent quarters
These trends appear to have been fading in the recent quarters. As can be seen in figure 1, the seasonally adjusted credit card delinquency rate declined, on net. Meanwhile, the seasonally adjusted auto loan delinquency rate was about flat from early 2024 through the second quarter of 2025, but inched up in the third quarter. In addition, year-over-year changes in delinquency rates, which are unaffected by any potential distortions associated with seasonal adjustment, decelerated substantially since their respective peaks in 2023:Q2 and 2022:Q2 (figure 3). In 2025:Q1, both the credit card and auto delinquency rates were—for the first time since the pandemic ended—roughly unchanged or lower than a year earlier, although the rates inched up for auto loans in the second and third quarters.
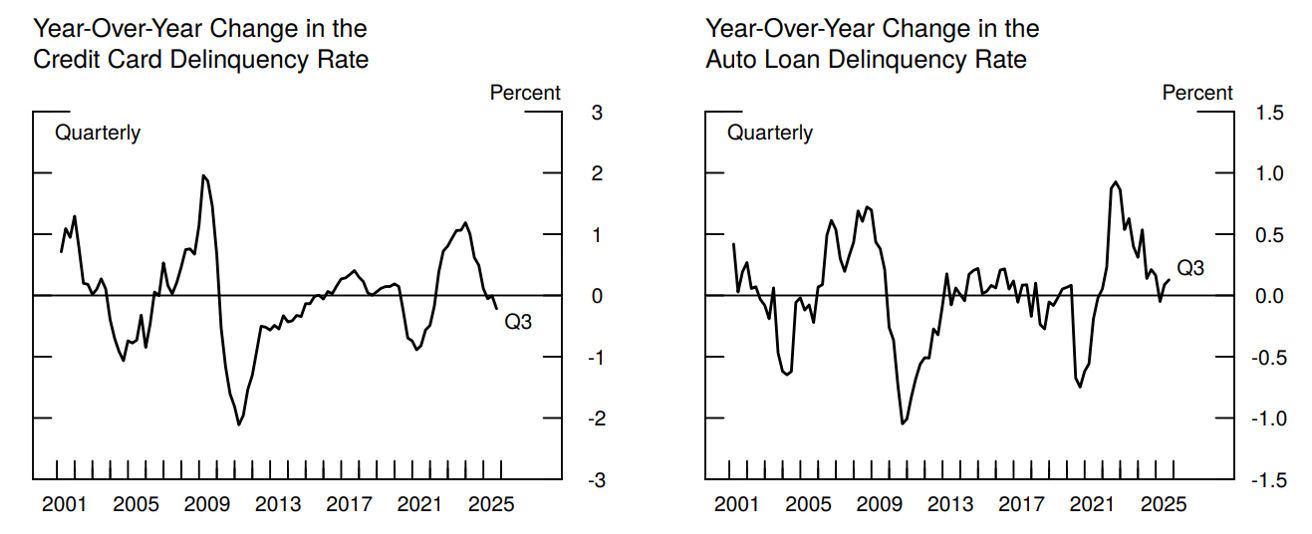
Note: Delinquency rate measures the fraction of balances that are at least 30 days past due, excluding severely derogatory loans. Series in this figure are constructed by differencing the delinquency rate with its value one year prior.
Source: Federal Reserve Bank of New York Consumer Credit Panel/Equifax
Fading or reversals of the factors that contributed to the rise in the credit card and auto loan delinquency rates over the past few years are likely behind their recent leveling as well. First, the analysis in Barnes at al. (2025) suggests that the slowdown in credit card borrowing since early 2024, as well as the lagged effects of past tightening in bank credit lending standards, likely have contributed to the recent stabilization of the credit card delinquency rate. Second, the moderation of light vehicle price increases since the start of 2023 meant that monthly payments for subsequent auto loans stopped growing as rapidly and, as a result, auto loan delinquency rates started to flatten. However, auto prices remain elevated and will likely continue to weigh on auto loan performance, as recent auto vintages continue to experience higher delinquency rates than the pre-pandemic vintages (figure 4). Moreover, on a seasonally adjusted basis, the auto loan delinquency rate picked up 5 basis points in the third quarter—the largest quarterly increase since 2024:Q1, suggesting that renewed stress in the auto sector may be building for some groups.
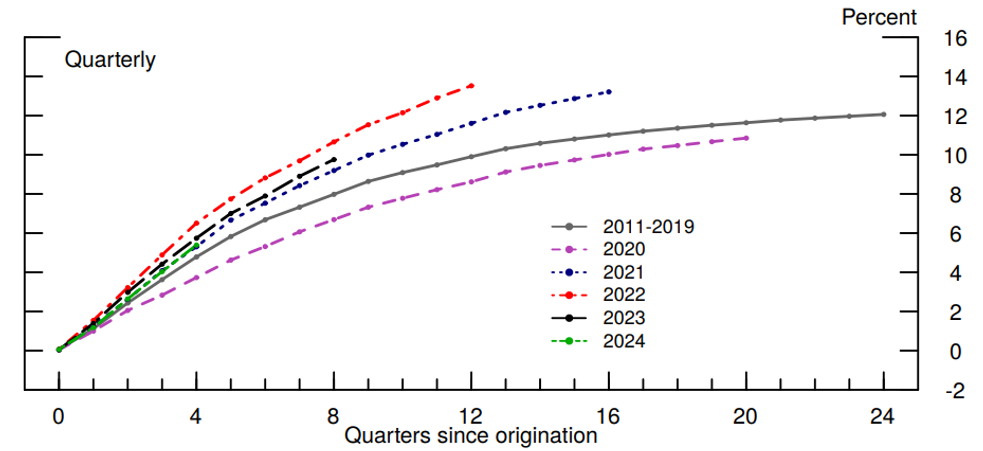
Note: By origination vintage. For brevity, figure only includes loans originated in Q3 of each year.
Source: Federal Reserve Bank of New York Consumer Credit Panel/Equifax
To explore this further, we next present a set of delinquency measures by credit score and income groups, as well as by homeownership status. To start, figure 5 shows the credit card and auto loan delinquency rates by credit score bin and demonstrates that credit performance appears to have flattened across the three credit score categories for credit cards, with the subprime, near-prime, and prime groups all showing a flattening (or even declines) in their respective delinquency rates through the third quarter.4 Meanwhile, the delinquency rates for non-prime auto loan borrowers inched up.
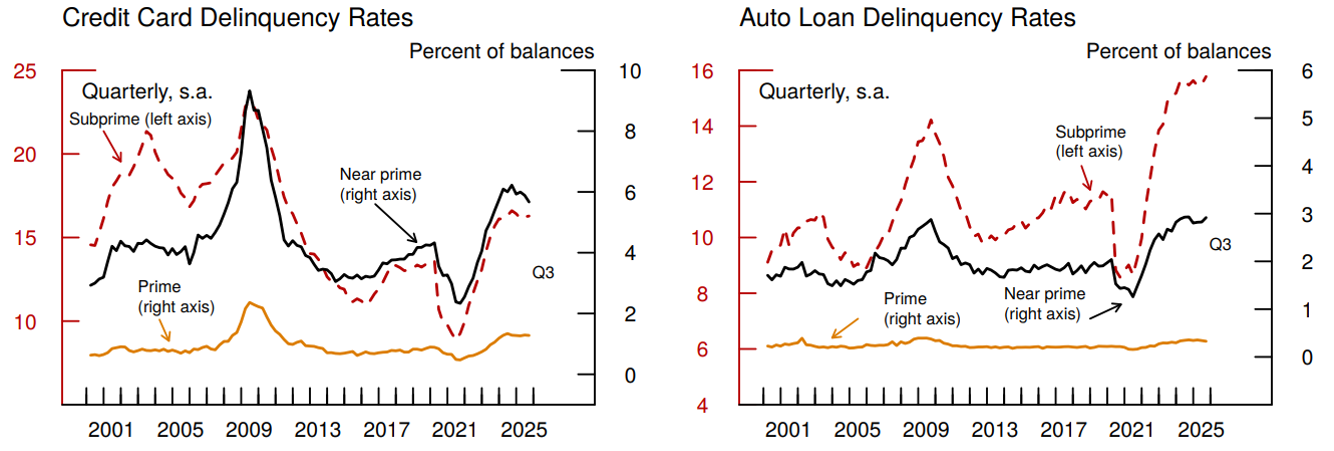
Note: Delinquency rate measures the fraction of balances that are at least 30 days past due, excluding severely derogatory loans. The subprime series uses the left axis, while the near prime and prime series use the right axis. Subprime is less than 620, near prime is between 620 and 719, prime is greater than 719. Credit scores are lagged by one year. Data are seasonally adjusted.
Source: Federal Reserve Bank of New York Consumer Credit Panel/Equifax
Figure 6 shows the delinquency rates by Census Tract income level.5 Similarly, credit card delinquency rates are mostly flat or declining across households residing in the low- to high-income Census Tracts. That said, the seasonally adjusted auto loan delinquency rates for households living in low- and moderate-income Census Tracts (which account for 4 percent and 19 percent of outstanding auto balances, respectively) picked up notably in the third quarter, rising about 70 and 25 basis points.
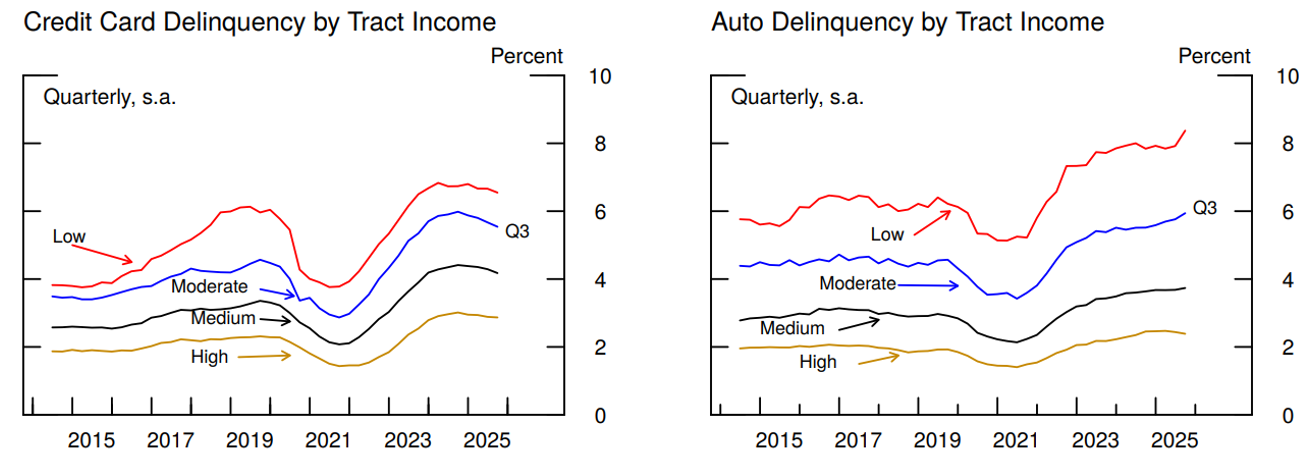
Note: Delinquency rate measures the fraction of balances that are at least 30 days past due, excluding severe derogatory loans. Data are seasonally adjusted.
Source: Federal Reserve Bank of New York Consumer Credit Panel/Equifax
Finally, figure 7 shows delinquency rates for households with and without mortgages (loosely referred to as "homeowners" and "renters"). While credit card delinquency rates flattened for homeowners and renters, auto loan delinquency rates inched up in the third quarter for renters.
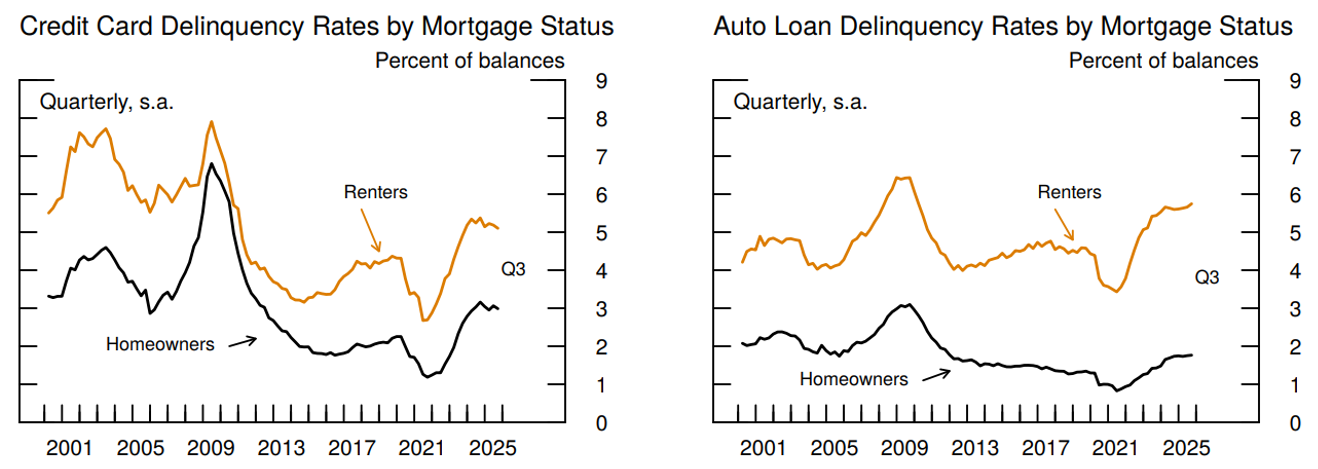
Note: Delinquency rate measures the fraction of balances that are at least 30 days past due, excluding severe derogatory loans. Data are seasonally adjusted. Homeownership is proxied through presence of a mortgage loan.
Source: Federal Reserve Bank of New York Consumer Credit Panel/Equifax
Conclusion
Looking across a range of metrics, we find that delinquency rates started to flatten for credit cards and auto loans in quarters leading up to 2025:Q3. However, auto loan delinquency rates picked up in the third quarter, and further increases may be in store. Since a range of macroeconomic factors—such as inflation, unemployment, leverage, interest rates, or lending conditions—affect the dynamics of delinquency rates, credit performance can change as these (and other) fundamentals change.
References:
Adams, Robert, Vitaly Bord, and Bradley Katcher (2021): The Fed - Why Did Credit Card Balances Decline so Much during the COVID-19 Pandemic.
Adams, Robert, Vitaly Bord, and Haja Sannoh (2024): The Fed - Rising Auto Loan Delinquencies and High Monthly Payments
Agarwal, Sumit, Chunlin Liu, and Nicholas Souleles "The Reaction of Consumer Spending and Debt to Tax Rebates—Evidence from Consumer Credit Data", Journal of Political Economy, 2007, Vol. 115, no.6.
Agarwal, Sumit, and Wenlan Qian "Consumption and Debt Response to Unanticipated Income Shocks: Evidence from a Natural Experiment in Singapore." American Economic Review, 2014, 104 (12): 4205–30.
Barnes, Kayleigh, Connor Bopst, and John Driscoll (2025): The Fed - Predicting Credit Card Delinquency Rates
Bord, Vitaly and Lucas Nathe (2021): The Fed - Delinquency Rates and the "Missing Originations" in the Auto Loan Market
Driscoll, John, Jessica Flagg, Bradley Katcher, and Kamila Sommer (2024): The Fed - The Effects of Credit Score Migration on Subprime Auto Loan and Credit Card Delinquencies
Goodman, Sarena, Geng Li, Alvaro Mezza, and Lucas Nathe (2021): The Fed - Developments in the Credit Score Distribution over 2020
Lee, Donghoon and Wilbert van der Klaauw "An Introduction to the FRBNY Consumer Credit Panel (PDF)", Federal Reserve Bank of New York Staff Reports, no. 479 November 2010
1. See: Lee and Van der Klaauw (2010) An Introduction to the FRBNY Consumer Credit Panel (PDF). Return to text
2. Adams, Bord, and Katcher (2021) provide suggestive evidence on the role of economic stimulus checks in household credit card deleveraging during the pandemic. See: The Fed - Why Did Credit Card Balances Decline so Much during the COVID-19 Pandemic. Bord and Nathe (2021) show that the decline in auto delinquency rates at the onset of the pandemic was associated with a sharp tightening of credit conditions, which reduced the number of subprime auto originations. Return to text
3. Our analysis excludes accounts with severely derogatory records as such accounts are typically closed and have been charged off lenders' books, therefore they no longer reflect household current debt service capability. Measures of delinquencies are higher if such accounts are included (see, for example, New York Fed's Household Debt and Credit Report.) Return to text
4. Driscoll et. al. (2024) show that while subprime delinquency rates are still well above their post-GFC averages, the high rates are driven largely by changes in the credit score distribution. Return to text
5. We use relative income as defined by the Consumer Reinvestment Act. See CRA Low- and Moderate Income for definitions. Return to text
Sommer, Kamila, Robert Adams, Connor Bopst, and Cord Barnes (2025). "A Note on Recent Dynamics of Consumer Delinquency Rates," FEDS Notes. Washington: Board of Governors of the Federal Reserve System, November 24, 2025, https://doi.org/10.17016/2380-7172.3921.
Disclaimer: FEDS Notes are articles in which Board staff offer their own views and present analysis on a range of topics in economics and finance. These articles are shorter and less technically oriented than FEDS Working Papers and IFDP papers.