FEDS Notes
December 03, 2021
Why Did Credit Card Balances Decline so Much during the COVID-19 Pandemic
Robert M. Adams, Vitaly M. Bord, and Bradley Katcher
1. Introduction
Consumer credit card balances in the United States experienced unprecedented declines during the COVID-19 pandemic. According to the G.19 Consumer Credit statistical release, revolving consumer credit fell more than $120 billion (11 percent) in 2020, the largest decline in both nominal and percentage terms in the history of the series. Revolving consumer credit fell an additional $28 billion (almost 3 percent) between December 2020 and April 2021, before beginning to recover.
In this Note, we examine the major drivers of this decline in balances using account-level data. Following up on our previous Note, "The Effects of the COVID-19 Shutdown on Consumer Credit Markets: Revolvers versus Transactors," we show that most of the initial decline in credit card balances in mid-2020 was primarily due to a decrease in purchase volume. Subsequently, as spending on credit cards rebounded, three additional factors came into play: higher paydowns of revolving balances; increases in the share of purchases that are paid down prior to statement close (and are not reflected in balances); and changes in the issuance and usage of new cards.
We find that both paydowns and prepayments rose sharply to historically high levels by April 2021, and we also present evidence consistent with stimulus programs driving some of the higher paydowns. These higher paydowns dampened growth in credit card balances through April, before subsiding somewhat as the stimulus payments waned. In addition, changes in both the number and usage of new cards originated since the start of the pandemic contributed to decline in balances, explaining approximately 20 percent of the decline in 2020 and 13 percent of the decline in the first four months of 2021.
Throughout this note, we use account-level credit card data from the Capital Assessments and Stress Testing Report (FR Y-14M). The Y-14M data provide information on all credit card accounts for the largest banking organizations (that is, those involved with stress testing). For more information on our dataset, please see Adams and Bord (2020).
2. Credit Card Purchases
We begin our analysis by examining the components of credit card balances during the COVID-19 pandemic.
Figure 1 shows the total credit card balances, separated into its 3 main components: revolving balances—defined as the previous statement balance minus payments; net purchase volume, defined as purchase volume minus any early payments that pay down these purchases prior to statement close, and other charges such as balance transfers. After falling from a high of about $625 billion in January 2020 to less than $550 billion in December 2020, total balances dropped further to about $500 billion by April 2021 before recovering to $520 billion by July 2021.
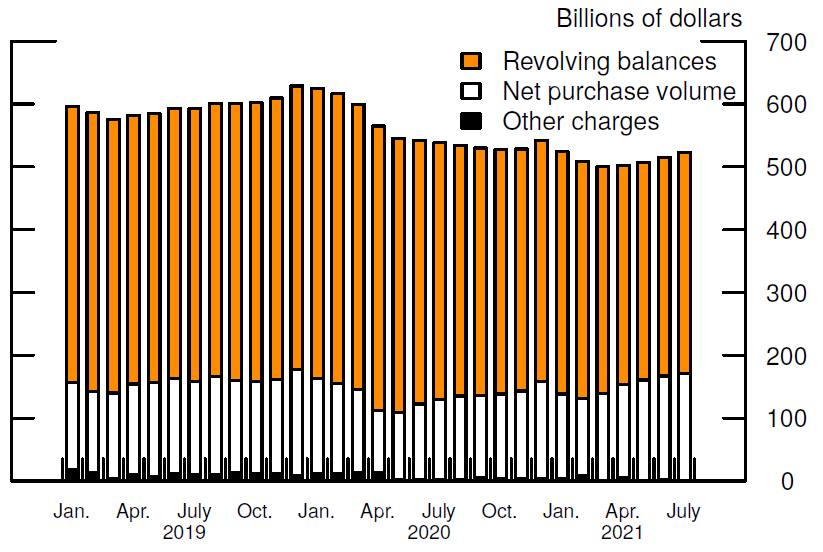
Note: Revolving balance is the previous statement balance minus any payments. Net purchase volume is new consumer purchases using credit cards less any prepayment of these purchases. Other charges are finance charges, fees, and other charges posted to the account. Key identifies bars in order from top to bottom.
Source: Federal Reserve Board, Form FR Y-14M, Capital Assessments and Stress Testing.
As discussed in Adams and Bord (2020), the initial stage of the decline in balances was mainly driven by the decline in credit card purchases. Net purchase volume fell from $151 billion in January 2020 to a low of less than 100 billion in April before rebounding slowly.1 By January 2021, net purchase volume stood at $135 billion, approximately 10 percent below January 2020 levels. This slow rebound in purchase volume ended in April 2021, as credit card spending took off amid widespread vaccinations and the general opening of the economy.2 Net purchase volume rose from $140 billion in March 2021 to $170 billion by July.3
Although the drop in credit card purchases explains the decrease in balances in the first months of the pandemic, balances continued to decline through most of 2020, even as purchase volume slowly recovered. This decline in balances occurred as revolving balances—that is, balances that borrowers carry on their accounts for a prolonged period which may accrue interest charges—fell from about $460 billion in January 2020 to $348 billion by April 2021, before inching up to $352 billion by July. We next examine how changes in consumer payment behavior drove this decline in revolving balances.
3. Changes in Consumer Payments
We identify two channels through which payments reduced balances: paydowns of existing revolving balances and pre-payment of purchases before a statement closes so they are never reflected in statement cycle-end balances.
3.1 Paydowns
The first channel focuses on declines caused by consumers paying off their revolving balances. As Figure 2 shows, payments in excess of the minimum due as a fraction of the previous statement balance (in blue) reached historical highs of around 15 percent in early 2021, up from around 12 prior to the pandemic.4
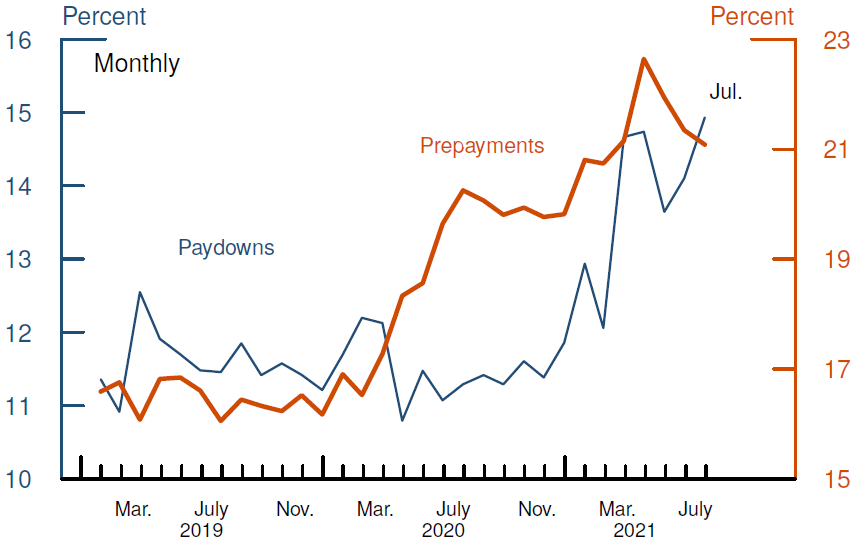
Note: Paydowns are payments in excel of minimum due as a percentage of previous statement balance for borrowers with a revolving balance in the previous month. Prepayments are percent of purchase volume paid down before statement close.
Source: Federal Reserve Board, Form FR Y-14M, Capital Assessments and Stress Testing.
We next examine the role of the stimulus payments in these higher paydowns. Figure 3 decomposes payments into those made by accounts eligible for the stimulus checks in 2020 and 2021 (in blue) and those ineligible (in orange).5 After undergoing only small changes in payments early in the pandemic, borrowers eligible for the stimulus increased their paydowns substantially at the start of 2021, likely supported by the second and third rounds of stimulus.6 Indeed, the large surges in paydowns among borrowers eligible for the stimulus occur in January and March, at about the same time as the second and third stimulus.7 Consistent with this, paydowns by borrowers eligible for the stimulus dropped sharply in May 2021, before recovering somewhat over the following months.8
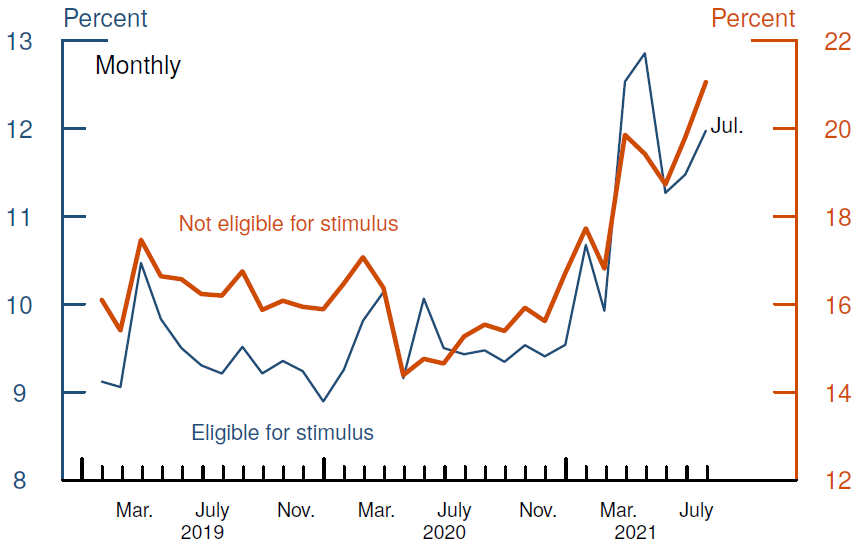
Note: Paydowns are payments in excel of minimum due as a percentage of previous statement balance for borrowers with a revolving balance in the previous month. Eligible for full stimulus are borrowers with reported individual (household) income of less than $75,000 ($150,000). Ineligible are borrowers with individual (household) income of more than $100,000 ($200,000).
Source: Federal Reserve Board, Form FR Y-14M, Capital Assessments and Stress Testing.
That said, borrowers ineligible for stimulus checks also paid down balances at similarly high or even higher rates during this time. Credit card users ineligible for the stimulus may be using other sources of income and wealth to pay down credit card balances. Higher-income consumers are more likely to own stocks or a house and since both the stock market and housing markets experienced significant gains during the pandemic, these higher payments by stimulus-ineligible borrowers in the winter and spring of 2021 may reflect a wealth effect arising from increases in the values of these assets. In addition, higher-income households experienced a larger rise in excess savings, stemming in part from a cumulative decline in consumption (Batty, Deeken and Volz, 2021). This increase in excess savings also may have led to higher debt paydowns. Finally, besides stimulus payments and the potential wealth effects, consumers also could have changed their consumption, saving, and credit card payment behavior during the pandemic.9
3.2 Prepayment
The second channel through which balances decline focuses on the higher prevalence of prepayments. A prepayment occurs when a borrower makes a payment towards purchases prior to the statement closing. For example, sometimes borrowers pay for large credit card purchases before they receive their statements.10 Another example occurs when transacting users pay more than the statement balance, effectively paying down new purchases between statement closing date and the payment due date.11 As the share of transactors—that is, accounts that do not revolve a balance—increases, the share of accounts making early payments also tends to rise.
Since April 2020, the share of accounts with revolving balances fell sharply, first due to the declines in spending during the early parts of the pandemic and then due to the substantially higher payments discussed earlier. Indeed, as Figure 4 shows, the share of accounts that revolve a balance, in orange, declined from around 40 percent in early 2020 to a historical low of 33 percent by April 2021, before beginning to recover somewhat in the following months. Similarly, the share of accounts that make early payments, in blue, increased from 19 to almost 26 percent by April 2021, then declined to 24 percent by July.12
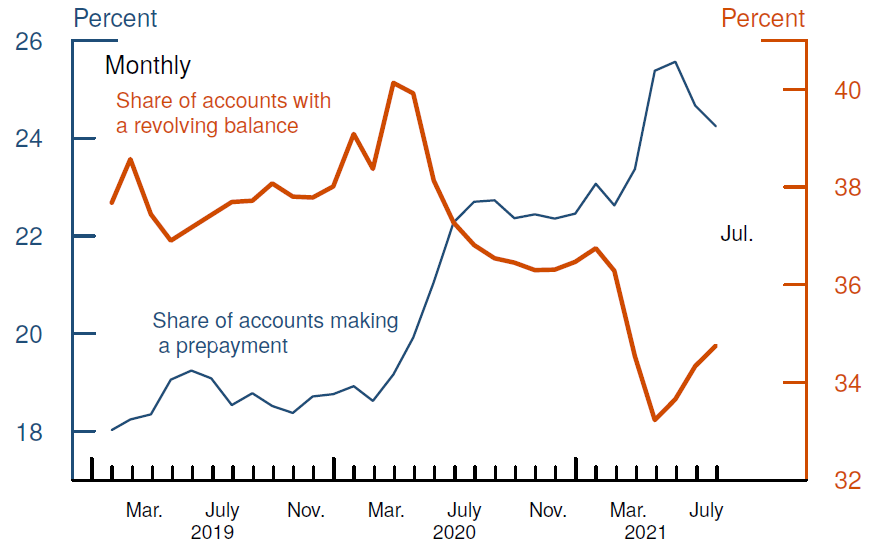
Note: Prepayments are payments made before statement close.
Source: Federal Reserve Board, Form FR Y-14M, Capital Assessments and Stress Testing.
Importantly, increases in the share of prepayments essentially mean that a higher share of credit card spending is not reflected in credit card balances. Therefore, increases in the share of purchase volume that is prepaid cause credit card balance growth to be understated.
In all, the increase in prepayments has had a significant impact on the growth of credit card balances. As Figure 2 shows, the share of purchase volume that is prepaid increased from around 17 percent prior to the pandemic to around 20 percent by the second half of 2020 and 22 percent by April of 2021. If these increases had not taken place, revolving credit growth would have been much higher. For example, if the share of purchase volume prepaid had remained at 17 percent, credit card balance growth would have been higher by more than 1 percentage point in February 2021 and by almost 2 percentage points in April 2021.13
4. Usage of New Cards
Another driver of the decline in balances is the difference in trends between credit cards originated prior to and during the pandemic. New credit card originations plummeted in the second quarter of 2020, before beginning a slow rebound in the second half of 2020 (Figure 5). This rebound strengthened in the 2nd quarter of 2021, with issuance at or above pre-pandemic levels in all credit score categories by June.
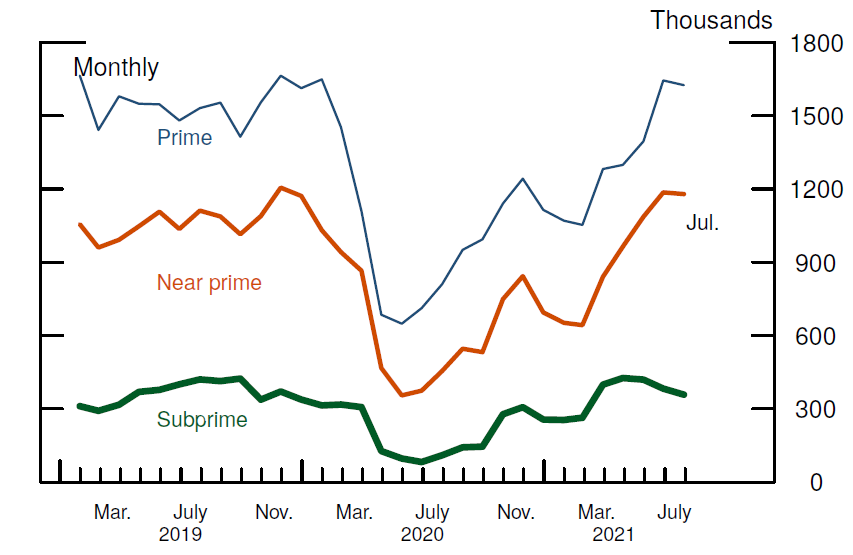
Note: Data for the last month are partially estimated.
Source: Federal Reserve Board, Form FR Y-14M, Capital Assessments and Stress Testing.
In addition to the extensive margin of originations, the intensive margin of how borrowers use new cards also remains depressed.14 Average balance transfer volume and average purchases on new cards remain lower than prior to the pandemic.15 Indeed, as Figure 6 shows, the decline in average balances among new cards, those originated within the past 12 months (blue line), is larger than among existing cards (orange line) since the start of the pandemic. The average balance on a new card declined from $1400 in December 2019 to $950 in April 2021, whereas the average balance on an existing card declined from $1900 in December 2019 to $1600 during the same periods. That is, even as the number of new originations continued to rebound in 2021, the average balances on new cards continued to decline. From May through July of 2021, as average balances began to recover, they grew more for new accounts (5.8 percent) than existing accounts (3.7 percent) but the cumulative net decline since the start of the pandemic remains larger for new accounts.
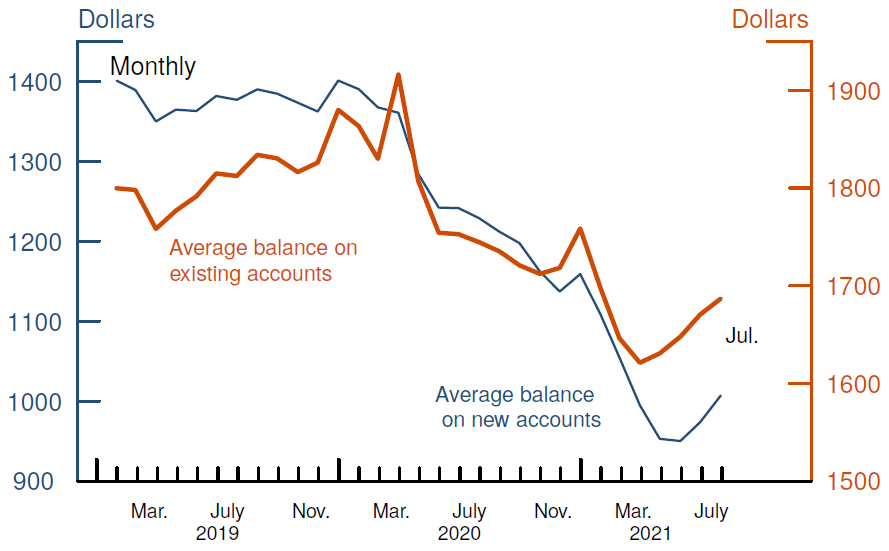
Note: New accounts originated within the previous 12 months.
Source: Federal Reserve Board, Form FR Y-14M, Capital Assessments and Stress Testing.
To estimate the contribution of this larger decline among new accounts, we perform a simple counterfactual estimating what aggregate balances on new accounts would have been if balances on new and on existing accounts had declined at the same rate. We then calculate how much of the total decline in balances can be attributed to the stronger decrease on new accounts. Total credit card balances in our sample declined 13 percent from December 2019 to December 2020 and a further 7 percent in the first four months of 2021. The steeper decline in balances on new cards—due to both differences in originations and usage—can explain approximately 21 percent of the decline in 2020 and 13 percent of the decline through April 2021.
References
Adams, Robert M., and Vitaly M. Bord (2020). "The Effects of the COVID-19 Shutdown on the Consumer Credit Card Market: Revolvers versus Transactors," FEDS Notes. Washington: Board of Governors of the Federal Reserve System, October 21, 2020, https://doi.org/10.17016/2380-7172.2792.
Batty, Michael, Ella Deeken, and Alice Henriques Volz (2021). "Wealth Inequality and COVID-19: Evidence from the Distributional Financial Accounts," FEDS Notes. Washington: Board of Governors of the Federal Reserve System, August 30, 2021, https://doi.org/10.17016/2380-7172.2980.
Frankel, Robin Saks (2021). "How Covid Has Changed Americans' Credit Behavior." Forbes. https://www.forbes.com/advisor/credit-cards/how-covid-has-changed-americans-credit-behavior/
1. The trends in net purchase volume—that is purchase volume net of prepayments—generally mirrored the trends in gross purchase volume in 2020. Return to text
2. This rise in purchase volume coincided with rise in inflation as well as reported supply chain shortages. Return to text
3. Gross purchase volume has rebounded even more strongly than net purchase volume because of the increase in prepayments, as we discuss below. Return to text
4. Paydowns are defined only for accounts with a revolving balance. Accounts that do not revolve pay down the full balance each month. Return to text
5. Income is either reported at origination or requested by the lender at a later date. In either case, income is self-reported. Return to text
6. Coinciding with stimulus payments, starting in April 2020, the Federal Pandemic Unemployment Compensation (PUC) provided increased unemployment benefits for those who lost their jobs, providing up to $600 per week in additional support. Return to text
7. Approximately half of respondents to the Census Bureau's Household Pulse Survey indicated they would mostly use the stimulus to pay down debt. In addition, in unreported results, we show that states in which a higher share of respondents indicated they would use the second stimulus to pay off debt experienced a stronger decline in credit card balances. Return to text
8. It is possible that high paydowns in July is driven by the Child Tax Credit Expansion payments, implemented as part of the American Rescue Plan (ARP) passed by Congress in March 2021. The ARP increased the number of households eligible for child tax credits and increased the amount of each credit. As with the stimulus payments, the credit is phased out for single heads of household making more than $112,500 and joint filers making more than $150,000. Return to text
9. Popular press noted some anecdotes of changing consumer behavior amid a focus on debt repayment during the downturn. See, for example, Frankel (2021), "How Covid Has Changed Americans' Credit Behavior." Return to text
10. Borrowers may purposefully pay off large purchases prior to statement close because large statement balances can negatively affect credit scores. Return to text
11. Often, credit card users pay off their current balance, which is higher than their statement balance. In all, approximately a quarter of accounts who pay at least their statement balance pay more than their statement balance. Accounts with a revolving balance cannot make early payments; any payment is first applied to their revolving balance. Return to text
12. As with increases in payments, it is possible that pandemic-induced changes in consumer behavior also contribute to higher prepayments. For example, prepayment on large purchases may have become more prevalent during the downturn as consumers became more wary of negatively affecting their credit scores. Return to text
13. We calculate this counterfactual growth rates based on counterfactual balances assuming that the prepayment rate had stayed at 17 percent from March 2020 on but allow other changes to balances to go through. On average, purchase volume is approximately 30 percent of balances between June 2020 and February 2021, jumping to 35 and then almost 40 percent as purchase volume recovered beginning in March 2021. Return to text
14. We define new cards as those originated in the prior 12 months. Return to text
15. This likely reflects both supply and demand factors. Average balance transfer volume remains low because lenders cut the number of balance transfer offers during the pandemic. Therefore, the composition of borrowers applying for new cards, even conditional on observables such as credit score, may be different than pre-pandemic. Return to text
Adams, Robert M., Vitaly M. Bord, and Bradley Katcher (2021). "Why Did Credit Card Balances Decline so Much during the COVID-19 Pandemic? ," FEDS Notes. Washington: Board of Governors of the Federal Reserve System, December 03, 2021, https://doi.org/10.17016/2380-7172.3021.
Disclaimer: FEDS Notes are articles in which Board staff offer their own views and present analysis on a range of topics in economics and finance. These articles are shorter and less technically oriented than FEDS Working Papers and IFDP papers.