FEDS Notes
September 28, 2017
Are Rising Home Values Restraining Homebuying for Lower-Income Families?
Neil Bhutta, Steven Laufer, and Daniel R. Ringo1
Since bottoming out in 2012, house prices in the U.S. have been recovering rapidly. According to Zillow, the median home value has been growing about 6 percent per year. While incomes have also been recovering, they have not quite kept pace with home prices. The median household income grew less than 4 percent per year from 2012 through 2015, the most recent year for which we have American Community Survey (ACS) data. In some parts of the country, house prices have been rising much more rapidly than incomes, putting pressure on affordability. This note uses data reported under the Home Mortgage Disclosure Act (HMDA), along with income data from the ACS, and house price data from Zillow, to explore whether families in such areas, particularly lower-income families, are being priced out of homeownership as a result.
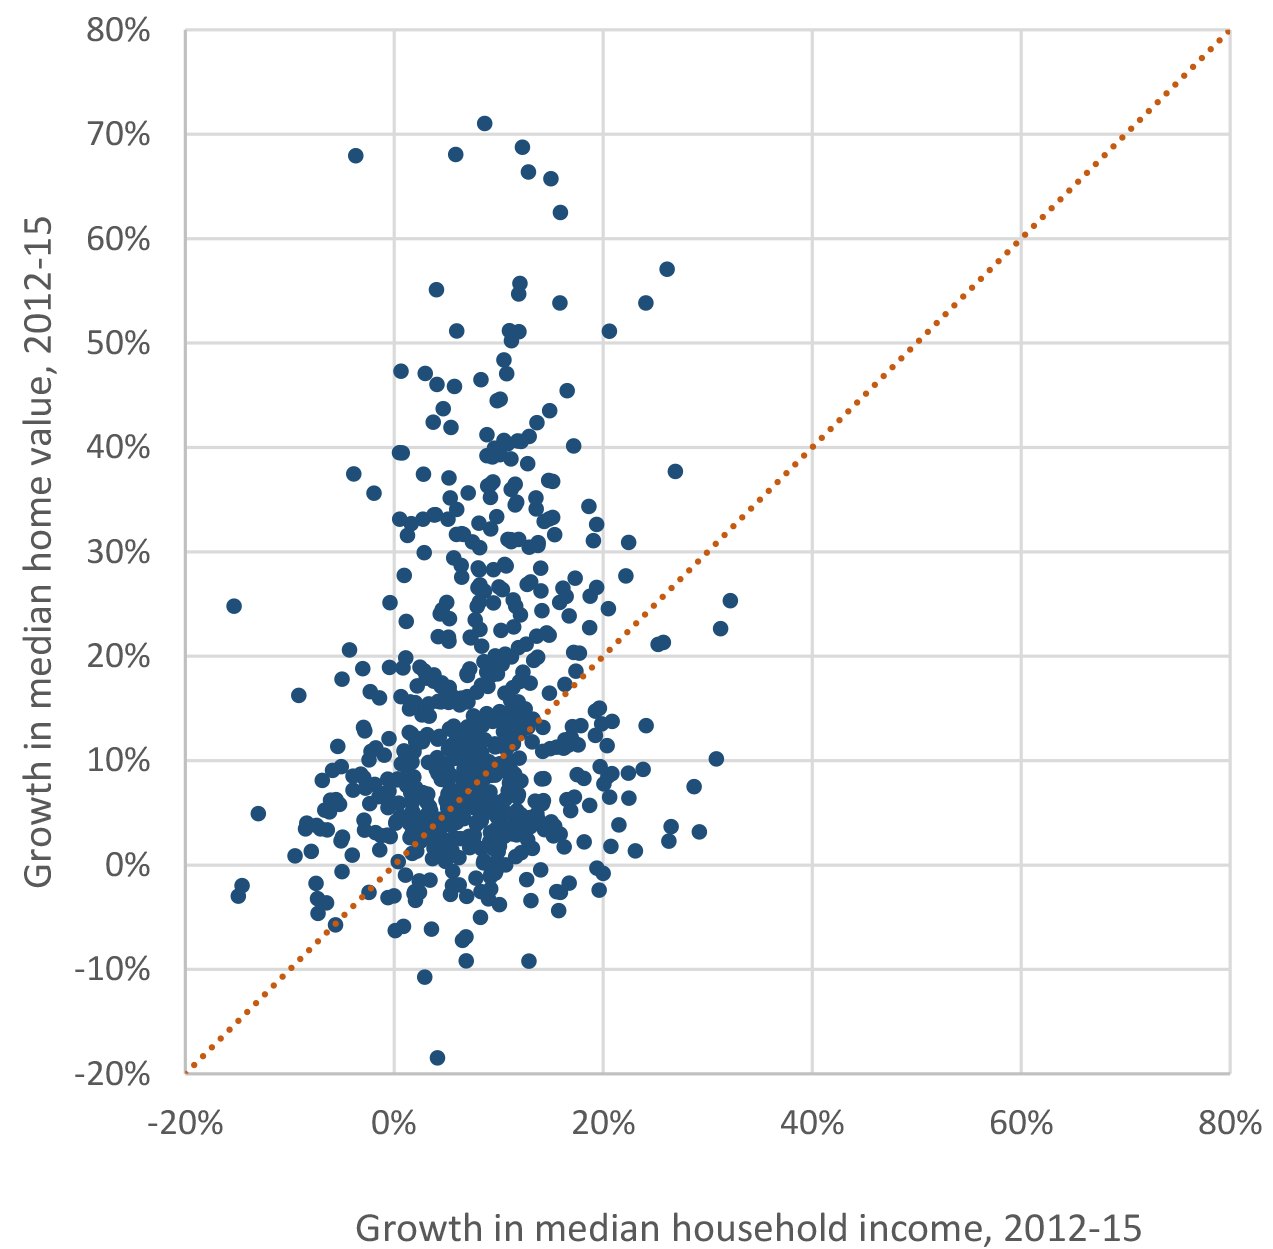
Sources: Zillow, ACS
The dispersion in house price growth across the country can be clearly seen in Figure 1. This figure shows growth from 2012 to 2015 in median home values and in median household income for over 600 of the largest counties.2 These data indicate that many counties have experienced house price growth well in excess of income growth (points above the 45-degree line), with the disparity greater than 20 percentage points in many cases. The counties experiencing the most rapid price growth relative to income are scattered across many different states, although there is a high concentration of such counties in California and Florida, states that were hit hard during the housing bust. While it is difficult to pinpoint what is driving the rapid growth in home values, many analysts have pointed to constraints on housing supply in some areas that make it difficult for new construction to meet demand.3
While rising house prices often benefit existing homeowners, some may find that rising prices make it more difficult to trade up to larger or higher-quality housing. In addition, rising prices can hinder first-time buying. As prices rise, lower-income households in particular may find it increasingly difficult to satisfy required down payment and debt payment-to-income (DTI) ratios. HMDA data illustrate that lower-income households are much more likely to have their mortgage applications denied because of a high DTI ratio or insufficient cash to close (Figure 2).4 HMDA data also show that among those who do obtain loans, lower-income households tend to assume more mortgage debt relative to their incomes than higher-income households, indicating that housing costs consume a greater share of their budgets (Figure 3). As home prices rise relative to incomes, lower-income households may be unwilling or unable to take on the greater amount of debt necessary to buy a given home, and could forgo homebuying altogether.5
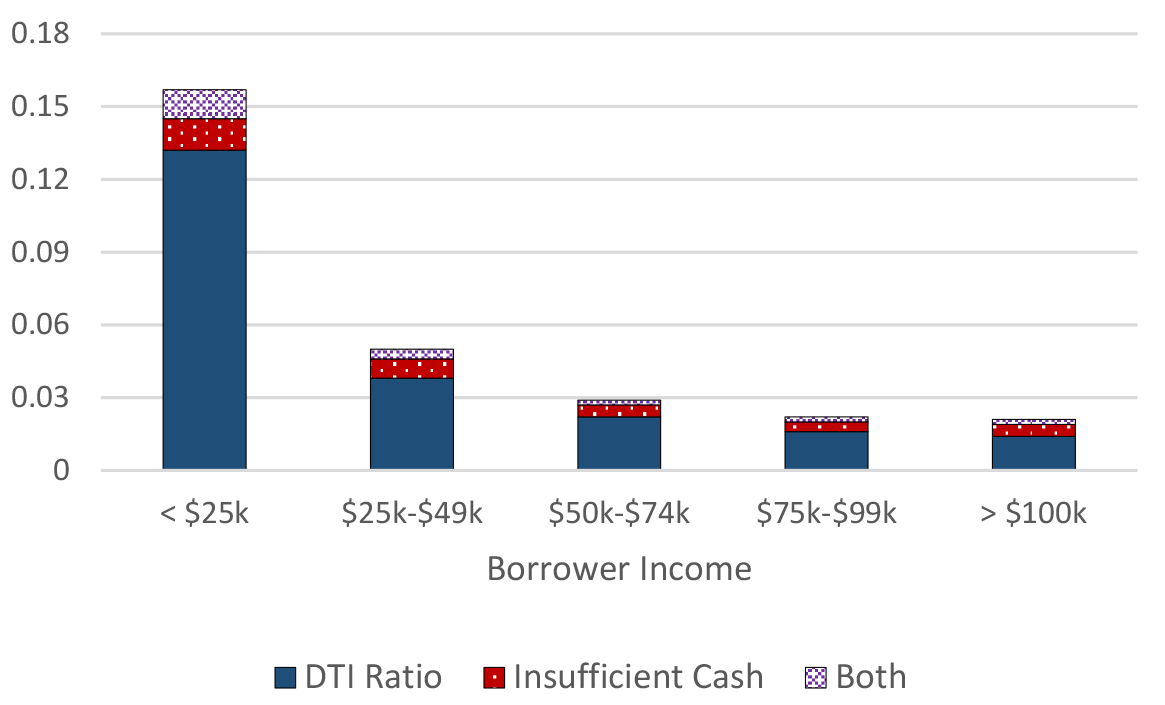
Source: HMDA
Note: Figure displays the fraction of all home purchase loan applications that are denied for the stated reason of the borrower's DTI ratio or insufficient cash. Applications restricted to first liens on owner-occupied, 1-4 family residences for which the lender reached a credit decision in 2016.
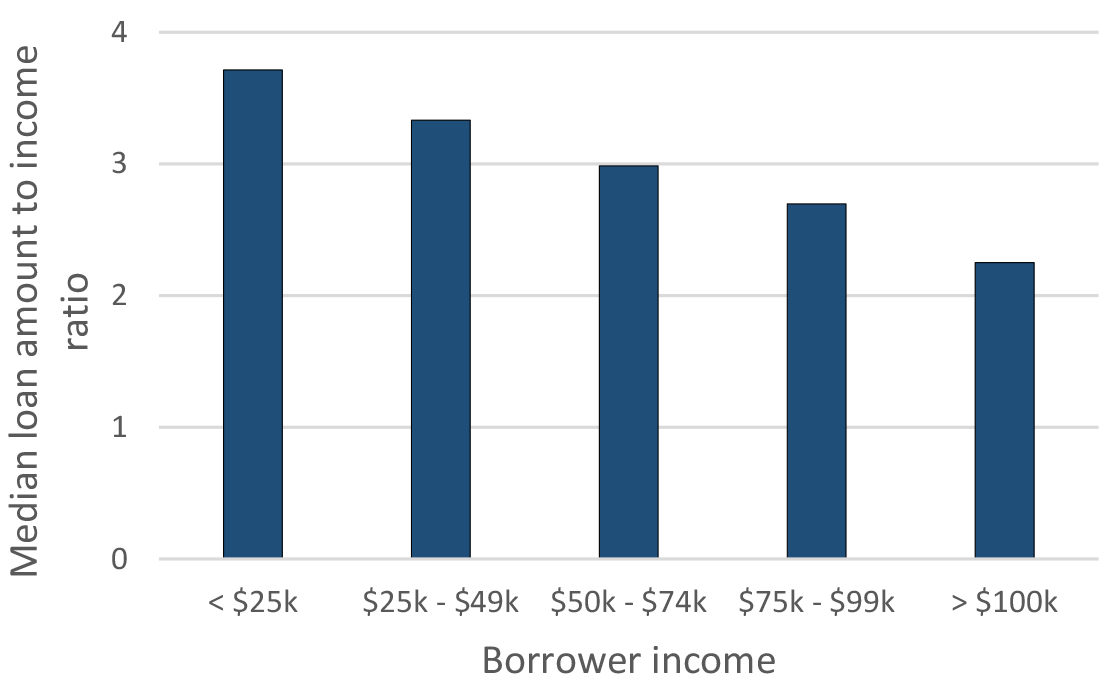
Source: HMDA
Note: First-lien home purchase loans for owner-occupied, 1-4-family residences in 2016.
To assess whether rising prices have restrained homebuying by lower-income families, we compare mortgage borrowing activity across income groups and across areas experiencing different rates of home price appreciation. We draw on annual estimates of the number of families in a county and given income category from the ACS, along with Zillow county-level home value data, and HMDA data. Using these data, in Figure 4 we plot growth rates from 2013 to 2016 in the likelihood of getting a home purchase loan by family income (above and below $50,000), and by county house price growth.
Figure 4: Growth in the likelihood of getting a home purchase loan, by income and county house price growth
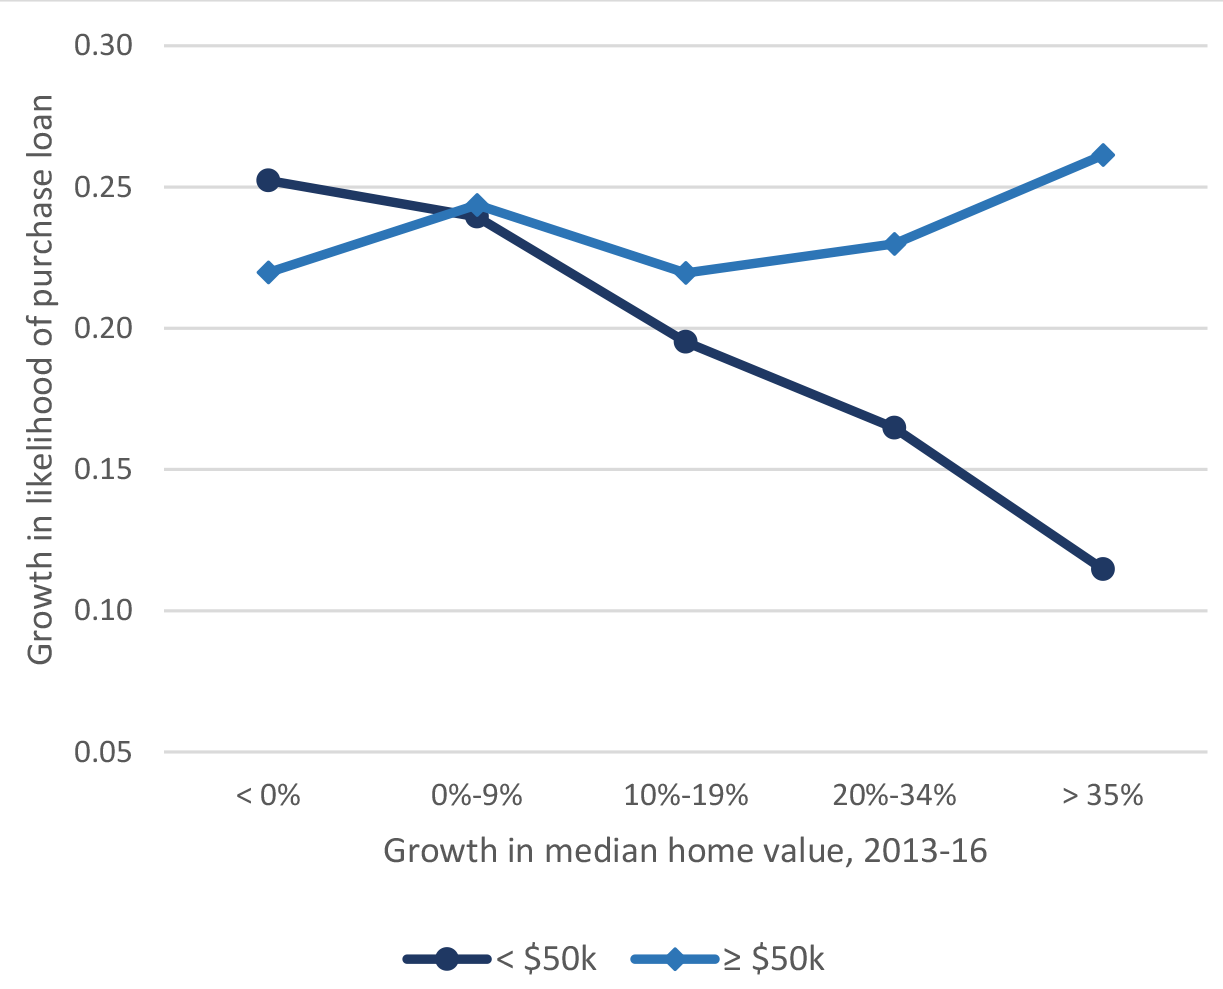
Sources: ACS, Zillow, HMDA
Notes: Each data point represents the change from 2013 to 2016 in the log fraction of families in a given income category and county group that took out a first-lien home purchase loan for a 1-4 family owner-occupied property. Numbers of loans are from the 2013 and 2016 HMDA data; numbers of families are from the 2012 and 2015 ACS.
Figure 4 indicates that the growth in homebuying for lower income families steadily weakened as house prices grew more rapidly, while the growth in homebuying for higher income families was similar regardless of price trends. In counties where house prices grew (cumulatively) by no more than 10 percent, the likelihood of buying increased by about 25 percent for families with incomes below $50,000 – similar to families with income of $50,000 or more.6 However, in counties where house prices grew by 35 percent or more, the likelihood of lower-income families buying a home increased by about 11 percent – weaker than the 26 percent increase for higher-income families. Thus, while the likelihood of buying has been rising in recent years for all income groups, the rise for low-income families has been relatively slow in counties where house prices have been growing more rapidly.
Notably, many of the borrowers with incomes below $50,000 are likely to be first-time homebuyers. While the HMDA data alone do not indicate whether borrowers are buying a home for the first time, previous research using HMDA data matched to mortgage borrowers' credit histories indicates a strong correlation between borrower income and first-time buyer status (Bhutta and Canner 2013).7 Thus, the patterns in Figure 4 suggest that rising home prices may be starting to impede transitions into homeownership. 8
One caveat to this analysis is the possibility of lower-income families moving out of counties with rapid price growth and buying homes elsewhere. Such migration could help lower-income families find more affordable homes to buy. Nonetheless, the data suggest that rising house prices in some markets have restrained homebuying by lower-income families in those markets.
Works Cited
Bhutta, Neil and Glenn B. Canner (2013). "Mortgage Market Conditions and Borrower Outcomes: Evidence from the 2012 HMDA Data and Matched HMDA-Credit Record Data." Federal Reserve Bulletin, vol. 99.
Bhutta, Neil, Daniel Ringo and Steven Laufer (forthcoming). "Residential Mortgage Lending in 2016: Evidence from the Home Mortgage Disclosure Act Data," Federal Reserve Bulletin.
Glaeser, Edward L., and Joseph Gyourko (forthcoming). "The Economic Implications of Housing Supply." Journal of Economic Perspectives.
Gyourko, Joseph, and Raven Molloy (2014). "Regulation and Housing Supply." National Bureau of Economic Research working paper no. 20536.
Henderson, J. Vernon, and Yannis M. Ioannides (1983). "A Model of Housing Tenure Choice." The American Economic Review 73.1: 98-113.
Hsieh, Chang-Tai, and Enrico Moretti (2015). "Why Do Cities Matter? Local Growth and Aggregate Growth. National Bureau of Economic Research working paper no. w21154.
McLaughlin, Ralph (2017). "Who Will Win the Homebuilding Race of 2017?" Trulia's Blog. https://www.trulia.com/blog/trends/homebuilding/
National Association of Home Builders (2016). "Housing Market Index: Special Questions on Labor and Subcontractors' Availability" http://eyeonhousing.org/wp-content/uploads/2016/06/June2016SplQ-REPORT-EXTERNAL-FINAL.pdf
Sinai, Todd, and Nicholas S. Souleles (2005). "Owner-Occupied Housing as a Hedge Against Rent Risk." The Quarterly Journal of Economics 120.2: 763-789.
Sodini, Paolo, Stijn Van Nieuwerburgh, Roine Vestman, and Ulf von Lilienfeld-Toal (2016). "Identifying the Benefits from Home Ownership: A Swedish Experiment." National Bureau of Economic Research working paper no. 22882.
1. Board of Governors of the Federal Reserve System. The views expressed in this note are solely those of the authors and not necessarily those of the Federal Reserve Board or others within the Federal Reserve System. Return to text
2. The set of counties shown in Figure 1 are those with house value data from Zillow in 2012 and 2015, and median household income data from the 2012 ACS and 2015 ACS. Return to text
3. McLaughlin (2017) describes the significant variation across the country in construction activity. Research has pointed to stringent local building regulations as an important impediment to the construction of housing in many cities (e.g. Glaeser and Gyourko 2017; Molloy and Gyourko 2014). Another factor that might be limiting construction activity is the tight labor market for skilled construction workers (NAHB 2016). Return to text
4. For more on the HMDA data, see Bhutta, Laufer, and Ringo (forthcoming). Return to text
5. The possibility that rising prices are limiting homeownership opportunities raises concerns because of the benefits that homeownership may provide. For example, owning helps insulate families from unexpected jumps in rental prices (Sinai and Souleles 2005). Additionally, owning may help families save more than they otherwise would as they repay their mortgage (Sodini et al. 2016). Furthermore, owning may be less expensive than renting equivalent quality housing as landlords must charge more to account for the fact that renters have less incentive to maintain properties as well as owner occupiers do (Henderson and Ioannides 1983). For many families, these benefits may outweigh the risks associated with home ownership. Return to text
6. In 2013, the likelihood of getting a home purchase loan ranged from 1.1 percent to 1.3 percent for lower-income families, and from 2.9 percent to 3.6 percent for higher-income families, across these five groups of counties. Return to text
7. Bhutta and Canner (2013) find that in 2010 about 70 percent of lower-income borrowers (defined as those with incomes of less than 80 percent of the median family income for the metropolitan area) were first-time mortgage borrowers. Return to text
8. In addition to impeding homeownership opportunities, cities with high housing costs may discourage migration into them from other cities. Hsieh and Moretti (2017) argue that high housing costs in the most productive cities have restricted aggregate productivity growth. Return to text
Bhutta, Neil, Steven Laufer, and Daniel R. Ringo (2017). "Are Rising Home Values Restraining Homebuying for Lower-Income Families?," FEDS Notes. Washington: Board of Governors of the Federal Reserve System, September 28, 2017, https://doi.org/10.17016/2380-7172.2078.
Disclaimer: FEDS Notes are articles in which Board staff offer their own views and present analysis on a range of topics in economics and finance. These articles are shorter and less technically oriented than FEDS Working Papers and IFDP papers.