


FEDS Notes
September 28, 2026
Beyond Face Value: How Composition Changes Affect Import Unit Values of Light Vehicles
Robin Braun and Maria D. Tito1
Light vehicles (NAICS 33611) account for approximately 7 percent of U.S. merchandise goods imports, making it an economically significant trade category. Because motor vehicles also receive a sizable weight in the Bureau of Labor Statistics (BLS) Import Price Index, changes in vehicle prices can materially influence overall import price inflation, making this sector particularly important for understanding broader trade price dynamics. This importance has come into focus since the introduction of tariffs on finished vehicle imports on April 3, 2025, after which unit values for light vehicles have declined sharply, posting drops of 10 percent or more from major trading partners including Japan, South Korea, Mexico, Canada, and the European Union (figure 1, left panel).2 BLS import price indexes for vehicles have also moved lower during this period, though generally by smaller magnitudes than the corresponding unit value declines (right panel). These concurrent movements suggest that the automotive sector is experiencing substantial adjustment in response to tariff pressures, potentially reflecting a combination of partial pass-through at the border, strategic transfer pricing by multinational manufacturers, and shifts in the composition of models being imported. However, disentangling the relative contributions of genuine price changes versus compositional shifts remains challenging when relying solely on aggregate unit values and published price indexes. This note leverages detailed model-level data from Wards Automotive to construct composition-adjusted price measures that isolate genuine price changes from shifts in product mix.
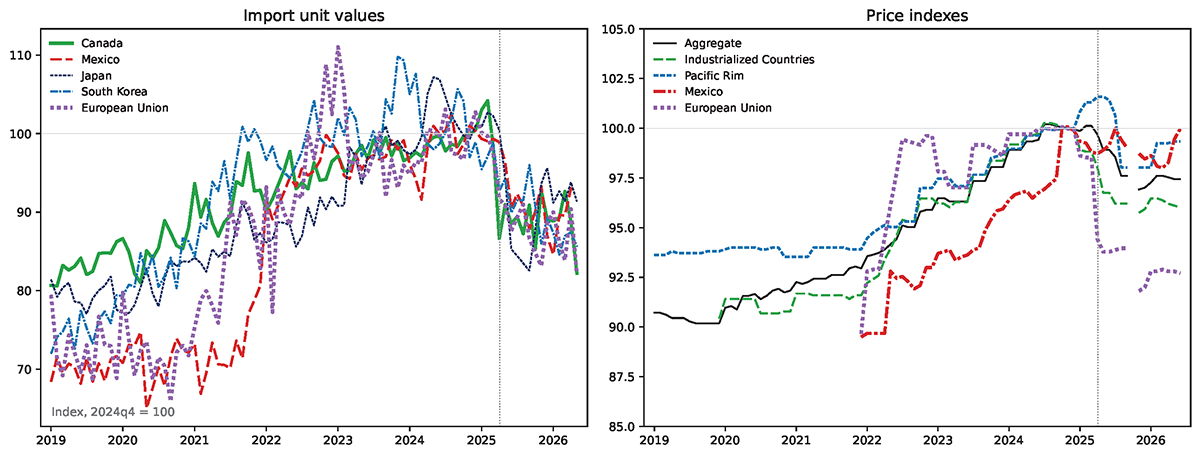
Notes: Import unit values (left panel) and price indexes (right panel) are normalized to 100 in 2024q4. Data through May 2026.
Source: U.S. Census Bureau (left panel) and Bureau of Labor Statistics (BLS) via Haver (right panel).
Import unit values
Import unit values—calculated as the ratio of import values to units—have become a standard measure of prices in international trade research. Their widespread use largely reflects data constraints: while detailed firm-level transaction prices would be ideal for studying phenomena like exchange rate or tariff pass-through, such measures remain unavailable for most products, countries, and time periods. Yet this reliance comes with well-known drawbacks: The literature cautions that analyses based on unit values are problematic, as these measures reflect not only actual price changes but also shifts in the underlying product mix.3 For example, when higher-quality or more expensive varieties gain import share, unit values would mechanically rise even if firms kept prices unchanged. Attributing such movements to exchange rate or tariff shocks could therefore misrepresent the true degree of price stickiness or pass-through.4
BLS recognizes these limitations. After extensive research, BLS announced it will begin using administrative trade data to calculate unit-value based import price indexes for approximately 40 percent of merchandise goods starting in 2025 (Smith et al. 2024). However, BLS explicitly excludes automotive vehicles from this new approach, noting that this sector is particularly subject to quality changes and substantial compositional shifts that would introduce unit value bias. This exclusion is why composition-adjusted analysis matters for light vehicles, precisely the approach taken in this note.
We use Wards' data, which provide model-level information on U.S. new vehicle sales, inventories, and manufacturers' suggested retail prices (MSRPs) by country of origin, to construct price measures that hold the product mix constant and, thus, isolate the role of shifting product composition. Our analysis focuses on the recent period, when tariff shocks may have amplified compositional shifts, though the same methodology could be applied more broadly.
A key question is whether model-level data from Wards can reliably proxy official import statistics. Figure 2 demonstrates that our estimated flow of imported vehicles (dashed blue line)—constructed as the sum of domestic sales and net inventory accumulation from Wards data—closely tracks Census unit imports (solid black line), with only relatively small discrepancies between the two series (a monthly correlation of 0.88 over 2020–2026). This close correspondence also holds at the country level. Restricting each series to a single origin, the monthly correlation between the Wards-implied import flow and Census unit imports over 2020–2026 is 0.92 for Canada, 0.90 for Mexico, 0.82 for South Korea, and 0.81 for Japan.
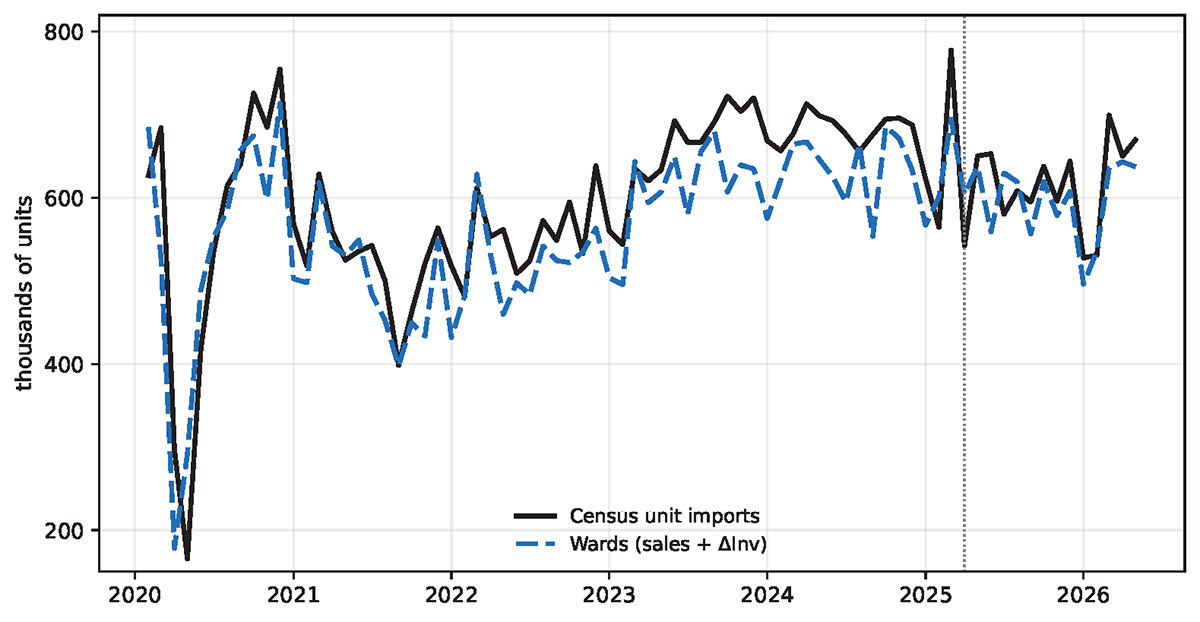
Notes: U.S. unit imports of light vehicles. HS codes for chassis and bodies are excluded from the Census units. Wards' estimates are constructed as monthly sales of imported vehicles plus the change in end-of-month inventory levels (sales + ΔInv). Data through May 2026 for Census and June 2026 for Wards.
Source: U.S. Census Bureau and Informa, Wards Data Intelligence Query, https://wardsintelligence.informa.com/data-query-tool.
Average Prices
Having established that Wards captures aggregate import flows, we now assess the role of composition in two steps. First, we construct a Wards-based measure that approximates Census unit values but with more precise accounting for quality differences across models. Second, we construct a composition-adjusted version of this measure by holding the import basket fixed at its 2024:Q4 mix. The difference between these two measures isolates pure compositional effects.
In the first step, we calculate the average price of the import bundle using model-level MSRPs. This Wards-based average price measure allows both the composition of imports and the quality of those models to change over time, accounting for the life cycle of vehicle models through JD Power transaction-level data. As manufacturers introduce new model years with updated features, technology, and design, these quality improvements are reflected in higher MSRPs. For example, when a model transitions from its 2024 model year to its 2025 model year, our measure incorporates the corresponding MSRP change. For any given model year, we hold the MSRP constant throughout its sales life, essentially abstracting from retail-level variation in transaction prices—such as dealer discounts and incentives—consistent with the fact that Census' unit values reflect border prices rather than final consumer prices. However, MSRPs may not coincide with border prices: Indeed, border prices generally incorporate manufacturer costs, profit margins, and logistics up to the point of entry, but exclude the retail distribution margin that would affect MSPRs. Moreover, manufacturers may adjust border prices independently of MSRP changes in response to exchange rate movements, input cost shocks, or tax optimization strategies. Even with these conceptual differences, the variable-composition average prices tend to be fairly closely correlated with the Census unit value measures. Figure 3 illustrates this relationship for four major sources of U.S. vehicle imports: Japan and South Korea (top panels) and Mexico and Canada (bottom panels). Through the pre-tariff period, the two measures track each other closely in all four cases. Following the introduction of tariffs in early April 2025, a sharp divergence emerges: Census unit values decline while average prices hold near or above their 2024 Q4 level. By May 2026, the gap reaches a little more than 10 index points for Japan, South Korea, and Mexico, while it is widest for Canada at almost 25 points, where unit values fall to around 80 even as average prices rise to about 105 (2024:Q4 = 100).This divergence could reflect several factors: manufacturers may be absorbing part of the tariff through lower border prices (partial pass-through), they may be engaging in strategic transfer pricing to shift profits across jurisdictions, or the relationship between MSRPs and border prices may be changing systematically—for instance, if manufacturers are compressing retail margins or adjusting their pricing strategies in response to the new tariff environment.
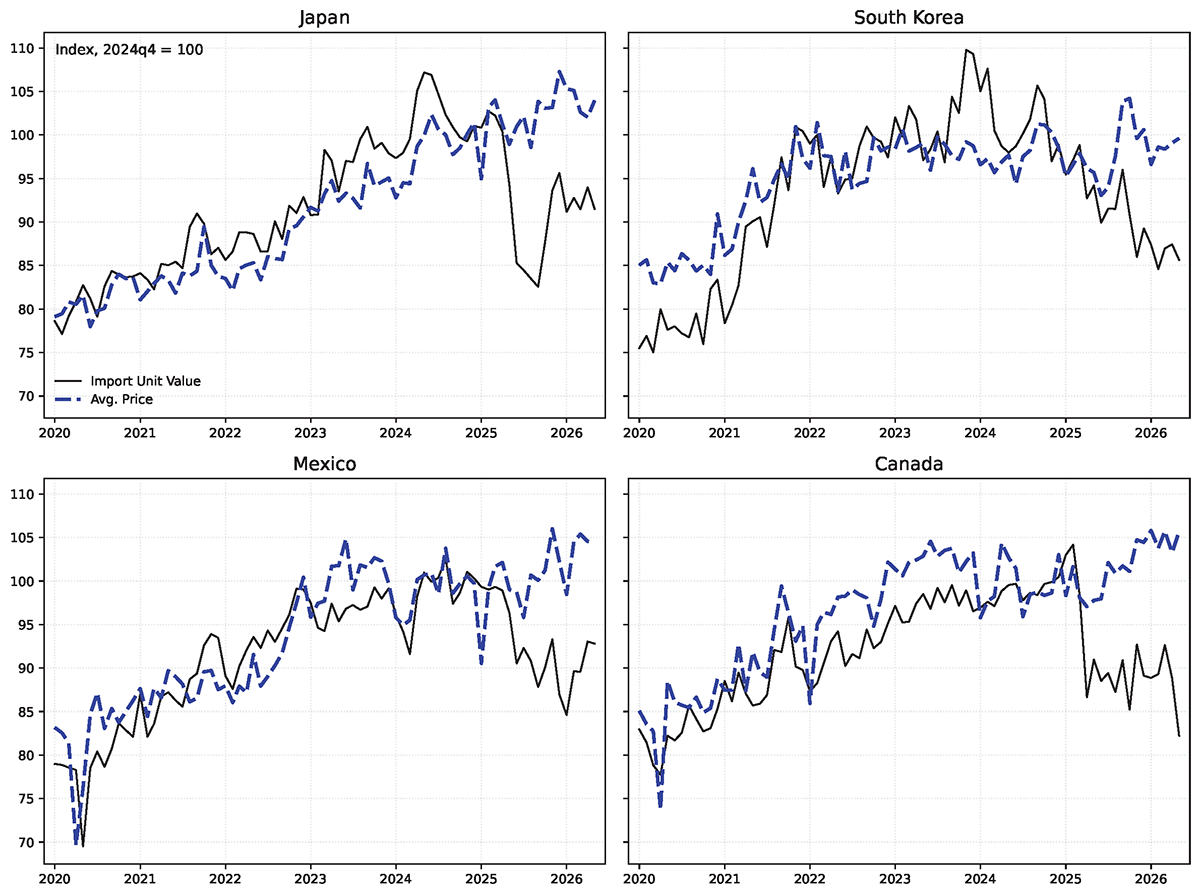
Notes: Unit values and average prices indexed to 100 in 2024q4. Data through May 2026.
Source: U.S. Census Bureau; Informa, Wards Data Intelligence Query, https://wardsintelligence.informa.com/data-query-tool; and J.D. Power and Associates, Incentive Spending Report (ISR), http://www.jdpower.com/solutions/power-information-network-pin.
In the second step, we construct a counterfactual price measure that isolates compositional effects by fixing the composition of the import basket at the 2024:Q4 mix but continue to account for the variation in prices through model-year updates. The difference between the variable-composition measure and this fixed-composition measure then isolates the pure compositional effect: how much the average import prices changed solely due to shifts in which models were imported and in what quantities, holding constant the quality evolution of each model.
Figure 4 presents this analysis for Japan (left panel) and South Korea (right panel). The two countries exhibit markedly different compositional dynamics following the introduction of tariffs. For Japan, the variable-composition average price has moved consistently above the fixed-composition counterfactual since the end of last year, indicating a moderate shift in the import mix toward higher-priced models. In contrast, South Korea shows the opposite pattern: variable-composition prices fall below the fixed-composition measure, even as they do not decline quite as dramatically as unit values. The gap between variable- and fixed-composition measures averages around 4 percent since April against a decline in unit values of about 15 percent.5
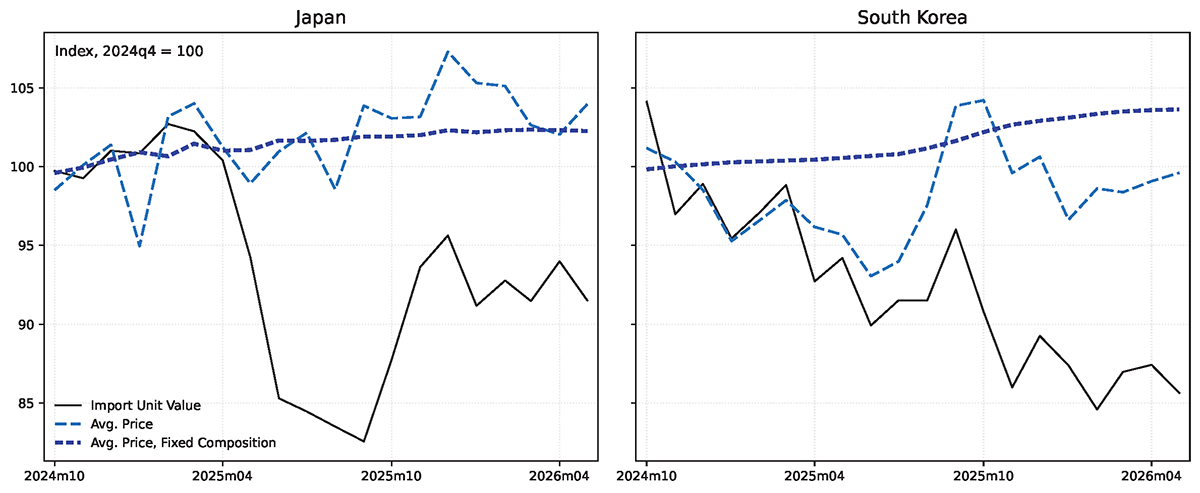
Notes: Unit values and average prices indexed to 100 in 2024q4. Data through May 2026.
Source: U.S. Census Bureau; Informa, Wards Data Intelligence Query, https://wardsintelligence.informa.com/data-query-tool; and J.D. Power and Associates, Incentive Spending Report (ISR), http://www.jdpower.com/solutions/power-information-network-pin.
In all, compositional shifts can substantially affect import unit value movements, with the magnitude and direction varying markedly across countries. Our findings point to a well-known caution for researchers and policymakers: interpreting unit value movements as reflecting price adjustments—whether in response to exchange rate fluctuations, tariff changes, or other shocks—can lead to inaccurate conclusions about pass-through rates and price stickiness. While detailed transaction-level data are ideal, our decomposition approach offers a practical method for assessing when and to what extent composition effects contaminate unit value measures, providing more reliable guidance for policy analysis in a sector where product heterogeneity is substantial.
References
Amiti, Mary, and Amit K. Khandelwal (2013). "Import Competition and Quality Upgrading." Review of Economics and Statistics, 95 (2), pp. 476-490.
Amiti, Mary, Stephen J. Redding, and David E. Weinstein. (2020) "Who's Paying for the US Tariffs? A Longer-Term Perspective." AEA Papers and Proceedings, 110, pp. 541-546.
Aw, Bee Yan, and Mark J. Roberts (1986). "Measuring Quality Change in Quota-Constrained Import Markets: The case of U.S. Footwear." Journal of International Economics, 21 (1-2), pp. 45-60
Cavallo, Alberto, Gita Gopinath, Brent Neiman, and Jenny Tang (2021). "Tariff Pass-Through at the Border and at the Store: Evidence from U.S. Trade Policy." American Economic Review: Insights, 3 (1), pp. 19-34.
Fajgelbaum, Pablo D., Pinelopi K. Goldberg, Patrick J. Kennedy, and Amit K. Khandelwal. (2020). "The Return to Protectionism." The Quarterly Journal of Economics, 135 (1), pp. 1-55.
Irwin, Douglas A. (2010). "Trade Restrictiveness and Deadweight Losses from U.S. Tariffs." American Economic Journal: Economic Policy, 2 (3), pp. 111-133.
Searle, Allen D. (1970). "Considerations on the Choice of Prices or Unit Values as Deflators for the Census Benchmark Production Indexes." Report of the Subcommittee on Prices, Interagency Committee on Measurement of Real Output.
Smith, Dominic, Austin Enderson-Ohrt, Matthew Fisher, Christopher Grant, Angel Wong, and Benjamin Wullbrandt. 2024. "Enhancing Import and Export Price Indexes: A New Methodology Using Administrative Trade Data." BLS Working Paper 578. U.S. Bureau of Labor Statistics.
1. The views expressed in the article are those of the author and do not necessarily reflect those of the Federal Reserve Board, the Federal Reserve System, or its staff. Return to text
2. A presidential proclamation announced a 25 percent tariff on imported automobiles and certain automobile parts on March 26, 2025. The tariffs took effect on April 3, 2025, for imported passenger vehicles and light trucks and on May 3, 2025, for specified automobile parts. Return to text
3. The literature has long recognized the drawbacks of relying on unit-value data, dating back to the Searle (1970) report. More recently, several contributions have turned to transaction-level data or to the BLS import price survey as alternatives. Notably, Cavallo et al. (2021) show that survey-based import price indexes yield results on tariff pass-through that are broadly consistent with those obtained using Census unit values in Amiti et al. (2020) and Fajgelbaum et al. (2020). However, these similarities may reflect the specific policy change, period, or products examined in those studies and should not necessarily be taken as evidence that unit values and survey-based indexes always move in tandem. Return to text
4. For example, an increase in ad-valorem tariffs generally encourages substitution toward lower-quality, cheaper varieties, lowering average import unit values (Amiti and Khandelwal, 2013). By contrast, specific duties, quota constraints, or strategic supplier decisions can sometimes shift imports toward higher-quality or higher-value products, raising average unit values (Aw and Roberts, 1986; Irwin, 2010). Return to text
5. The South Korean composition effect reflects a transition from higher-priced electric vehicles toward lower-priced internal-combustion models. Wards data suggests that the electric share of imports fell from 8.9 to 0.8 percent between 2024:Q4 and 2026:Q1, with the largest declines in models such as the Hyundai Ioniq 5 and Kia EV6 offsetting gains in cheaper cars such as the Hyundai Elantra. Besides Tariffs, part of it likely reflects U.S. regulatory changes (expiration of the federal EV tax credit) and Hyundai's early-2025 ramp-up of EV and hybrid production at its Metaplant in Georgia, which moves those models from imports to domestic output. Return to text
Braun, Robin, and Maria D. Tito (2026). "Beyond Face Value: How Composition Changes Affect Import Unit Values of Light Vehicles," FEDS Notes. Washington: Board of Governors of the Federal Reserve System, September 28, 2026, https://doi.org/10.17016/2380-7172.4174.
Disclaimer: FEDS Notes are articles in which Board staff offer their own views and present analysis on a range of topics in economics and finance. These articles are shorter and less technically oriented than FEDS Working Papers and IFDP papers.