


FEDS Notes
May 29, 2026
China shock 2.0: How China’s ongoing export surge differs from the early 2000s
François de Soyres, Ece Fisgin, Ana Maria Santacreu, Eva Van Leemput and Kevin Vega1
China's accession to the World Trade Organization in 2001 marked the beginning of one of the most consequential episodes in the history of global trade. The subsequent surge in Chinese exports–often referred to as the "China Shock"–has been widely associated with large adjustments in production patterns, labor markets, and trade balances across the global economy (Autor et al. 2016; Pierce and Schott 2016).
Over the past several years, global trade has entered a new phase of rapid Chinese export expansion, often referred to as "China Shock 2.0". Since around 2018, China's share of global exports has risen markedly, supported by an increase of more technologically advanced manufacturing exports, anchored in its flagship Made in China 2025 industrial policy plan.2
However, a defining feature of China's expanding export footprint is its parallel push for greater self-reliance through industrial policy amid rising geopolitical tensions. As documented in de Soyres and Moore (2024), China has, since 2018, placed renewed emphasis on technological self-sufficiency and supply chain resilience.3 This strategy was later formalized in China's "dual circulation" plan in 2020, which prioritizes strengthening domestic capabilities ("Made in China for China") while continuing to expand China's export presence.
This note argues that "China Shock 2.0" reflects not only a policy-driven export push but also a strategic reorientation toward greater domestic capacity and self-reliance. As a result, the current episode is best understood as an asymmetric trade shock, or trade-surplus-driven shock, in which exports expand rapidly while import demand grows much more slowly. While China also experienced a substantial increase in trade surpluses during the early 2000s, that episode occurred when China represented a much smaller share of the global economy and when export growth was more tightly linked to imports through global value chains and processing trade. By contrast, today's export expansion relies more heavily on domestic supply chains, while imports are increasingly concentrated in commodities and upstream inputs, weakening the direct link between import growth and export growth.
Two features further amplify the global effects of this surplus. First, current China's export expansion is occurring from an already elevated base, with China now accounting for about 18 percent of the world economy. At current levels, its net export flows represent a historically large share of the rest of the world's income, so that a given proportional increase in the trade surplus translates into a larger adjustment in production across trading partners than in earlier periods. Second, the country's export growth is increasingly concentrated in capital- and technology-intensive sectors, many of which overlap with industries traditionally dominated by advanced economies, thereby intensifying direct competitive pressures.
Taken together, these elements suggest that "China Shock 2.0" is not simply a continuation of earlier trends, but a new phase of global trade integration. It is characterized by a large-scale reallocation of production, amplified by China's economic size and changing trade patterns, with potentially broader implications for global production, policy responses, and geopolitical dynamics than those observed during the first China Shock. In the analysis that follows, we refer to the period 2000–2007 as "China Shock 1.0" and the period since 2018 as "China Shock 2.0".
1. An Unprecedented Trade Surplus Relative to the Global Economy
China's trade surplus surged to a record $1.2 trillion in 2025, marking a new milestone in its integration into, and dominance of, the global trading system (de Soyres et al., 2026). To put this in perspective, the left panel of Figure 1 plots China's exports and imports as a share of global GDP excluding China.
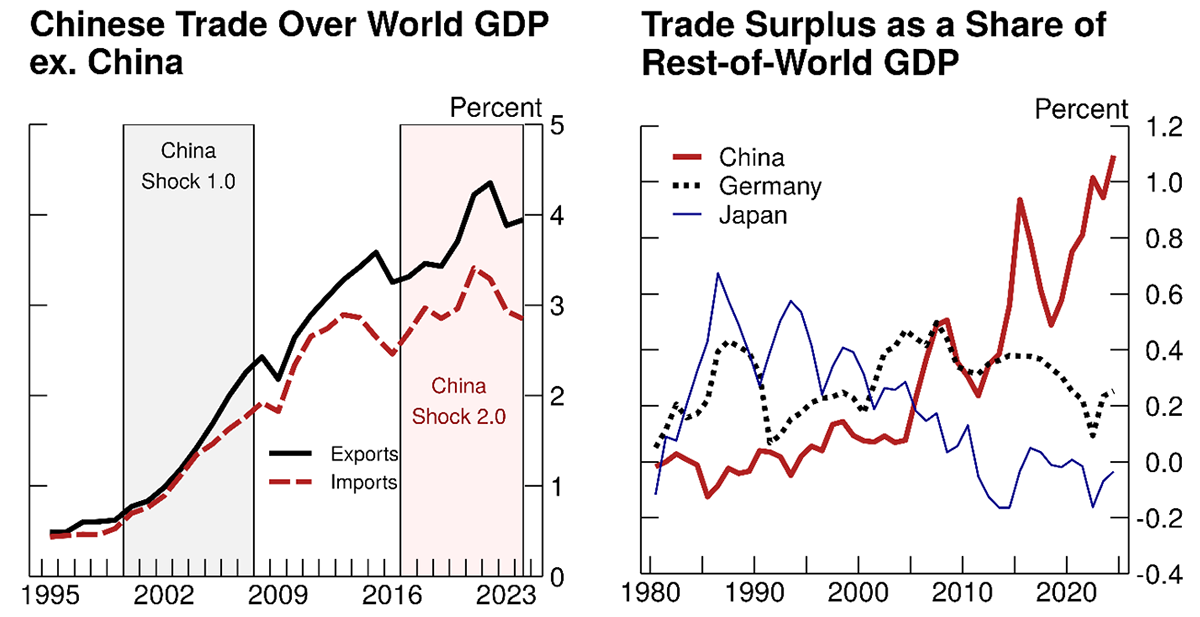
Figure 1a:
Note: China's export and import share is measured as a percentage of global GDP excluding China.
Source: Haver Analytics; Author's Calculations.
Figure 1b:
Note: Trade surplus includes primary and manufactured goods and is measured as a share of rest-of-world GDP.
Source: Haver Analytics; Author's Calculations.
The chart highlights an important feature of China's development: as China grows faster than the rest of the world and accounts for an increasing share of global output, continued export growth translates into a rising share of the rest of the world's income. This dynamic is reflected in its rising trade surplus—the gap between exports and imports captures—which must ultimately be absorbed by its trading partners.
Under the first China shock, China's trade surplus rose from less than 0.1 percent of rest-of-world GDP in 2000 to 0.5 percent in 2007 and remained around that level through the 2010s, albeit with some volatility. Since 2018, however, China's trade surplus has increased sharply to over 1 percent of rest-of-world GDP, thereby reaching historically high levels relative to the size of its trading partners.
To underscore the significance of China's trade surplus, we compare it to trade surpluses of past export powerhouses such as Germany and Japan as a share of rest-of-world GDP.4 The right panel of Figure 1 shows that, even at their peaks, these economies' surpluses were substantially smaller relative to the global economy than China's current surplus, reflecting the exceptional scale of China's manufacturing sector and its deep integration into global supply chains.
This scale matters because the rest of the world must absorb a growing volume of Chinese net exports. Such large global imbalances can strain trading partners' manufacturing sectors, shift global production patterns, and increase pressures for policy responses.
As discussed in de Soyres et al. (2026), this expansion has been supported by industrial policies that enhance manufacturing competitiveness, aimed at boosting exports globally while simultaneously increasing domestic self-reliance, thereby constraining import demand. Unlike the first China Shock, these net export flows now represent a larger share of the global economy, reinforcing China's central role in global supply chains and amplifying their impact on trading partners.
2. China's Export Expansion from an Already Dominant Position
A useful way to characterize China's rise in global trade is to compare exports and imports growth during the two episodes highlighted above: China Shock 1.0 (2000–2007) and China Shock 2.0 (since 2018).
The left panel of Figure 2 shows that China's share of global goods exports rose sharply following its accession to the WTO, increasing from below 4 percent in 2000 to about 9 percent in 2007—an average gain of roughly 0.7 percentage point per year. Over the same period, import shares also increased, but more slowly, contributing to a rising trade surplus.
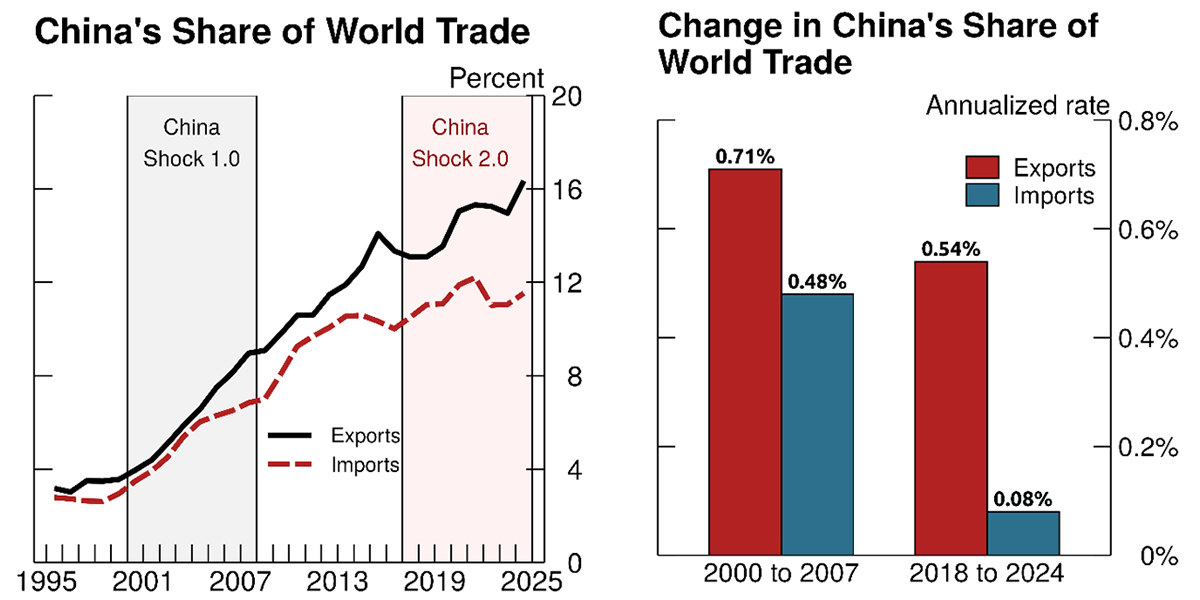
Figure 2a:
Note: China's export and import share is measured as a percentage of global exports and global imports.
Source: UN Comtrade; Author's Calculations.
Figure 2b:
Note: Changes in China's world trade share are measured by calculating the difference between China's global share of exports and global share of imports across three periods: 2000-2007 and 2018-2024. Key series identifies series in order from left to right.
Source: UN Comtrade; Author's Calculations.
Since 2018, export and import dynamics have diverged again. China's share of global exports increased from 13.1 percent in 2018 to 16.3 percent in 2024, while its import share rose only modestly. This widening gap between export and import shares is consistent with a rising trade surplus, and points to a renewed emphasis on export-led growth alongside reduced reliance on imported inputs.
Although the recent increase in China's export share is smaller than in the early 2000s in percentage-point terms, it starts from a much higher level. China is therefore consolidating an already dominant position in global trade, so even modest gains in market share can have sizable effects on global production patterns.
This contrast is central to the distinction between the two episodes. The earlier period (2000–2007) reflected rapid integration into global trade from a low base, whereas the current phase (since 2018) represents further expansion by the world's largest exporter, with broader and more pervasive implications for global trade.
3. Geographical extension of Chinese trade penetration
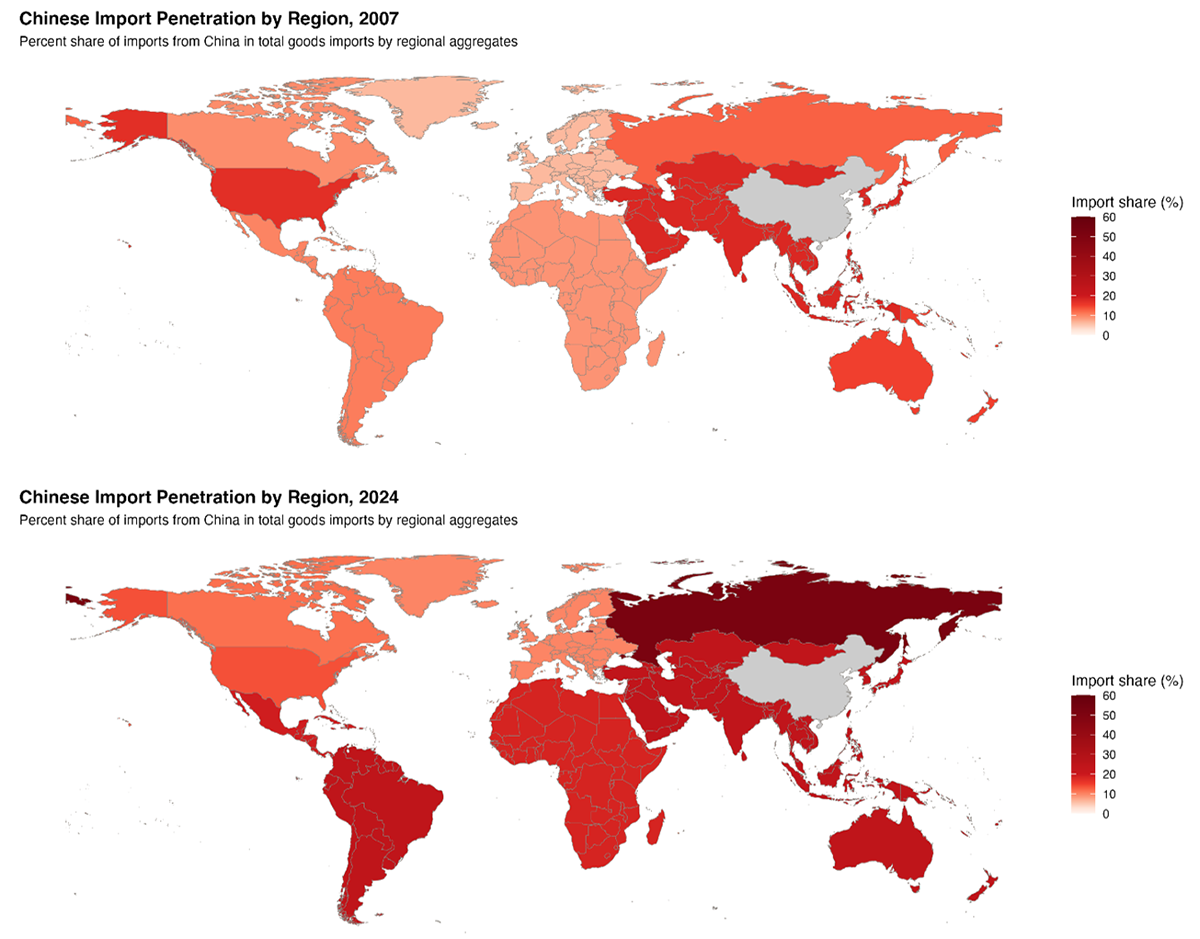
The expansion of China's export footprint is not only large in aggregate terms but also geographically widespread. Figure 3 illustrates the share of imports sourced from China in 2007 and 2024.5 The comparison reveals both a substantial rise in import penetration and a marked broadening across nearly all parts of the global economy.
Note: The United States, Canada and Russia are shown individually, while other countries are grouped into regions, and we colored all countries of a given region with the same color based on aggregate changes. Our aggregate regions are: (i) Mexico and Central America, (ii) South America, (iii) Africa, (iv) Europe and Middle-East, (v) Asia (except Russia), and (vi) Oceania.
Source: UN Comtrade, IMF IMTS, Authors’ calculations.
In 2007, Chinese import penetration was already meaningful in a subset of economies, particularly in East Asia, Russia, and the United States. Across Europe, as well as in Latin America and Africa, exposure remained relatively modest.
By 2024, China's share in total imports has risen sharply across virtually all regions, with especially large increases in Africa, South America, Russia, and much of developing Asia. In many of these regions, imports from China now account for 20 to 40 percent or more of total imports, pointing to a much deeper integration into China-centered trade flows. Most advanced economies have also seen increases, though at a slightly more gradual pace.
The United States stands out as a clear exception to this global pattern. Its import share from China has declined since 2007, indicating a partial retrenchment even as China's presence expanded elsewhere.6
Overall, the maps point to a shift in the structure of global trade in which China has become a central supplier across a wide range of regions, rather than a partner concentrated in specific markets. This broad exposure suggests that developments affecting China's export sector are likely to have far-reaching implications, reinforcing concerns about supply chain dependencies and the global transmission of trade shocks.
4. Increasing Overlap with Advanced Economy Export Basket
The sectoral composition of China's export growth has shifted significantly across the two episodes, with implications for who it competes with.
During the first China shock, China's exports were more concentrated in labor intensive sectors such as textiles, apparel, furniture, and basic electronics assembly. Over time, export growth has moved toward more capital and technology intensive industries, including electric vehicles, batteries, advanced machinery, and electronics. This shift brings China's export profile closer to that of advanced economies.
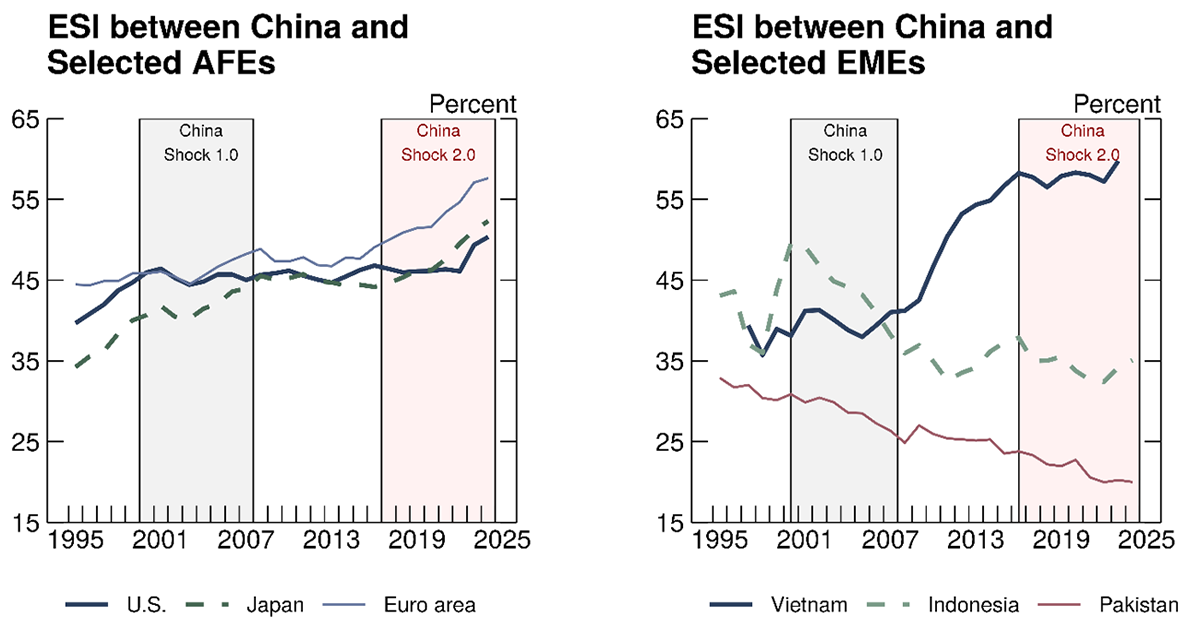
Figure 4 shows this change using Export Similarity Indices (Finger and Kreinin 1979; de Soyres, et al. 2025). Similarity between China and advanced economies has increased steadily since the late 2000s, pointing to growing overlap in more sophisticated sectors. By contrast, similarity with several emerging markets has been flat or declining, indicating less alignment in export structures.
Note: China Shock 1.0 shading extends from 2001 to 2008. China Shock 2.0 shading extends from 2018 to 2024.
Source: de Soyres et al. (2025), Authors’ calculations.
Vietnam stands out as an exception. Its export similarity with China has risen sharply, reflecting its role as an assembly hub within regional supply chains. Vietnam imports a large share of intermediate inputs from China and exports final goods to advanced economies, which increases the overlap in export baskets.
Overall, China is moving into product spaces that more directly overlap with advanced economies, while parts of the emerging world have either become less similar, or more integrated into production networks linked to Chinese manufacturing.
5. A Changing Global Trade Environment
The global trade environment today differs markedly from the early 2000s. The first China Shock unfolded during a period of generally declining trade barriers and broad commitments to trade liberalization. In contrast, recent years have seen rising trade tensions, more frequent use of protectionist policies, and a growing emphasis on industrial and investment policies in major economies.
Several studies document that geopolitical alignment increasingly influences trade flows and investment patterns, affecting how firms and governments allocate capital and market access across borders (Airaudo et al., 2025a, 2025b; Aiyar et al., 2023). Increased screening of foreign investment, targeted export controls, and reciprocal trade measures are now features of the policy landscape in many advanced economies.
The size of China's trade surplus, unusually large relative to the rest of world GDP, is likely to have contributed to these developments. In response to concerns about competitive pressures and non-market practices, several advanced economies have applied surtaxes and tariffs on Chinese imports, particularly for electric vehicles and steel, to protect domestic industries.
In this context, China Shock 2.0 is occurring in a world where both trade and investment policies are increasingly shaped by geopolitical considerations and concerns about strategic competition. The economic effects of China's export expansion will therefore be influenced not only by market forces but also by how countries adapt their policy frameworks in response.
Conclusion
China's accession to the WTO triggered one of the most widely studied episodes of global trade adjustment. More than two decades later, China's export sector and, more importantly, China's trade surplus, are again expanding rapidly.
The ongoing phase of China's export growth differs from the early China Shock along several key dimensions: the bigger scale of China's external surplus relative to the global economy, the increasing overlap between China's exports and those of advanced economies, and a global trade environment increasingly shaped by geopolitical considerations.
These differences suggest that the economic adjustments associated with China's export expansion may continue to reshape global production patterns and trade relationships in the years ahead.
References
- Airaudo, Florencia, François de Soyres, Ana Maria Santacreu and Keith Richards (2025a). "Measuring Geopolitical Fragmentation: Implications for Trade, Financial Flows, and Economic Policy", Review, Federal Reserve Bank of St. Louis, Third Quarter 2025.
- Airaudo, Florencia, François de Soyres, Alexandre Gaillard and Ana Maria Santacreu (2025b) "Recent Evolutions in the Global Trade System: From Integration to Strategic Realignment (PDF)", ECB Forum on Central Banking 2025.
- Autor, David, David Dorn, and Gordon Hanson (2016). "The China Shock: Learning from Labor-Market Adjustment to Large Changes in Trade", Annual Review of Economics, Vol. 8:205-240.
- de Soyres, Francois, and Dylan Moore (2024). "Assessing China's Efforts to Increase Self-Reliance," FEDS Notes. Washington: Board of Governors of the Federal Reserve System, February 2, 2024.
- de Soyres, François, Ece Fisgin, Alexandre Gaillard, Ana Maria Santacreu, and Henry Young (2025). "The Sectoral Evolution of China's Trade", FEDS Notes. Washington: Board of Governors of the Federal Reserve System, February 28, 2025.
- de Soyres, François, Ece Fisgin, Mike Liu, and Eva Van Leemput (2026). "China's Trade Dominance and the Role of Industrial Policies," FEDS Notes. Washington: Board of Governors of the Federal Reserve System, March 23, 2026.
- Finger, J.M., and M.E. Kreinin (1979). "A Measure of Export Similarity and Its Possible Uses." Economic Journal, Vol. 89, No. 356.
- Aiyar, S., J. Chen, C. Ebeke, R. Garcia-Saltos, T. Gudmundsson, A. Ilyina, A. Kangur, T. Kunaratskul, S. Rodriguez, M. Ruta, T. Schulze, G. Soderberg, and J. Trevino. "Geoeconomic Fragmentation and the Future of Multilateralism", IMF Staff Discussion Notes 2023.
- IMF (2023). Geoeconomic Fragmentation and the Future of Trade. International Monetary Fund.
- Pierce, Justin, and Peter Schott. (2016), "The Surprisingly Swift Decline of US Manufacturing Employment." American Economic Review 106 (7): 1632–62.
- Setser, Brad. (2025), "China's Massive Surplus is Everywhere (Yet The IMF Still Has Trouble Seeing It Clearly)", Follow The Money CFR blog, November 12, 2025.
- World Bank (2020). Global Value Chains in the Age of Globalization.
1. François de Soyres, Ece Fisgin, Eva Van Leemput and Kevin Vega are with the Board of Governors of the Federal Reserve System. Ana Maria Santacreu is with the Federal Reserve Bank of St Louis. The views expressed in this note are our own, and do not represent the views of the Board of Governors of the Federal Reserve, the Federal Reserve Bank of St Louis, nor any other person associated with the Federal Reserve System. Return to text
2. China's "Made in China 2025" plan was announced in May 2015, and it was intended to transform the country from a low-cost manufacturing hub into a global leader in high-tech industries by boosting innovation and reducing reliance on foreign technology. Return to text
3. In particular, U.S. technology restrictions on Chinese technology firms Huawei and ZTE in 2017–2018 and the 2018–2019 U.S. tariffs on China—prompted by U.S. concerns over national security and unfair trade practices—marked a turning point for China. Return to text
4. This approach follows the discussion in Setser (2025), who emphasizes the importance of expressing trade surpluses relative to the size of the global economy, while adopting a slightly different normalization. Return to text
5. To enhance readability and highlight broad geographic patterns, the maps aggregate countries into regional groupings including Mexico and Central America, South America, Africa, Europe and the Middle East, Asia excluding Russia, and Oceania. Each region is assigned a common color based on the aggregate change in China's share of imports, rather than displaying country level variation. The United States, Canada, and Russia are shown individually. Return to text
6. This reduction in U.S. dependence on China in recent years reflects deliberate policy efforts, including higher tariffs, to reduce reliance on China to promote domestic manufacturing and strengthen national security and supply chain resilience. Return to text
de Soyres, François, Ece Fisgin, Ana Maria Santacreu, Eva Van Leemput, and Kevin Vega (2026). "China shock 2.0: How China’s ongoing export surge differs from the early 2000s," FEDS Notes. Washington: Board of Governors of the Federal Reserve System, May 29, 2026, https://doi.org/10.17016/2380-7172.4071.
Disclaimer: FEDS Notes are articles in which Board staff offer their own views and present analysis on a range of topics in economics and finance. These articles are shorter and less technically oriented than FEDS Working Papers and IFDP papers.