FEDS Notes
August 31, 2020
Conflicting Signals: Implications of Divergence in Surveys and Market-Based Measures of Policy Expectations
By Anthony Diercks and Isfar Munir
Divergent signals can arise between survey-based and market-derived measures of policy expectations. In such situations, there is an open question of how one might interpret these divergent signals. For example, one approach would be to put all of one's faith in one set of expectations over the other, while another approach could be to put as much weight on the survey evidence as on the estimates obtained from market prices. Conflicting signals arise often enough that we can look to previous episodes for guidance on how to interpret future occurrences. For instance, in June 2019, Blue Chip consensus forecasts implied a flat expected path of the Federal Funds rate for the next nine months. In contrast, a straight read of forward rates implied by overnight index swap (OIS) quotes suggested a total of 75 basis points of easing by the end of the nine month period. Where did the Federal Funds rate end up after this divergence first appeared? Panel A of Figure 1 superimposes realized outcomes for the federal funds rate (solid black line) on top of expectations based on OIS forward rates (dashed blue line) and surveys (dashed orange line). This occurred again more recently in March 2020, when surveys predicted that rates would remain roughly flat for the next six months, while markets were pricing in additional rate cuts (see Panel B).
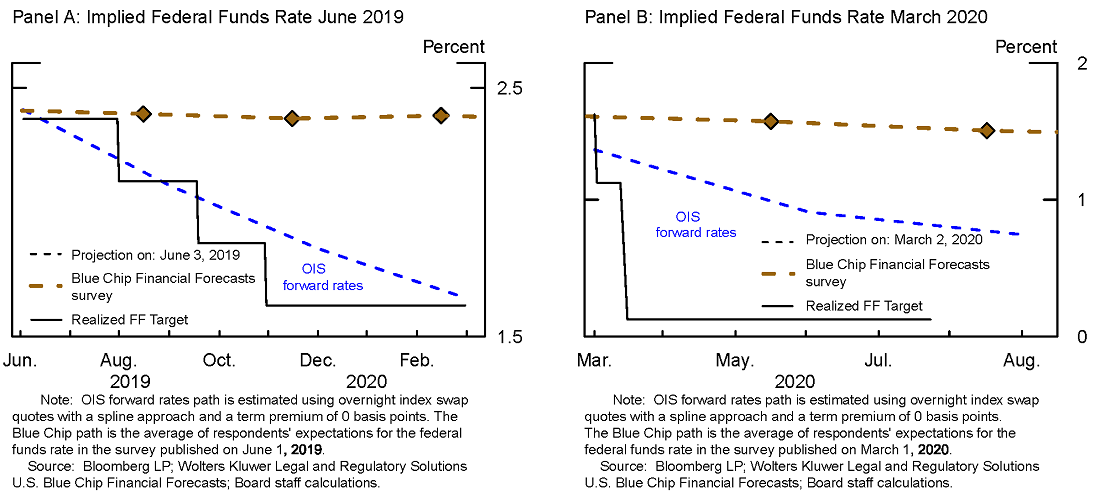
In each of these instances, the market-based measures and surveys sent conflicting signals. Panel A clearly shows the market-based forecast ended up closer to the realized federal funds, starting most clearly in September 2019, about 4-months after the forecast was made and holding true to the end of the shown time period of February 2020; in Panel B, we have early evidence of a similar outcome. These observations lead us to a basic but important question: when measures of expectations significantly diverge and send conflicting signals, which measure tends to have the best forecast performance?
As we will discuss in this note, we find that, over the past 15 years, market-based measures of policy expectations provide modestly better forecasts than surveys and other measures based on econometric models. However, the outperformance of OIS forward rates dramatically increases when surveys and market-based measures provide significantly divergent forecasts. To come to these conclusions and provide additional context, we first compare and contrast the pros and cons of some available measures of expectations of the policy rate, namely
- Market-based measures from OIS forward rates
- Blue Chip Financial Forecast Survey Mean of Modal Forecasts
- Macro-Finance Model (Based on Diercks and Carl (2019))
- OIS Shadow Rate Model (Based on updated version of Priebsch (2017))
Each measure has its own advantages and disadvantages, which we shall discuss in the following section.
Market-based forward rates
Market-based forward rates from OIS quotes give a direct measurement of the marginal investor's average (probability weighted) expectation of the federal funds rate, but only under the assumption of zero term premiums (term premiums capture the difference between the yield investors require for holding longer-term securities—whose realized returns are more sensitive to risks from future inflation or volatility in interest rates than shorter-term securities—and the expected yield from rolling over shorter-dated ones). The forward rates used in this exercise are constructed by first fitting a smoothed, cubic spline to OIS quotes to estimate the zero-coupon curve of OIS rates and then computing forward rates based on the parametrized zero-coupon curve. While they are measured accurately and update on a high frequency, the zero term premium assumption has been found to be unrealistic by many studies.1
Surveys
In principle, surveys seek to directly measure market participants' expectations of the federal funds rate and should be free of term premiums, but surveys are also less than perfect for a number of reasons, including:
- Surveys may not be directly comparable with market-based measures, because the surveys typically measure the most likely (i.e. modal) path, rather than an average expectation. By focusing on modal paths, surveys are less capable of capturing downside risks that tend to precipitate recessions. See Potter et al. (2017) for further discussion.
- Surveys might come from an unrepresentative sample and are only representative of "true" market expectations if they reflect the broader market population and represent the marginal investor. Buraschi et al. (2018), Hong et al. (2017), Wei and Yan (2010), and Chen et al. (2012) each stress the unlikelihood that the marginal investor has consensus beliefs.
- Surveys are only updated relatively infrequently and can become stale almost immediately after publication, making the predictions less able to take into account the most up-to-date information. A clear example for this involves the recent situation surrounding the coronavirus, in which survey forecasts became outdated very quickly amid fast-moving developments.
- Surveys may also suffer from rigidities associated with anchoring bias,2 forecast/revision smoothing,3 and reputational concerns that force forecasters to trade-off expected accuracy against stability and credibility.4 For instance, if a forecast is subject to large and frequent revisions, it becomes difficult to rely on for future investment plans. This creates a demand from users of the forecast for more stable predictions than would be the case if accuracy was the sole criterion.
Model-based expectations
OIS Shadow Rate Model. The OIS Shadow Rate Term Structure model (Priebsch 2017) seeks to adjust market-based measures of average federal funds rate expectations for term premiums. The OIS Shadow Rate model uses information in Blue Chip surveys along with an econometric model of past interest rate behavior to estimate term premiums. The model allows for measurement error in the surveys and is able to capture daily changes in term premiums. The econometric model of rates is mean-reverting and based on historical dynamics, which partially explains why the near-term path in the OIS Shadow Rate model is typically rising (the model-implied long-run mean is above the current federal funds rate). Moreover, the model attempts to closely match surveys, which are subject to the issues described above (modal path, infrequent availability, rigidities, etc). In addition, due to the mean-reversion on historical dynamics built into the model, the term structure model will likely have difficulty accounting for the implementation of new policies that do not resemble policy stances of the past. This could show up in the form of term premiums that are sizable and negative.
Macro-Finance Model. The Macro-Finance model (Diercks and Carl 2019) takes a different approach. At various horizons, it regresses the difference between survey forecasts and OIS forward-rates onto rolling covariances between real and nominal macro variables within a model averaging framework. This allows the model to extract the portion of the survey-forward rate gap that can be explained by the covariances and constructs the term premium from the model-averaged predicted value. This approach requires no assumptions about the behavior of interest rates in the long-run. A consequence of this methodology is that the model mainly captures low-frequency changes in term-premiums. By not relying on mean-reversion based on historical dynamics of interest rates, the Macro-Finance model may be better equipped to handle structural breaks and future changes in policy.
Forecasting Performance of the methodologies
To be clear, this note does not focus on the rationality of expectations or whether or not these forecasts are unbiased (i.e. forecast errors have a mean of zero) or efficient (i.e. forecast errors correlated with ex-ante info). Instead, our goal is to simply convey which of these measures seems to do best in forecasting the federal funds rate, especially when a gap opens up between surveys and market-based measures, as in recent times. Understanding the implications of divergence in signals would be useful for policymakers to know because if markets are trying to correctly predict outcomes, the true expectations will tend to hue closer to those that are most accurate over time.5 While our approach will not close the discussion on how policymakers should interpret differing signals from measures of expectations, it can establish a useful starting point from which to approach signal divergence.
Unconditional forecast performance
We first compute unconditional mean absolute forecast errors for various horizons from the projected path of the federal funds rate for each of the approaches discussed above. We also include a forecast that puts equal weight on the survey-based expectations and the OIS forward rates to see if this generates an improvement in performance. Table 1 shows that OIS forward rates consistently end up closest to realized outcomes regardless of the horizon. The difference in mean absolute errors between the Blue Chip Survey and OIS forward rates at the six-month horizon is about 7 basis points, which is about 30% of a typical 25-basis-point rate cut/increase.6 Performance of the two econometric models included fit in-between OIS forward rates and the Blue Chip Survey, with the Macro-finance model coming extremely close to the performance of the OIS forward rates while the OIS Shadow Rate term structure model comes very close to the Blue Chip survey's performance levels.
Table 1: Unconditional Forecast Performance based on Mean Absolute Errors
| Last 15Y MAE | Last 10Y MAE | Last 5Y MAE | ||||
|---|---|---|---|---|---|---|
| 6-mo | 1-yr | 6-mo | 1-yr | 6-mo | 1-yr | |
| OIS Forward Rates | 27.4* | 64.1* | 18.8* | 52.1* | 18.9* | 38.9* |
| Macro-Finance | 27.9 | 64.7 | 19.7 | 53.4 | 21.1 | 40.8 |
| OIS Shadow Rate | 33.4 | 73.7 | 24.8 | 60.7 | 23.8 | 45.1 |
| Blue Chip Survey | 33.9** | 74.9** | 25.5** | 63.3** | 27.8** | 49.6** |
| Survey & OIS Forward Rates Average | 30 | 68.7 | 21.6 | 56.9 | 22.5 | 42.9 |
* indicates lowest MAE, while ** indicates highest MAE. Both the OIS Shadow Rate term structure model and Macro-Finance model are calculated based on in-sample estimates.
Forecast performance conditional on there being a gap between surveys and OIS forward rates
As previously discussed, a gap emerged between surveys and OIS forward rates in June 2019 and in March 2020. Gaps like these have shown up repeatedly over the past 15 years for varying durations in each instance (gaps have closed both due to the survey forecasts coming closer to forward rates and vice versa). For instance, Figure 2 shows a comparison of OIS forward rates and Blue Chip survey forecasts for one year ahead. The blue bars indicate when the gap between the two sets of expectations is more negative than 50 basis points, as was the case more recently and also in June 2019, and makes up about 19% of the sample. 7 We will focus our analysis on cases where the forecast based on OIS-forward rates was below that of the Blue Chip survey for two reasons: (1) this is the most recently observed behavior, and (2) this situation has occurred more frequently than the opposite case, when forward rates were above the Survey forecasts, as seen in Figure 2.
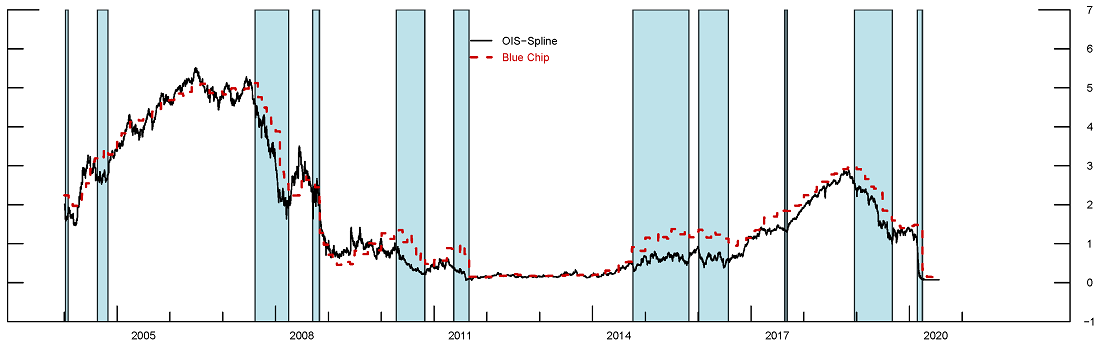
Note: This figure shows the 1-year forward rate (black) and the Blue Chip forecast of the federal funds rate four quarters ahead (red). The blue bars indicate time periods in which the gap between the Blue Chip forecast and forward rate is greater than 50 basis points.
Source: Bloomberg LP; Wolters Kluwer Legal and Regulatory Solutions U.S. Blue Chip Financial Forecasts; Board staff calculations.
Table 2 shows the mean absolute errors conditioning on different-sized gaps between OIS forward rates and surveys. As the gap becomes more negative (ranging from -12.5 to -50 basis points), the relative outperformance of OIS forward rates dramatically increases. While the unconditional difference in forecast performance was about 7 basis points at the 6-month horizon, this jumps to 20 basis points when the gap is more negative than -12.5 basis points. When the gap is greater than a full 25-basis-point rate change, the difference in forecast performance is close to 40 basis points, which is an economically significant disparity. A similar pattern holds for the one-year ahead forecasts shown on the right in Table 2.
Table 2: Mean Abs. Errors when gap between surveys & OIS is more negative than -12.5 … -50 bps
| Last 15Y MAE 6-Months | Last 15Y MAE 1-year | |||||||||
|---|---|---|---|---|---|---|---|---|---|---|
| OIS-Survey Gap | Uncond | -12.5 | -25 | -40 | -50 | Uncond | -12.5 | -25 | -40 | -50 |
| OIS Forward Rates | 27.4 | 33.2* | 41.3* | 59.0* | 72.1* | 64.1 | 72.3* | 74.8* | 74.9* | 76.5* |
| Macro-Finance | 27.9 | 35.7 | 45.5 | 61.7 | 74.4 | 64.7 | 73.7 | 76.9 | 78.7 | 81.2 |
| OIS Shadow Rate | 33.4 | 43.1 | 57 | 78 | 95.2 | 73.7 | 82.6 | 86.3 | 91.4 | 96.9 |
| Blue Chip Survey | 33.9 | 53.3** | 78.7** | 113** | 137** | 74.9 | 94.6** | 102** | 114** | 127** |
| Survey & OIS Forward Rates Average | 30 | 41.7 | 57.5 | 82.4 | 101 | 68.7 | 82.3 | 87.3 | 92.8 | 99.6 |
Figure 3 graphically coincides with the implications of Table 2. A 30-day rolling window of mean absolute errors of forecasts of the federal funds rate (12-months ahead) is plotted for the past 15 years. The plotted errors are based on forecasts made one year ago. The areas shaded in blue indicate time periods when there was a gap of -50 basis points or more at the time of forecast between the 1-year ahead Blue Chip survey and OIS forward rates. These time periods correspond to the far right column in Table 2. Out of the ten observed episodes, eight of them show the Blue Chip survey (purple line) having the largest mean absolute errors. And in most of these time periods, the OIS forward rate (blue line) has the lowest mean absolute error.
Figure 3.Mean Absolute Errors of forecasts of the Fed Funds Rate, 1-yr ahead (30 day rolling window).
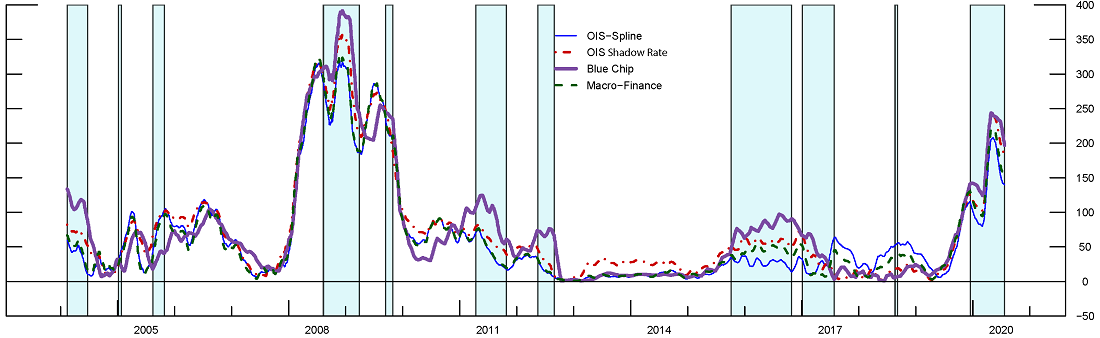
Shaded areas indicate gap of −50 bps or more at the time of forecast between 1−year ahead Blue Chip survey and forward rates. Plotted errors are based on forecasts made 1−year ago.
Source: Bloomberg LP; Wolters Kluwer Legal and Regulatory Solutions U.S. Blue Chip Financial Forecasts; Board staff calculations.
Finally, Table 3 shows the percent of the time that each forecast comes closest to the realized outcome. Consistent with Table 2 and Figure 2, we see that the OIS forward rates come closest to the realized federal funds rate. And the outperformance grows as the gap becomes larger and larger at the one-year horizon.
Table 3: Best Forecast % of days when gap between surveys & OIS more negative than -12.5 … -50 bps
| Last 15Y % Best Forecast 6-Months | Last 15Y % Best Forecast 1-year | |||||||||
|---|---|---|---|---|---|---|---|---|---|---|
| OIS-Survey Gap | Uncond | -12.5 | -25 | -40 | -50 | Uncond | -12.5 | -25 | -40 | -50 |
| OIS Forward Rates | 28% | 55% | 69% | 64% | 62% | 48% | 62% | 65% | 73% | 77% |
| Macro-Finance | 34% | 16% | 15% | 23% | 22% | 13% | 4% | 4% | 5% | 5% |
| OIS Shadow Rate | 9% | 10% | 2% | 1% | 2% | 7% | 9% | 8% | 2% | 2% |
| Blue Chip Survey | 25% | 14% | 4% | 2% | 3% | 29% | 21% | 21% | 16% | 11% |
| Survey & OIS Forward Rates Average | 4% | 5% | 10% | 10% | 11% | 3% | 3% | 3% | 4% | 4% |
Conclusion
Overall, this note is meant to illustrate that as of the last 15 years, predictions based on market quotes tend to provide better forecasts of the federal funds rate. Moreover, this outperformance dramatically increases when gaps emerge between surveys and OIS forward rates, which has happened again more recently. In times of divergence, we can draw some tentative conclusions that the well-documented drawbacks of surveys (such as rigidities related to forecast smoothing, reputational concerns, modes vs means, etc.) may be hampering their relative forecasting efficacy. Going forward, our findings in favor of the OIS forward rates should be kept in mind when evaluating conflicting signals for the expected path of monetary policy.
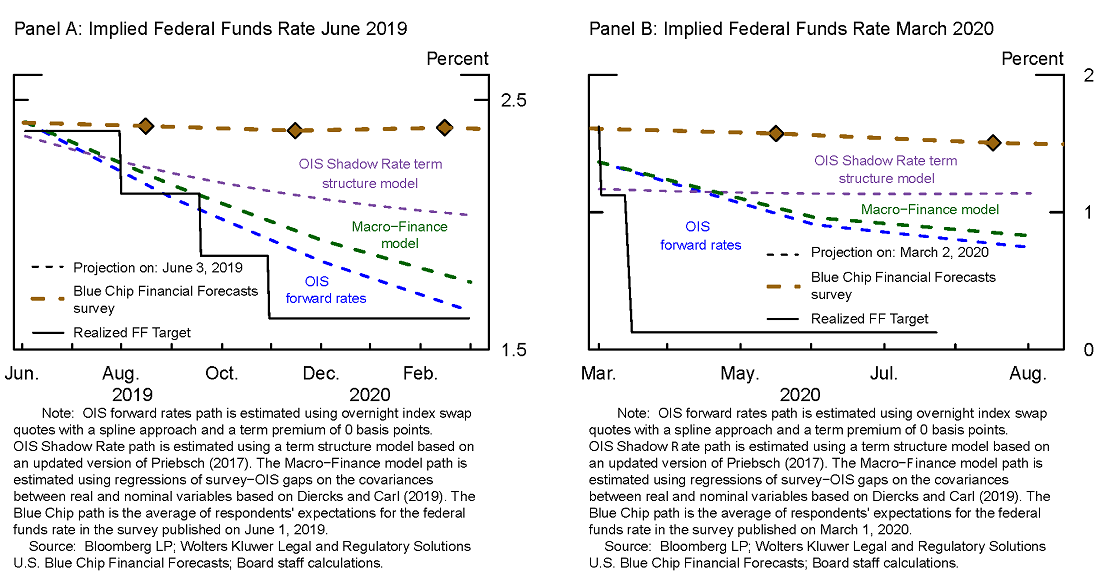
Appendix
Below shows the various expectations discussed within the note in June 2019 and March 2020.
References
Buraschi, Andrea, Ilaria Piatti, and Paul Whelan. "Rationality and Subjective Bond Risk Premia." (2018).
Campbell, John Y., and Robert J. Shiller. "Yield spreads and interest rate movements: A bird's eye view." The Review of Economic Studies 58.3 (1991): 495-514.
Campbell, Sean D., and Steven A. Sharpe. "Anchoring bias in consensus forecasts and its effect on market prices." Journal of Financial and Quantitative Analysis 44.2 (2009): 369-390.
Chang, Tzu-Pu, and Ray Yeutien Chou. "Anchoring Effect on Macroeconomic Forecasts: A Heterogeneity Approach." Proceedings of MAC-MME 2016 (2016): 180.
Chen, Hui, Scott Joslin, and Ngoc-Khanh Tran. "Rare disasters and risk sharing with heterogeneous beliefs." The Review of Financial Studies 25.7 (2012): 2189-2224.
Coibion, Olivier, and Yuriy Gorodnichenko. "Information rigidity and the expectations formation process: A simple framework and new facts." American Economic Review 105.8 (2015): 2644-78.
Diercks, Anthony M., and Uri Carl (2019). "A Simple Macro-Finance Measure of Risk Premia in Fed Funds Futures," FEDS Notes. Washington: Board of Governors of the Federal Reserve System, January 8, 2019, https://doi.org/10.17016/2380-7172.2305.
Dovern, Jonas, et al. "Information rigidities: Comparing average and individual forecasts for a large international panel." International Journal of Forecasting 31.1 (2015): 144-154.
Ehrbeck. Tilman, Robert Waldmann, Why Are Professional Forecasters Biased? Agency versus Behavioral Explanations, The Quarterly Journal of Economics, Volume 111, Issue 1, February 1996, Pages 21–40, https://doi.org/10.2307/2946656
Fama, Eugene F., and Robert R. Bliss. "The information in long-maturity forward rates." The American Economic Review (1987): 680-692.
Harrison Hong, David Sraer, Jialin Yu, Inflation Bets on the Long Bond, The Review of Financial Studies, Volume 30, Issue 3, March 2017, Pages 900–947, https://doi.org/10.1093/rfs/hhw090
Ichiue, H. and Yuyama, T., 2009. Using Survey Data to Correct the Bias in Policy Expectations Extracted from Fed Funds Futures. Journal of Money, Credit and Banking, 41(8), pp.1631-1647.
Laster, David, Paul Bennett, and In Sun Geoum. "Rational bias in macroeconomic forecasts." The Quarterly Journal of Economics 114.1 (1999): 293-318.
Nordhaus, w.d., 1987. forecasting efficiency: concepts and applications. review of economics and statistics, 69(4), pp.667-674
Ottaviani, M. and Sørensen, P.N. 2006. The Strategy of Professional Forecasting. Journal of Financial Economics, 81(2), pp.441-466.
Potter, Simon and Del Negro, Marco and Topa, Giorgio and van der Klaauw, H. Wilbert, The Advantages of Probabilistic Survey Questions (June 8, 2017). Review of Economic Analysis 9 (1), 1-32. Available at SSRN: https://ssrn.com/abstract=3098648
Priebsch, Marcel A. (2017). "A Shadow Rate Model of Intermediate-Term Policy Rate Expectations," FEDS Notes. Washington: Board of Governors of the Federal Reserve System, October 4, 2017, https://doi.org/10.17016/2380-7172.2056.
Scotese, Carol A. "Forecast smoothing and the optimal under-utilization of information at the Federal Reserve." Journal of Macroeconomics 16.4 (1994): 653-670.
Xiong, Wei, and Hongjun Yan. "Heterogeneous expectations and bond markets." The Review of Financial Studies 23.4 (2010): 1433-1466.
1. A large literature, beginning with Fama and Bliss (1987) and Campbell and Shiller (1991), have emphasized the existence of time-varying term premiums. Return to text
2. See Campbell and Sharpe (2009), Chang and Chou (2016), and Ichiue and Yuyama (2009). Return to text
3. Nordhaus (1987) posits that forecasters smooth their estimates because a more accurate but erratic forecast would irritate investors who have to reverse decisions about investment plans too frequently. Scotese (1994), Ehrbeck and Waldmann (1996), Coibion and Gorodnichenko (2015), and Dovern et al. (2015) all document smoothing or under-reaction to new information. Return to text
4. See Laster et al. (1999) and Ottaviani and Sorensen (2006) Return to text
5. This view is consistent with the "market selection hypothesis" which suggests that investors who are consistently more accurate will accumulate greater weight in the pricing kernel and outlast investors who are less accurate over time. Return to text
6. Diebold and Mariano (1995) tests confirm that the difference in these forecast errors are statistically significant. Return to text
7. Out of 4078 daily observations for the 1-year horizon, 19% of days have more negative than 50 bps gap, 28% for 40 bps, 41% for 25 bps, and 52% of days for 12.5 bps gap. For the 6-month horizon, 4% for 50 bps, 7% for 40 bps, 14% for 25 bps and 31% at 12.5 bps gap. Return to text
Diercks, Anthony M., and Isfar Munir (2020). "Conflicting Signals: Implications of Divergence in Surveys and Market-Based Measures of Policy Expectations," FEDS Notes. Washington: Board of Governors of the Federal Reserve System, August 31, 2020, https://doi.org/10.17016/2380-7172.2568.
Disclaimer: FEDS Notes are articles in which Board staff offer their own views and present analysis on a range of topics in economics and finance. These articles are shorter and less technically oriented than FEDS Working Papers and IFDP papers.