


FEDS Notes
October 09, 2026
Convenience Yields, Risk Premiums, and the Interpretation of Oil Futures Prices During Times of Geopolitical Conflict1
Erik Heitfield, Yang-Ho Park and Erfan Danesh
1. Introduction
Earlier this year the Middle East conflict led to one of the largest global oil supply shocks in history (Bordoff and O'Sullivan, 2026). Past empirical research has found that commodity futures prices provide accurate predictions of future spot prices under normal market conditions (Reeve and Vigfusson, 2011; Chernenko et al., 2004). However, given the extent of disruptions in oil markets, there are concerns that current oil futures prices may be less informative about future spot prices than usual. The relationship between crude oil futures prices and expected future spot prices at any point in time is complicated by the existence of embedded risk premiums that compensate investors for the uncertainty and transaction costs associated with holding long oil futures positions. These premiums can either be positive or negative depending on current market and macroeconomic conditions. This note investigates how disruptions in oil supply are likely to affect embedded risk premiums and hence the forecast accuracy of futures prices. We find the following:
- The abrupt reduction in oil supply resulting from the closure of the Strait of Hormuz early in the Middle East conflict caused spot oil prices to rise well above futures prices. This pattern of severe backwardation is common in commodity markets subject to negative supply shocks, but the degree of backwardation in oil futures was temporarily near its highest point in the last quarter century.
- Our empirical analysis of oil futures data since 2000 indicates that oil risk premiums are likely to have been negative since March, as long positions in oil futures may be viewed by market participants as a hedge against near-term macroeconomic risk. A simple reduced-form empirical model suggests that oil future prices usually overstate investors' expectations for future spot prices when futures prices are severely backwardated, as has been the case since the current conflict began.
- Liquidity in oil futures markets has been very low throughout the Middle East conflict, with both shorter and longer-dated contracts experiencing pronounced reductions in top-of-the-book market depth. Elevated liquidity premiums in less liquid contracts represent an additional factor that affects the relationship between futures prices and future spot prices.
Oil futures prices should provide an indication of market participants' expectations about future oil prices, but neither economic theory nor a large body of empirical work suggests that this relationship is likely to be one-to-one in all circumstances. On the contrary, when futures markets are severely backwardated there are strong reasons to believe that futures contract prices will be higher than the marginal investor's expectations for prices at contract expiry.
2. Current market conditions in historical context
Figure 1 compares average West Texas Intermediate (WTI) crude spot and futures prices since the current Middle East hostilities began on February 28 with average data for other recent episodes involving energy market dislocations. Spot and futures prices are somewhat lower than they were during the early months following Russia's full-scale invasion of Ukraine, but the degree of backwardation – that is, the extent to which spot prices exceed futures prices – is considerably greater. Backwardation is a common feature of commodity markets in the midst of a severe supply shock and reflects market participants' preference for immediate and certain access to a commodity in short supply. The opposite situation – called contango – arises during unexpected supply gluts such as the one that occurred a few months after the onset of the COVID pandemic, shown by the line labeled “COVID Oil Supply Glut”.
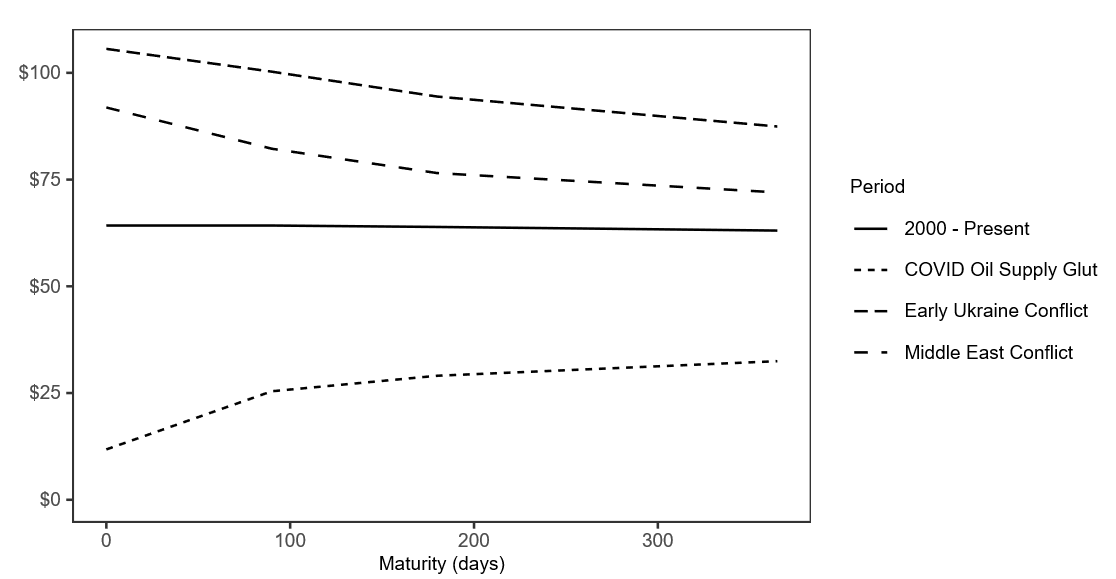
Sources: CME Datamine, U.S. Energy Information Administration via FRED, Authors' calculations.
Figure 2, panel (a) shows spot and futures prices for oil over the last 26 years.2 Spot prices have moved up from a recent low of around $60 per barrel at the beginning of the year and have fluctuated between $80 and $100 per barrel since early March. While this move has been significant, the current level of oil prices is not exceptionally high by historical standards. Spot prices are comparable to the levels last seen in the early months of Russia's invasion of Ukraine and are well below the levels reached in the months leading up to the global financial crisis. Longer dated futures prices have also moved up since the beginning of the year, but to a lesser extent than spot prices. Six-month and one-year futures prices continue to be substantially lower than they were in early 2022.
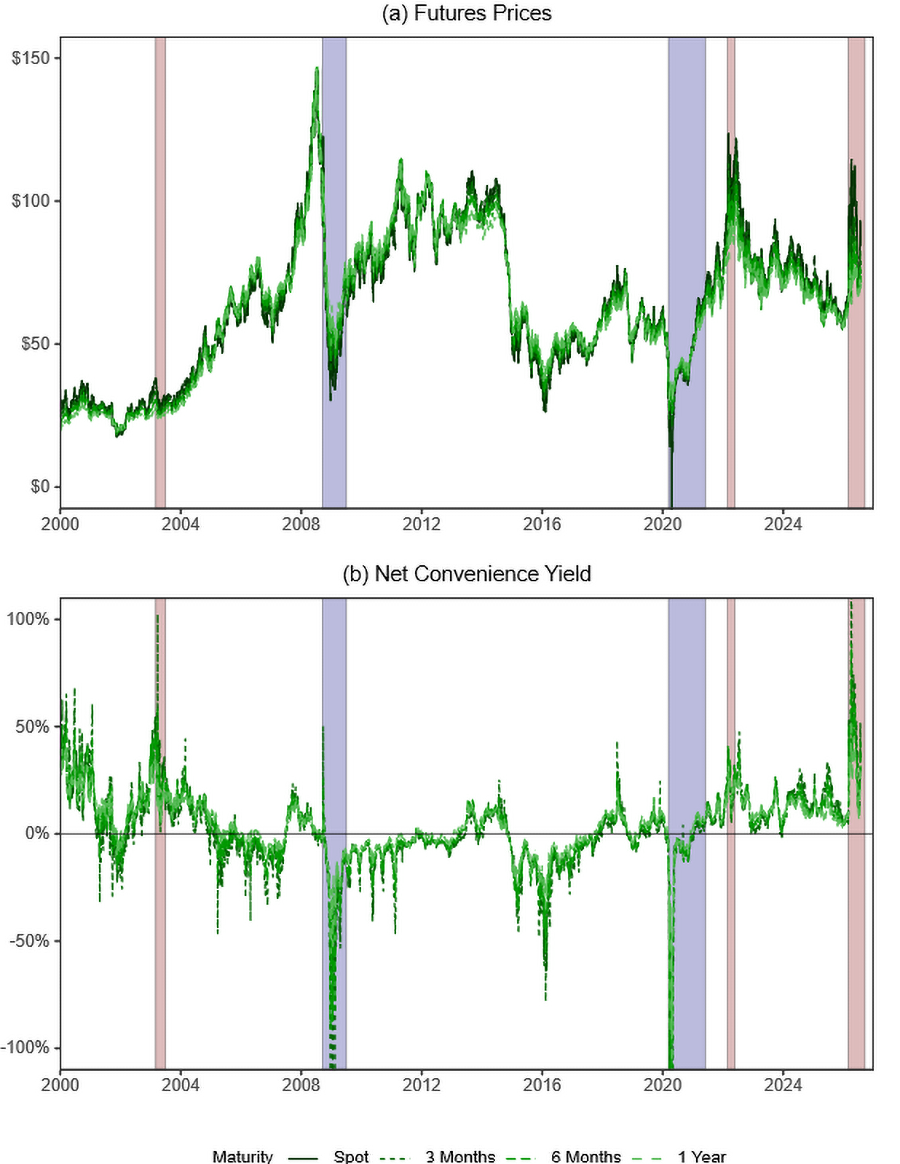
Notes: Red shading denotes negative oil supply shocks (1/3/03 to 6/30/03; 2/24/22 to 5/24/22; 2/26/28 to present). Blue shading denotes negative oil demand shocks (8/15/08 to 6/30/09; 3/11/20 to 6/1/21).
Sources: CME Datamine, U.S. Energy Information Administration via FRED, Authors' calculations.
The magnitude of the current negative slope of the oil futures price curve is exceptionally large by historical standards. Figure 2, panel (b) plots net convenience yields implied by WTI futures. A direct measure of backwardation, net convenience yields capture the extent to which current spot prices exceed current futures prices after adjusting for the cost of capital. Net convenience yields can be interpreted as the implicit economic benefits net of storage costs that a risk-neutral holder of oil over the life of a futures contract expects to receive. Under most circumstances oil storage costs are low and reasonably stable. However, because there are physical constraints on oil storage capacity over the short run, storage costs can increase dramatically when a glut of oil arrives on the market at a particular place and time. For example, during the spring of 2020 oil production failed to contract as quickly as demand in response to the emerging COVID pandemic. Available storage capacity filled up and storage costs increased dramatically (U.S. Energy Information Administration, 2020). This episode appears in Figure 2 as a downward spike in spot prices and net convenience yields in May 2020, and in Figure 1 as a steeply upward sloping average futures price curve.
A large negative oil supply shock, such as the one we are currently experiencing, causes net convenience yields to rise. Refiners who require continuous access to feed stock in order to keep their production lines operating bid up spot prices. At the same time oil inventories are drawn down to fill the supply gap, and users of all types place a high value on access to the physical commodity as insurance against future supply disruptions. Early in the current conflict futures-implied convenience yields moved to some of the highest levels seen in our twenty-six-year data series. More so than the level of prices, the very high level of implied net convenience yields is a clear indication of substantial disruption in global oil markets.
The ongoing oil supply shock is also reflected in current market liquidity conditions. Top-of-book market depth, a measure of futures market liquidity, is defined as the number of contracts available for trading at best quoted prices.3 Figure 3 shows total top-of-book depth aggregated across five maturity buckets – front month, 2-3 months, 3-6 months, 6-12 months, and 1-2 years – from 2006 through July 2026. Longer-dated futures contracts are generally less liquid and hence embed larger liquidity premiums compared to front-month contracts. The Middle East conflict period, extending through the end of our data, exhibits a severe and sustained deterioration in market depth across all maturity buckets. While previous crises exhibited sharp but relatively brief liquidity shocks followed by recovery within weeks or months, the current conflict so far represents a prolonged period of suppressed liquidity extending over five months with no clear signs of recovery. Low liquidity is evident across the entire maturity curve, indicating that liquidity premiums have likely increased in magnitude across all tenors.
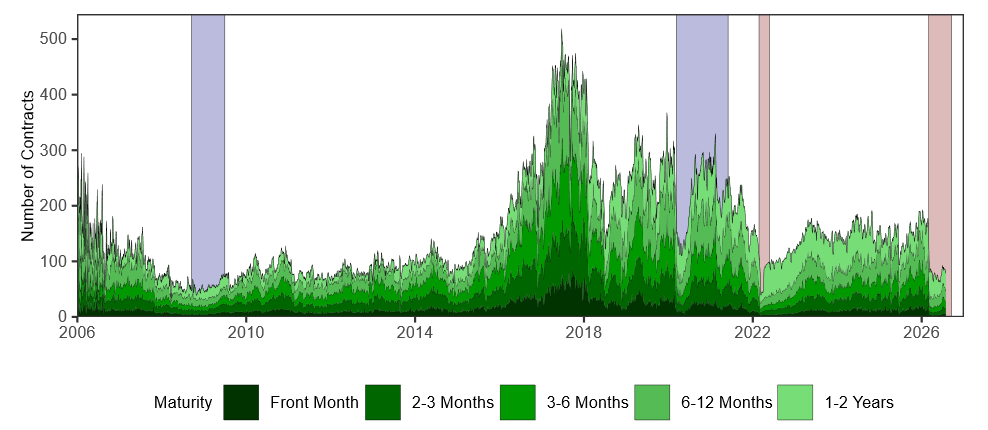
Notes: Red shading denotes negative oil supply shocks (1/3/03 to 6/30/03; 2/24/22 to 5/24/22; 2/26/28 to present). Blue shading denotes negative oil demand shocks (8/15/08 to 6/30/09; 3/11/20 to 6/1/21 ). The key identifies areas in order from bottom to top.
Sources: LSEG Tick History, Authors' calculations.
3. The effects of geopolitical conflict on oil risk premiums
Risk premiums have been studied extensively using both reduced form empirical models (Reeve and Vigfusson, 2011; Chernenko et al., 2004) and structural asset pricing models (Casassus and Collin-Dufresne, 2005; Cortazar et al., 2015; Hamilton and Wu, 2014; Valenti et al., 2020). While results differ depending on the data and assumptions used, the broad consensus of this research is that oil risk premiums tend to be low on average – on the order of a few percentage points – but that they vary over time. The premium associated with holding a long position in oil may either be positive or negative depending on market conditions and the expected correlation between future oil prices and broader macroeconomic factors. In considering the causes of changes in the magnitude and direction of oil risk premiums one can either take a markets perspective or a macro-finance perspective.
The markets perspective examines the incentives of those who wish to hedge future price changes. Oil producers are naturally long the physical commodity and may wish to hedge against price decreases by selling oil futures, pushing futures prices down relative to expected spot prices. Large energy consumers such as airlines face the opposite incentives, and their efforts to hedge against price increases by buying futures tends to drive the relative price of futures up. The net effect on risk premiums depends on the balance of buying and selling pressures. The magnitude of the risk premium in either direction may be affected by the capacity and willingness of dealers and speculators to take on risk in response to an imbalance between futures buying and selling pressures. When oil supply becomes severely disrupted, one could reasonably expect that the value of hedging against further price increases might grow relative to that of hedging against price declines, so the risk premium is likely to shift in a negative direction. Effects would be exacerbated if dealers and speculators reduce their market-making activity in response to increased uncertainty (Etula, 2013). Similarly, the magnitude of risk premiums – whether positive or negative – may increase when market liquidity is impaired, as market-makers and investors require additional compensation to induce them to participate in such markets.
A macro-finance interpretation of the risk premium suggests similar near-term dynamics. Under this view, the risk premium associated with oil investments should depend on the magnitude and direction of correlations between future oil prices and broader macroeconomic conditions. Positive shocks to aggregate demand can be expected to increase economic activity, bidding up oil prices, and leading to a positive correlation between oil prices and macroeconomic conditions and a positive risk premium. Geopolitical risk, particularly that which directly affects oil supply, may have the opposite effect. Constrained oil output may push oil prices up, increasing costs for a variety of productive inputs and harming economic growth. In this case oil prices may be negatively correlated with future macroeconomic conditions, causing the risk premium to become negative.
As shown in Figure 4, daily WTI spot returns have recently become highly negatively correlated with equity market returns, consistent with the hypothesis that oil positions may now serve as a near-term hedge against broader market risk. The long-run oil-equity correlation since 2000 is positive 18 percent, however, so it is possible that current risk premiums over shorter horizons are lower (or more strongly negative) than those over longer horizons. Overall, geopolitical conflict that severely constrains the supply of oil seems likely to lead to downward pressure on oil risk premiums, resulting in futures prices that are more likely to overstate expected future spot prices than they would at other times.
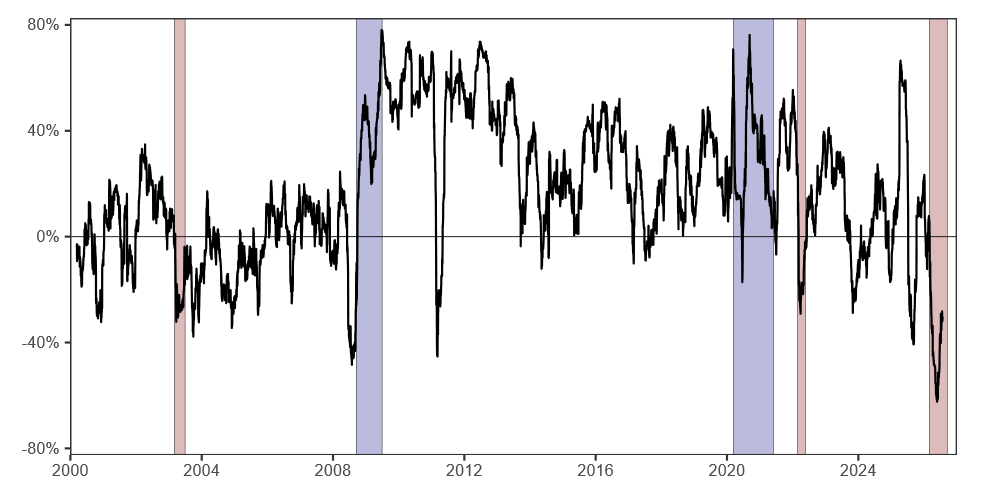
Sources: U.S. Energy Information Administration via FRED, Authors' calculations.
4. Estimates of time-varying risk premiums
Employing a reduced-form approach similar to Fama and French (1987), this section examines how oil futures risk premiums have changed over the last two decades. Our regression specification is as follows:
$$$$ s_{t+m} - f_{t,m} = \alpha + \beta_{\text{slope}}(f_{t,m} - s_t) + \epsilon_t \ (1) $$$$
where $$s_t$$ is the log spot price at date $$t$$ and $$f_{t,m}$$ is the date $$t$$ log price of a futures contract with maturity $$m$$. The left-hand-side of Equation 1 is the realized return from a long position in a futures contract. The parameter $$\alpha$$ accommodates a constant risk premium, while $$\beta_{\text{slope}}$$ allows for a risk premium that varies over time with the degree of backwardation/contango in the futures market. As discussed in Section 3, economic theory would suggest that the risk premium for oil contracts may become more negative when futures are severely backwardated, implying a positive value for $$\beta_{\text{slope}}$$.4
A challenge with estimating relationships of this sort is that slow-moving changes in market conditions may cause parameters to drift over time. During the span of our data there have been at least three well-documented structural shifts in oil markets that may make historical data less informative about current conditions. First, China's integration into the global trading system early in the century led to a sustained expansion in energy demand (Hamilton, 2009) which shows up in Figure 2 as severe backwardation and a massive run-up in oil prices from 2000 to 2008. Second, the shale production boom after 2010 has enabled the U.S. to become the world's largest oil producer and to shift from a net importer to a net exporter of crude oil (Kilian, 2016). Finally, with the growing financialization of commodity markets in recent decades investors who are neither producers nor consumers have come to play an increasingly important role in oil futures markets (Fattouh et al., 2013).
To address the potential effects of slow-moving, long-run structural changes we estimate model parameters using an exponential weighting scheme that places more weight on more recent observations.5 As shown in Figure 5, parameter estimates change as we expand our data window forward in time but they become less volatile in later years. This is partly a mechanical function of the longer data series used in later years, but also appears to reflect some stabilization of the structural shifts discussed above.
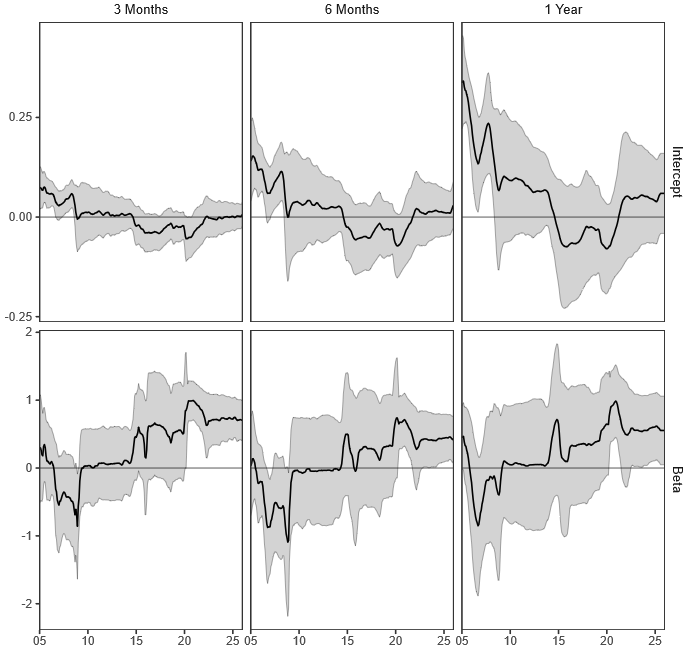
Notes: 90 percent confidence interval shown in gray.
Sources: CME Datamine, U.S. Energy Information Administration via FRED, Authors' calculations.
Table 1 shows estimates of model parameters for three-, six-, and twelve-month futures contracts based on the most recent data available using exponential decay sampling weights. Consistent with past research, these results suggest that risk premiums are likely to be negligible on average but tend to fluctuate substantially over time. The estimates of $$\beta_{\text{slope}}$$ are positive and statistically significantly different from zero, indicating that risk premiums can be expected to be positive when futures markets are in contango and negative when they are backwardated. The differences in estimated values of $$\beta_{\text{slope}}$$ across maturities are small relative to their standard errors. Thus, there is little evidence that the slope effect varies by maturity.
Table 1: Models of futures risk premiums
| Dependent Variable: | 3 Months | $$s_{t+m} −f_{t,m}$$ 6 Months | 1 Year |
|---|---|---|---|
| Model: | (1) | (2) | (3) |
| Variables Constant | 0.0198 (0.0226) |
0.0337 (0.0366) |
0.0594 (0.0606) |
| $$f_{t,m} −s_t$$ | 0.6682∗∗∗ (0.1534) |
0.4204∗∗ (0.2070) |
0.5532∗ (0.3064) |
| Fit statistics Standard-Errors | L=90 | L=180 | L=360 |
| Observations | 6,586 | 6,522 | 6,401 |
| R2 | 0.02985 | 0.01529 | 0.03525 |
Notes: Signif. Codes: ***: 0.01, **: 0.05, *: 0.1
Estimated using exponential decay sample weights.
Sources: CME Datamine, U.S. Energy Information Administration via FRED, Authors' calculations.
Figure 6 shows fitted risk premiums by futures contract maturity over time using our most recent parameter estimates. Estimated risk premiums are centered around zero, but have trended in the negative direction as oil futures markets have become more backwardated in recent years. Fitted risk premiums fluctuate substantially from day to day as the slope of the daily futures curve changes. This suggests that some amount of smoothing across daily observations is probably appropriate when futures prices are used for forecasting spot rates.
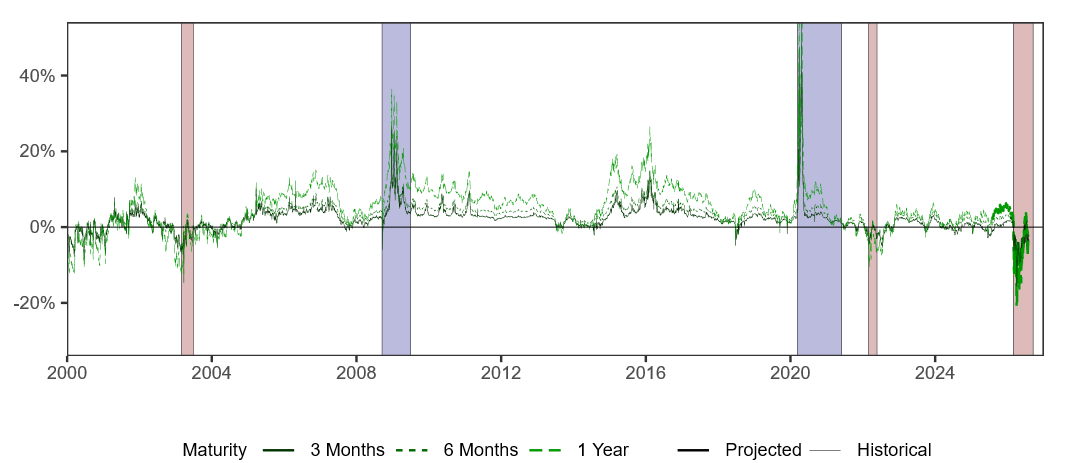
Notes: Red shading denotes negative oil supply shocks (1/3/03 to 6/30/03; 2/24/22 to 5/24/22; 2/26/28 to present). Blue shading denotes negative oil demand shocks (8/15/08 to 6/30/09; 3/11/20 to 6/1/21).
Sources: CME Datamine, U.S. Energy Information Administration via FRED, Authors' calculations.
Table 2 shows estimated risk premiums for selected historical periods using the same average futures prices shown in Figure 1. Projected risk premiums using average futures prices over our full 26-year data window are very small, confirming that future prices provide effective forecasts of realized future spot prices under normal market conditions where the slope of the futures curve is reasonably flat. Estimates of risk premiums using average futures prices since the beginning of the current Middle East conflict are substantially more negative than those associated with the first months of the Ukraine conflict.
Table 2: Estimated risk premiums using average prices for selected periods
| Period | Maturity | Futures Price | Spot Price | Risk Premium | S.E |
|---|---|---|---|---|---|
| 2000- Present | 3 Months | $64.24 | $64.24 | 2.00% | 2.30% |
| 6 Months | $63.90 | $64.24 | 3.20% | 3.70% | |
| 1 Year | $63.06 | $64.24 | 4.90% | 5.90% | |
| COVID Oil Supply Glut | 3 Months | $25.41 | $11.79 | 53.30% | 11.90% |
| 6 Months | $29.05 | $11.79 | 41.30% | 18.80% | |
| 1 Year | $32.46 | $11.79 | 62.00% | 33.40% | |
| Early Ukraine Conflict | 3 Months | $100.28 | $105.62 | -1.50% | 2.40% |
| 6 Months | $94.44 | $105.62 | -1.30% | 4.50% | |
| 1 Year | $87.43 | $105.62 | -4.50% | 6.90% | |
| Middle East Conflict | 3 Months | $82.23 | $91.89 | -5.40% | 2.90% |
| 6 Months | $76.52 | $91.89 | -4.30% | 5.40% | |
| 1 Year | $71.99 | $91.89 | -7.60% | 8.00% |
Sources: CME Datamine, U.S. Energy Information Administration via FRED, Authors' calculations.
Our finding that risk premiums on oil futures have been strongly negative since March is consistent with the markets and macro-finance perspectives discussed in Section 3. In the current environment hedgers are likely to be more concerned about oil price increases than price declines, and the correlation between oil returns and macroeconomic conditions is likely to be negative. While both economic theory and our empirical models point to negative risk premiums, the specific magnitudes projected for the Middle East conflict in Table 2 should be interpreted with some caution. As discussed in Section 2, the level of backwardation in oil futures markets in March through May is nearly unprecedented in our historical data, so projected risk premiums since March reflect an extrapolation outside of the typical range of data used to fit our models.
5. Conclusion
Large adverse physical supply shocks cause oil futures markets to become backwardated because, when supply is short, oil consumers highly prize immediate access to the physical commodity. The same conditions that cause futures markets to become backwardated are also likely to cause oil prices to become negatively correlated with broader macroeconomic conditions, so oil futures prices can be expected to embed a negative risk premium. Oil futures prices are thus likely to overstate investors' expectations for future oil prices during periods of geopolitical conflict that constrains oil supply.
References
Bordoff, J. and O'Sullivan, M. L. (2026). The Iran shock and the dangerous allure of energy autarky. Foreign Affairs, 105(3):30–37.
Casassus, J. and Collin-Dufresne, P. (2005). Stochastic convenience yield implied from commodity futures and interest rates. The Journal of Finance, 60(5):2283–2331.
Chernenko, S. V., Schwarz, K. B., and Wright, J. H. (2004). The information content of forward and futures prices: Market expectations and the price of risk. FRB International Finance Discussion Paper, (808).
Cortazar, G., Kovacevic, I., and Schwartz, E. S. (2015). Expected commodity returns and pricing models. Energy Economics, 49:60–71.
Etula, E. (2013). Broker-dealer risk appetite and commodity returns. Journal of Financial Econometrics, 11(3):486–521.
Fama, E. F. and French, K. R. (1987). Commodity futures prices: Some evidence on forecast power, premiums, and the theory of storage. The Journal of Business, 60(1):55–73.
Fattouh, B., Kilian, L., and Mahadeva, L. (2013). The role of speculation in oil markets: What have we learned so far? The Energy Journal, 34(3):7–33.
Hamilton, J. D. (2009). Causes and consequences of the oil shock of 2007-08. Brookings Papers on Economic Activity, Spring 2009(1):215–261.
Hamilton, J. D. and Wu, J. C. (2014). Risk premia in crude oil futures prices. Journal of International Money and Finance, 42(C):9–37.
Harris, L. E. (1994). Minimum price variations, discrete bid–ask spreads, and quotation sizes. The Review of Financial Studies, 7(1):149–178.
Kilian, L. (2016). The impact of the shale oil revolution on US oil and gasoline prices. Review of Environmental Economics and Policy.
Reeve, T. A. and Vigfusson, R. J. (2011). Evaluating the forecasting performance of commodity futures prices. FRB International Finance Discussion Paper, (1025).
U.S. Energy Information Administration (2020). Capacity constraints led to negative WTI prices in Spring 2020. Today in Energy. U.S. Energy Information Administration, accessed May 10, 2026.
Valenti, D., Manera, M., and Sbuelz, A. (2020). Interpreting the oil risk premium: Do oil price shocks matter? Energy Economics, 91:104906.
1. This note has been improved by helpful comments from Burcu Duygan-Bump, Michael Gordy, Eric Engstrom, Emre Yoldas, and Colin Hottman. Any errors or omissions are our own. Return to text
2. New futures contracts are issued monthly. Throughout this analysis we use constant-maturity futures prices interpolated from daily prices on outstanding futures contracts. Return to text
3. Other commonly used liquidity measures include bid-ask spreads and price impact. Bid-ask spreads in crude oil futures are often constrained by minimum tick sizes ($0.01 per barrel), which limits their informativeness about true liquidity conditions – particularly during periods when spreads cluster at this floor (Harris, 1994). Price impact, defined as the effect of order flow on prices, is difficult to measure reliably for longer-dated oil futures contracts due to less frequent trading in these maturities. Market depth, by contrast, reflects the continuous provision of liquidity by market makers and is observable even when transactions are infrequent, making it a more robust indicator of liquidity conditions across the full maturity spectrum. Return to text
4. While the error terms in Equation 1 are assumed to have zero mean, they are likely to be highly correlated over time. Our empirical models account for this by using Newey-West robust standard errors with lags equal to the relevant futures contract maturity. Return to text
5. The weighting function has a half-life of five years, meaning that observations five years prior receive half the weight in our regressions as current observations. Return to text
Heitfield, Erik, Yang-Ho Park, and Erfan Danesh (2026). "Convenience Yields, Risk Premiums, and the Interpretation of Oil Futures Prices During Times of Geopolitical Conflict," FEDS Notes. Washington: Board of Governors of the Federal Reserve System, October 09, 2026, https://doi.org/10.17016/2380-7172.4161 .
Disclaimer: FEDS Notes are articles in which Board staff offer their own views and present analysis on a range of topics in economics and finance. These articles are shorter and less technically oriented than FEDS Working Papers and IFDP papers.