FEDS Notes
September 09, 2022
Credit Card Profitability
Robert Adams, Vitaly M. Bord, and Bradley Katcher
On April 20, 2023, an appendix was added to ease the interpretation of Figures 3A and 3B. The figures in the appendix are monthly versions of Figures 3A and 3B, which show income and expenses per dollar of purchases. There were no changes to the data.
Introduction
Credit cards are one of the most ubiquitous consumer financial products in the United States, with more than 75 percent of households owning at least one general purpose credit card in 2019.1 According to the G.19 Consumer Credit Statistical release, revolving consumer credit, which mainly consists of credit cards and related plans, stood at over one trillion dollars at the end of 2021. Over the past 40 years, the profitability of the credit card industry has received much attention from both academic research and regulatory reports.2 Most of these analyses of credit cards rely on bank-level regulatory data, which allow only the calculation of bank-level profitability, rather than the profitability of just the credit card portfolio.
In this note, we contribute to the analysis of credit card profitability by examining the drivers of profitability. We overcome issues that plagued many of the past analyses by using detailed data on the credit card portfolios of some of the largest credit card lenders. Our analysis focuses on the business model of credit cards from the perspective of both issuers and borrowers. Specifically, we break down profitability based on the two main functions of credit cards: a transaction function and a credit function. The transaction, or payment, function allows the user to purchase goods without using cash, whereas the credit function allows the user to borrow by carrying balances on their credit cards, resulting in interest charges accruing on the account.3
This distinction is important because the main sources of revenue differ for the two functions. The main source of revenue for the transaction function is interchange, which is the network fee paid by the acquiring bank (the merchant's bank) to the issuing bank (the cardholder's bank).4 For the credit function, interest income is the main source of revenue. The last source of credit card revenue is usage fees, including late fees, over-limit fees, foreign exchange fees, and so on. These fees are not directly related to either the credit or transaction functions; instead, these fees pertain to certain aspects of credit card usage, and only some credit card accounts incur these fees.
Using this framework, we decompose credit card profitability into its main sources— the credit function, the transaction function, and fees—and present three main findings. First, we find that, on average, the credit function makes up approximately 80 percent of the credit card profitability, whereas the contribution of the transaction function is slightly negative, as rewards and other expenses on credit card transactions outpace banks' interchange revenues.5 In addition, fees—in particular late fees—comprise approximately 15 percent of credit card profitability.
Second, we show that the net interest margin on revolving balances—that is, balances that are carried from previous months—has been increasing in recent years. At the same time, the net transaction margin (NTM)—that is, the credit card lender's net income on credit card purchases per dollar of purchase volume—has declined due to increasing rewards expenses, which has coincided with increasing credit card spending on rewards cards.
Third, we group credit card customers based on their usage of the transaction and credit functions and find that "revolvers," accounts that carry a balance from month to month, pay the majority of both interest charges and usage fees, including both late and annual fees. This suggests that although fees are not directly related to either the credit or transaction functions of credit cards, in practice, the same accounts that use credit cards for their credit function also end up paying the bulk of credit card usage fees.
Measuring Credit Card Profitability Using the FR Y-14M Data
We begin with an overview of credit card profitability, using two datasets from the Capital Assessments and Stress Testing Report (FR Y-14M) for the time period of January 2014 to December 2021. These data provide detailed information on the credit card operations of stress-tested banking organizations.
The first is a portfolio-level dataset that reports, for each bank, granular monthly information on the balances, revenues, and expenses of the credit card portfolio, including interest income, interchange income, fee income by type of fee, interest expenses, noninterest expenses, and provisions for loan losses. The second is an account-level dataset that provides information on how the account is used, including balances, total purchases made during the month, finance charges, and fees accrued.6 We use a constant sample of 13 banks during our sample period. As the Y-14M data include all of the largest credit card issuers, our sample covers about 80 percent of credit card balances reported in the regulatory Reports of Condition and Income (Call Reports).
Figure 1 presents the quarterly return on credit card assets (in red) using the portfolio dataset. Before the start of the COVID-19 pandemic in March 2020, the return on assets (ROA) was fairly stable, decreasing only slightly from 2014 to 2019. As we will discuss, the sharp decline in early 2020 and subsequent rebound are due to banks' provisioning for credit card losses that did not materialize and subsequent drastic reversals of this provisioning.7 By the end of 2021, the return on credit cards assets reverted closer towards long-term trends.
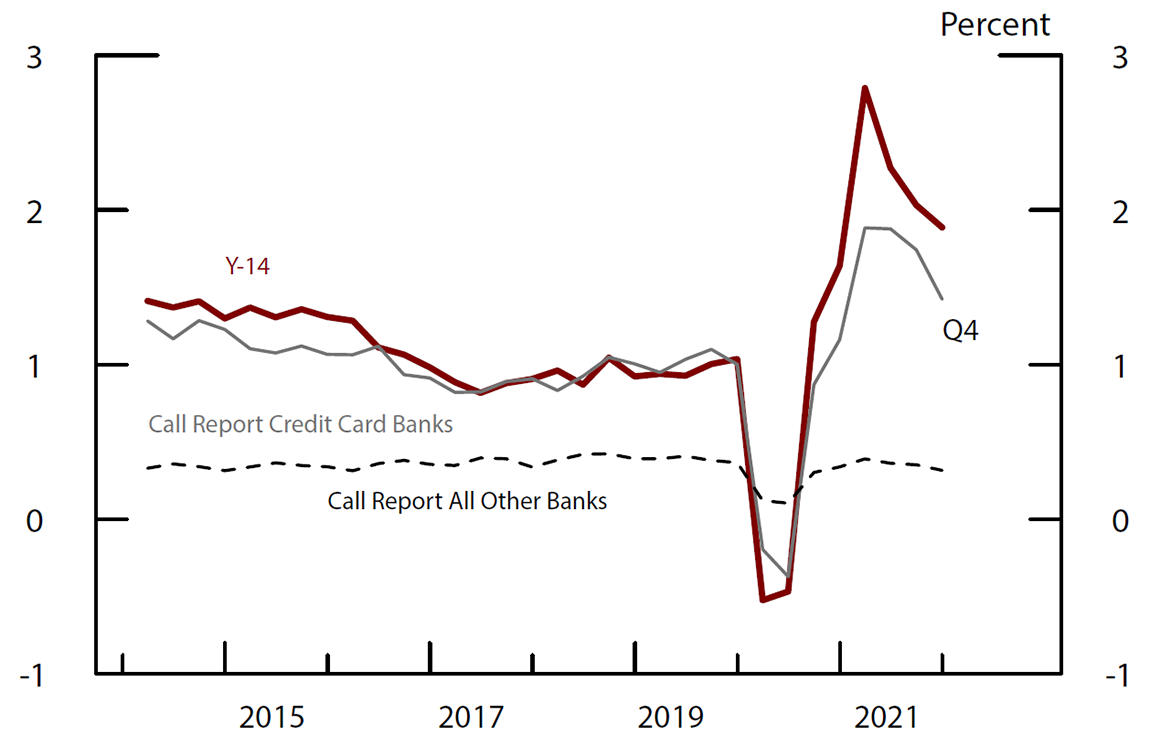
Note: Return on assets for Y-14 is calculated as the sum of interest income and noninterest income minus interest expense, noninterest expense and loan loss provisions, divided by average credit card balances. Y-14 reflects a constant sample of banks. Return on assets for Call Report is calculated as quarterly income divided by average quarterly assets. Prior to 2010, some credit card banks held large portfolios of credit-card-backed securities off-balance-sheet. Therefore, average quarterly assets prior to 2010 include on-balance sheet credit card securitizations.
Source: Call Report and Federal Reserve Board, Form FR Y-14M, Capital Assessments and Stress Testing.
The ROA presented in Figure 1 is a comprehensive measure of the return on credit card portfolios as reported by the largest banks. Previous studies of credit card profitability generally relied on data from the Call Report. For example, the annual reports on credit card profitability issued by the Federal Reserve Board examine Call Report data to calculate the return on assets for a sample of monoline credit card banks, which currently make up less than 40 percent of credit card assets.8 The gray line in Figure 1 plots credit card profitability using the Call Report measure. We find that quarterly average ROA using Y-14 data was about 1.10 percent during the 2014–19 period before the pandemic, while quarterly average credit card bank ROA using Call Report data was 1.03 percent.9 Despite the differences in the sample and data source used, the figure shows that the two measures of profitability are remarkably similar, on average, and follow very similar trends during the sample period. Finally, the dashed gray line in figure 1 reports the profitability of all other banks that file Call Reports, excluding monoline credit card banks.10
The Drivers of Credit Card Profitability
We next decompose the return on credit card assets into several components, corresponding to the different uses of credit cards. To do so, we first note that the ROA on credit card balances is defined as total income on credit card balances minus total expenses. Income includes interest income, as well as non-interest income such as interchange income, annual fees, late fees and other fees. Total expenses include interest expense, loan loss provisioning, and noninterest expense such as collections expense, fraud expense, interchange expense, and rewards expense.
(1) $$ \begin{align} ROA = \frac{{Interest\ Inc}+{Noninterest\ Inc}-{Interest\ Exp}-{Noninterest\ Exp}-{Loan\ Loss\ Provisions}}{Balances} \end{align}$$
In turn, total credit card balances at a given time can be written:
(2) $$ {Balances}(Bal) = {Revolving\ Balances}(RB) + {Purchases}(PV) + {Other}$$
Where $${Revolving\ Balances}$$ are the previous month's balances less any payments, and $${Other}$$ includes balance transfers, prepayments (that is, new purchases that are paid down before the statement closes), finance charges, fees, and any other charges that post to the account. Essentially, equation (2) states that the current month's balances are composed of revolving balances that were carried over from previous months, new purchases, and a small set of other charges.11 Note that balances and revolving balances are stocks, while purchase volume is a flow.
Equations (1) and (2) allow us to subsequently decompose the return on credit card assets into its components, focusing on the two main functions of a credit card. We do so by substituting in for balances in the definition of ROA and making the following assumptions: (1) the interest expense of funding each component of balances is proportional to the share of that component in balances; (2) collections expenses and loan loss provisioning are associated with the credit function of the credit cards, and fraud expenses are associated with the transaction function; and (3) annual fees are part of the income related to the transaction function of credit cards, because they allow customers the opportunity to use the card, and because credit cards with annual fees often have ancillary benefits that increase rewards expenses.
Thus, the return on credit card assets can be decomposed as follows:
(3) $$ \begin{align} {ROA} &= \frac{{Interest\ Inc}+{Noninterest\ Inc}-{Interest\ Exp}-{Noninterest\ Exp}-{Loan\ Loss\ Provisions}}{Balances}\\ &= \frac{{Interest\ Inc} - {Interest\ Exp}\left(\frac{{Rev\ Bal}}{Bal}\right)-{Collections\ Exp} - {Loan\ Loss\ Provisioning}}{{Rev\ Bal}}\left(\frac{{Rev\ Bal}}{Bal}\right)\\ & + \frac{{Interchange\ Inc}+{Annual\ Fees}-{Interchange\ Exp}-{Rewards\ Exp}-{Fraud\ Exp}-{Interest\ Exp}\left(\frac{PV}{Bal}\right)}{PV}\left(\frac{PV}{Bal}\right)\\ & + \frac{{Late\ and\ Other\ Fees}}{Bal} + \frac{Other}{Bal}\\ &= \left({Net\ Credit\ Margin}\right)\left(\frac{{Rev\ Bal}}{Bal}\right) + \left({Net\ Transaction\ Margin}\right)\left(\frac{PV}{Bal}\right) + \frac{Fees}{Bal} + \frac{Other}{Bal} \end{align}$$
The primary component of profitability is net credit margin (NCM), which is the profitability of revolving balances.12 Credit card lenders receive revenues in the form of finance charges borrowers pay and fund the revolving balances with interest expense. On average, the credit function of credit cards—that is, NCM multiplied by the share of balances that are revolving balances—makes up around 80 percent of aggregate credit card profitability.13
The second component of profitability is the net transaction margin (NTM). Credit card lenders receive interchange income and annual fees, which give the consumer the opportunity to use the card, while their expenses include interchange expense and rewards expense. On average, the transaction function of credit cards—that is, NTM multiplied by the share of balances that are purchases— comprises approximately negative 4 percent of aggregate credit card profitability, depending on the quarter.14 The third main component of profitability is late and other fees (excluding annual fees which are part of NTM), which comprise approximately 16 percent of aggregate credit card profitability. The remainder of profitability arises from balance transfers, prepayments, and other miscellaneous factors, as we discuss below.
Figure 2A plots NCM, as well as NCM excluding loan loss provisions. Several points stand out. First, as suggested by the large share of profitability coming from the credit function, NCM trends very similarly to total profitability. In addition, the decline in NCM in the first and second quarters of 2020, the subsequent rebound starting in the third quarter of 2020, and another decline in the second half of 2021 were all solely due to loan loss provisioning. Banks provisioned for large expected losses at the start of the pandemic, and when these losses did not materialize, they drastically decreased credit card provisioning, thus boosting NCM and profitability. Second, whereas NCM was relatively flat before 2020, NCM excluding loan loss provisions was on an increasing trend, suggesting that banks originated credit cards to riskier borrowers who paid higher interest rates.
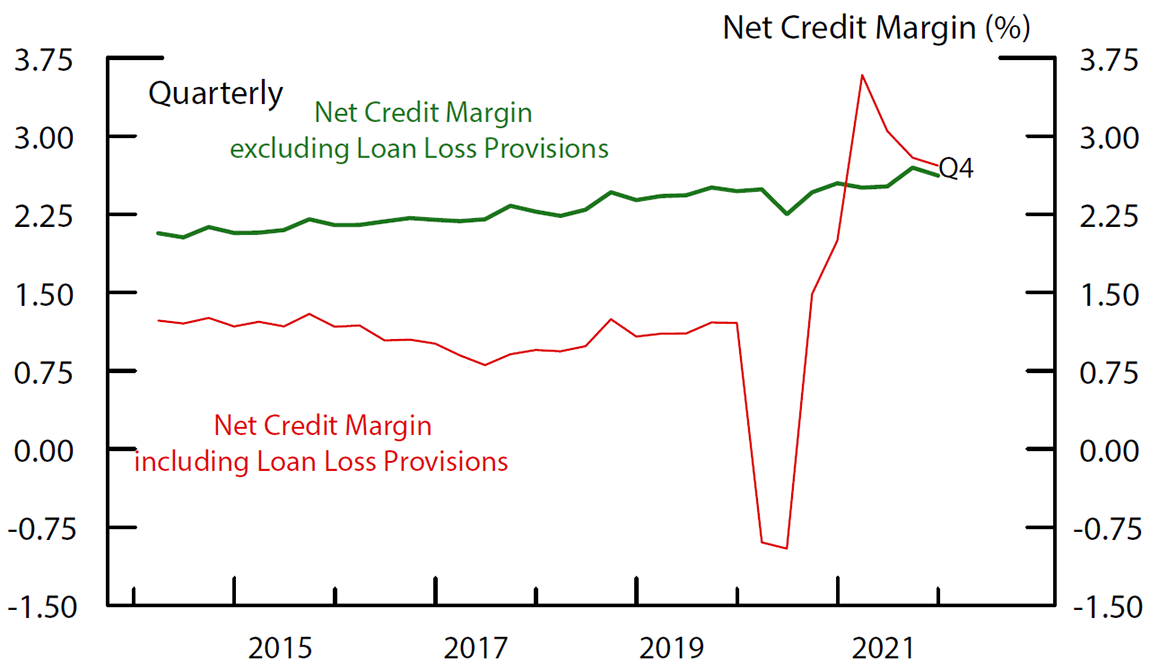
Note: Net credit margin is interest income minus collections expense and the share of interest expense and other non-interest expense attributable to revolving balances divided by revolving balances.
Source: Federal Reserve Board, Form FR Y-14M, Capital Assessments and Stress Testing.
Figure 2B plots revolving balances as a share of total credit card balances. The share of revolving balances is highly seasonal, as revolving balances rise around the winter holidays and subsequently subside. In addition, apart from the effects of the pandemic, the share of revolving balances has generally been decreasing over time. It plummeted in 2021, as borrowers paid down their balances at high rates.
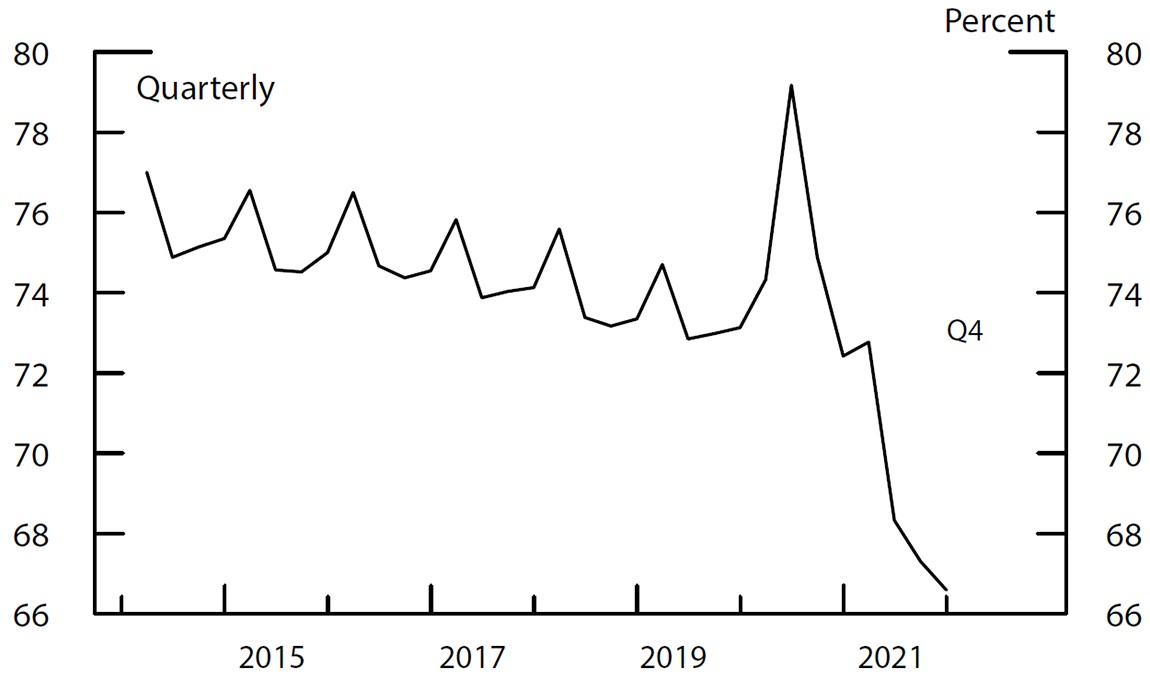
Note: Share balances revolving are revolving balances as a share of balances.
Source: Federal Reserve Board, Form FR Y-14M, Capital Assessments and Stress Testing.
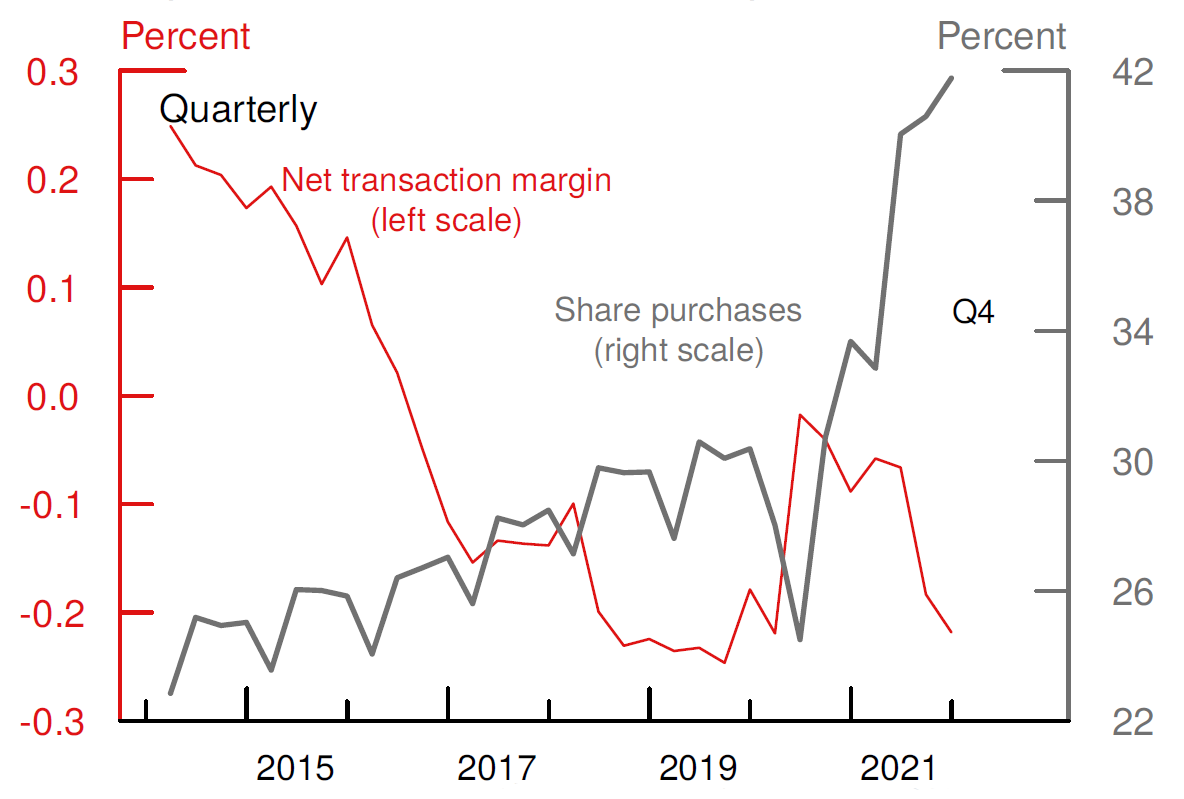
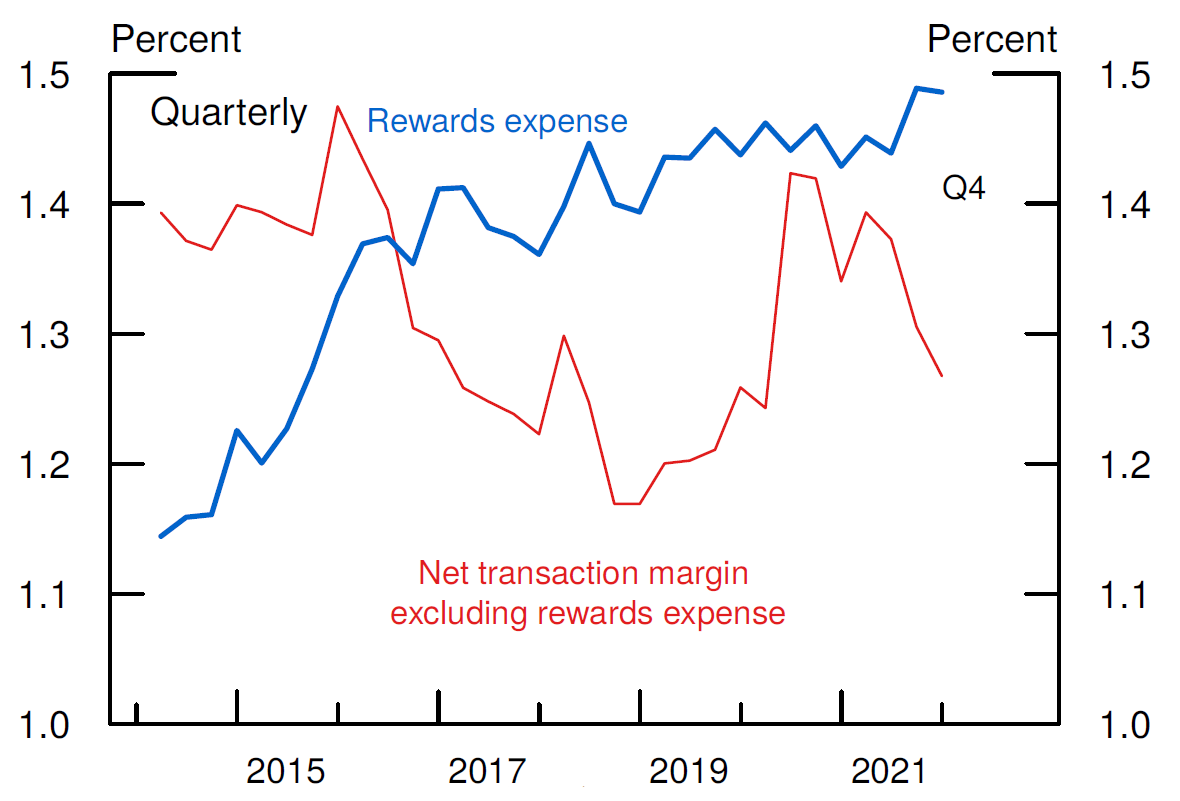
Next, we turn to the NTM. Figure 3A plots NTM on the left axis, in red, and the share of purchases on the right axis, in gray. The share of purchases generally grew steadily during the sample period, apart from a sharp increase in 2021 driven by surging credit card purchase volumes and declining revolving balances. 15 At the same time, NTM declined significantly from 2014 to 2019, dropping from 0.6 to less than negative 0.6 in five years.16 Figure 3B decomposes NTM into rewards expense and the remainder of NTM. As the figure shows, the steady decline in NTM is due in large part to an increase in rewards expenses, which rose from a quarterly average of 3.5 percent in 2015 to around 4.4 percent in 2020, an increase of about 25 percent.
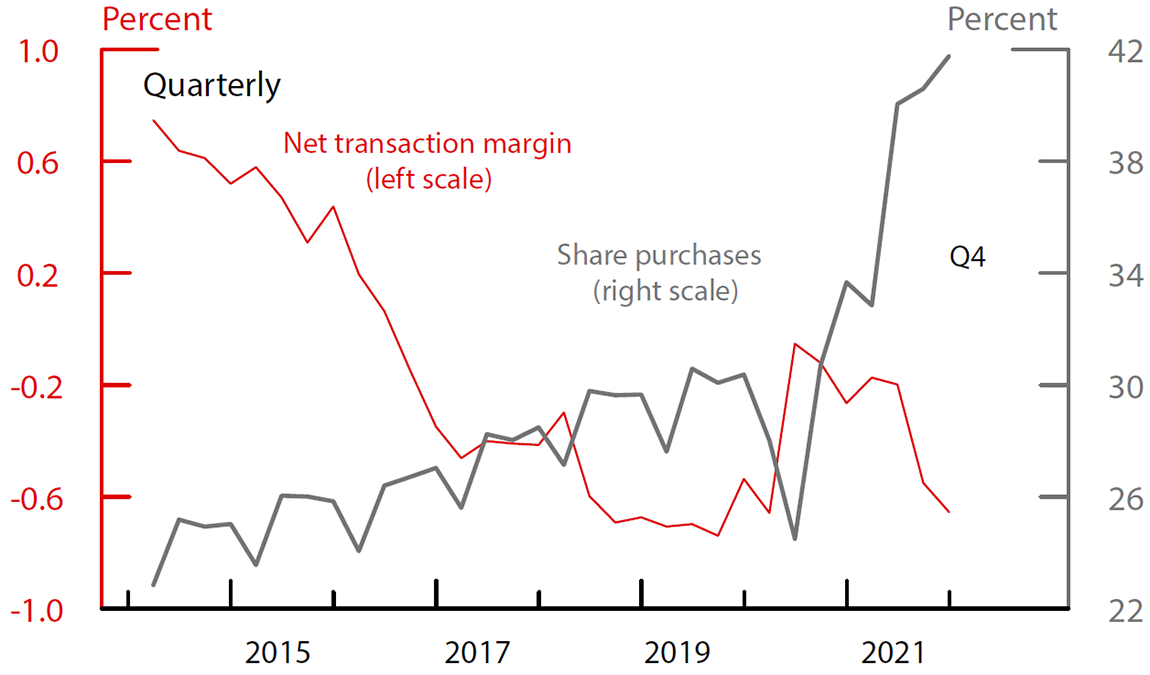
Note: Net transaction margin is interchange income and annual fees minus interchange expense, rewards expense, fraud expense, and the share of interest expense and other non-interest expense attributable to purchase volume divided by purchase volume. Share purchases is purchase volume as a share of balances.
Source: Federal Reserve Board, Form FR Y-14M, Capital Assessments and Stress Testing.
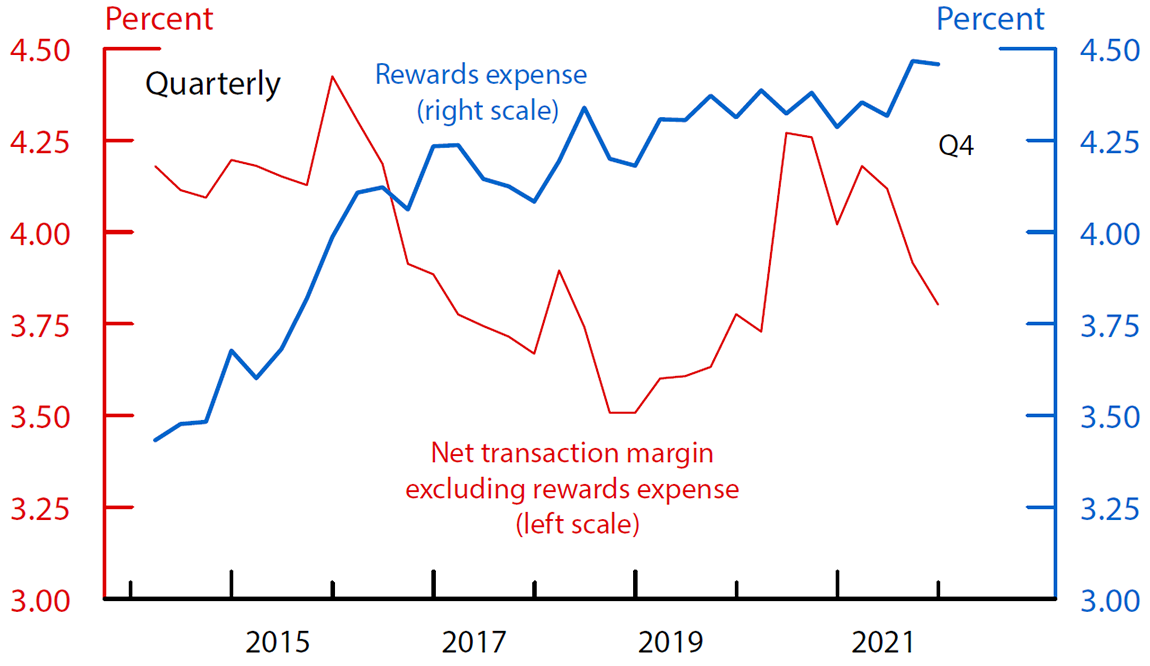
Note: Net transaction margin excluding rewards expense is interchange income and annual fees minus interchange expense, fraud expense, and the share of interest expense and other non-interest expense attributable to purchase volume divided by purchase volume.
Source: Federal Reserve Board, Form FR Y-14M, Capital Assessments and Stress Testing.
Note that to be consistent with equation 3, Figures 3A and 3B show NTM and rewards expenses on a quarterly basis. For ease of interpretation, we include in the Appendix monthly versions of these charts, which show income and expenses per dollar of purchases. Figure B in the Appendix shows that by the end of 2021 net transaction income—before taking out rewards expense—was approximately 1.3 cents per dollar of purchases, and rewards expenses were approximately 1.5 cents per dollar of purchases.
This increase in rewards expenses in recent years is associated with higher usage of rewards cards. In figure 3C, we plot aggregate purchase volume, scaled to 2014:Q1, by the type of rewards the credit card bestows: cash, miles, none, and other (which includes bank points, hotel points, and other noncash rewards). The figure shows that between 2015 and 2019, average purchase volume increased the most for miles and other types of rewards.17 Purchase volume on cards with no rewards grew the least during the period. Note that figure 3C plots total purchase volume, which combines the extensive margin of a borrower applying for new cards with the intensive margin of how much a borrower spends on the card.
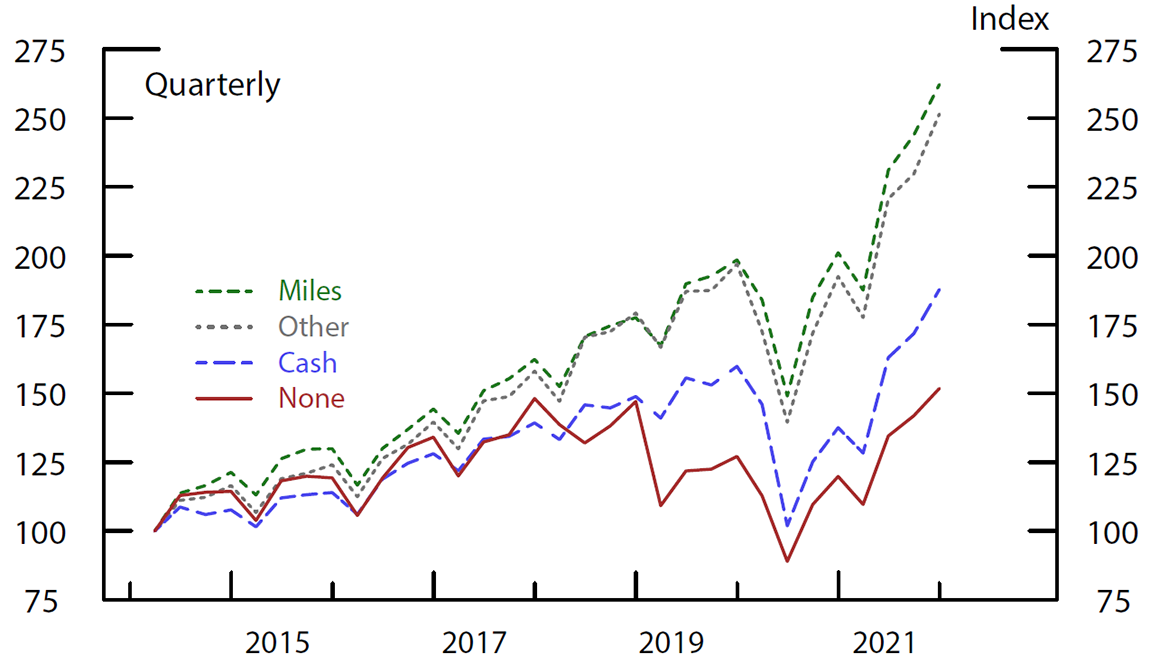
Note: Values are indexed such that Q1 2014 equals 100. Other includes bank points, hotel points, and other non-cash rewards.
Source: Federal Reserve Board, Form FR Y-14M, Capital Assessments and Stress Testing.
Finally, in figure 4, we turn to the last major component of profitability: late and other usage fees (in red). Late and other usage fees include overlimit fees, foreign exchange fees, cash advance fees, and other fees associated with using a credit card. As mentioned before, annual fees are included in NTM.18 On average, late and other fees comprise 16 percent of profitability.19 This makes fees the second largest driver of profitability, after the credit function. The decline in fees starting in 2020:Q2 was due to many lenders implementing fee waivers as part of the pandemic response. The Other component of credit card profitability (in gray), which includes balance transfer income, prepayments, and other miscellaneous factors, increased gradually during the sample period and comprises approximately 7 percent of profitability, on average.20
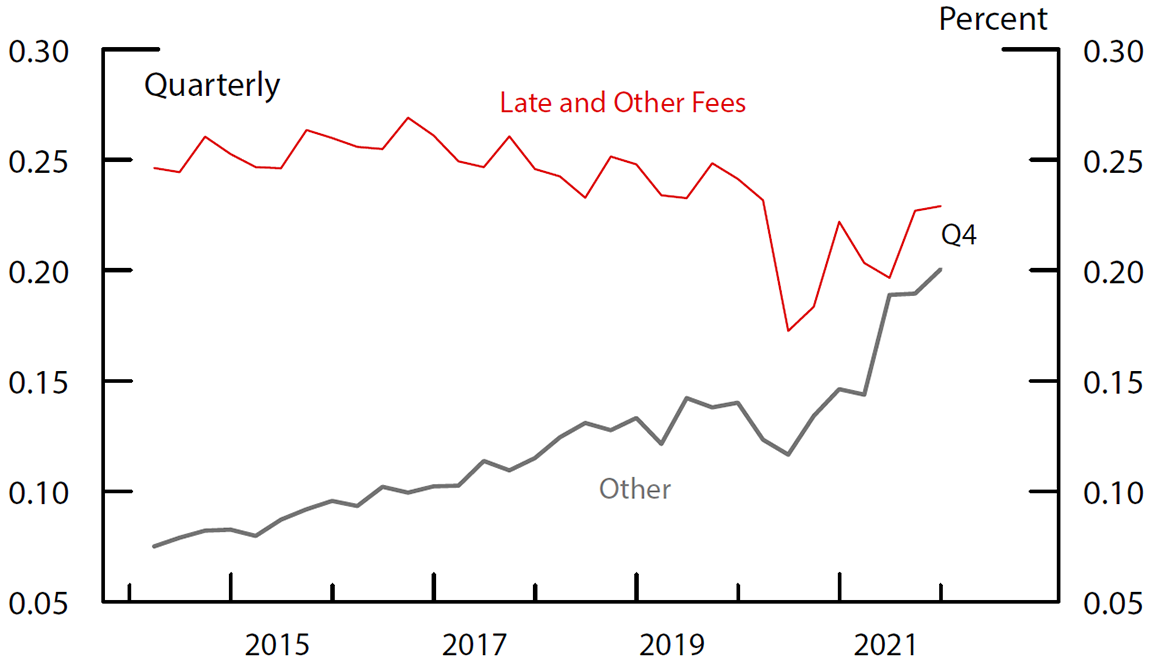
Note: Late and other fees includes late fees, over-limit fees, cash advance fees, non-sufficient funds fees and other fees divided by balances. Other includes miscellaneous remaining components of profitability, including the role of prepayments and balance transfers.
Source: Federal Reserve Board, Form FR Y-14M, Capital Assessments and Stress Testing.
Who Pays Interest Charges and Credit Card Fees?
We next group accounts into revolvers and transactors based on how they use their credit cards. Specifically, we examine the number of times an account had a revolving balance in the preceding 12 months.21 We call accounts with a revolving balance every month in the past 12 months "heavy revolvers," accounts with a revolving balance in 1 to 11 of the past 12 months "light revolvers," and accounts that did not have a revolving balance "transactors." The remaining accounts are either new, and thus do not have the twelve-month history we require, or inactive and have not had a balance or made any purchases in six months.
Table 1 presents summary statistics by the different types of accounts during the 2014–19 period.22 In all, revolvers comprise almost half of all accounts, with about 20 percent as heavy revolvers and 25 percent as light revolvers. Transactors comprise 21 percent of accounts. Of the remaining 32 percent of accounts, half are inactive, and half do not have a twelve-month history. As discussed in Adams and Bord (2020), credit scores and income are decreasing in revolving behavior; on average, heavy revolvers tend to have lower credit scores and income than light revolvers who tend to have lower credit scores and income than transactors.
Table 1. Costs of Using a Credit Card
| Variable: | Heavy Revolver | Light Revolver | Transactor | Other | ||||
|---|---|---|---|---|---|---|---|---|
| Mean | Share (%) | Mean | Share (%) | Mean | Share (%) | Mean | Share (%) | |
| Number of Accounts (in millions) | 63.1 | 20.33 | 79.02 | 25.47 | 66.62 | 21.47 | 97.72 | 32.73 |
| Purchase Volume | 205.7 | 9.25 | 636.81 | 35.68 | 825.59 | 39.11 | 241.07 | 15.96 |
| Balance | 4417.75 | 52.8 | 1719.75 | 25.66 | 766.83 | 9.65 | 700.56 | 11.89 |
| Revolving Balance | 4121 | 67.18 | 1072.72 | 21.85 | 27.27 | 0.47 | 459.58 | 10.55 |
| Spread | 14.97 | --- | 14.1 | --- | 12.3 | --- | 14.33 | --- |
| Interest Charge | 60.5 | 72.18 | 14.09 | 20.81 | 0.55 | 0.7 | 3.98 | 6.31 |
| Late Fee | 3.05 | 47.59 | 1.47 | 28.83 | 0.32 | 5.19 | 0.79 | 18.39 |
| Annual Fee | 0.94 | 19.77 | 1.45 | 36.68 | 1.36 | 28.82 | 0.5 | 14.73 |
| Other Fee | 1.24 | 26.82 | 1.46 | 39.65 | 0.6 | 13.85 | 0.62 | 19.68 |
As expected, heavy revolvers use their cards less for purchases than light revolvers or transactors, with the average heavy revolver spending just $200 a month on their credit card. The average light revolver (transactor) spends $640 ($825). In all, transactors account for 40 percent of credit card purchases, light revolvers account for 35 percent, and heavy revolvers account for less than 10 percent. The average heavy revolver has an end of statement balance of almost $4,500, of which more than $4,100 is revolving balance. By contrast, the average light revolver (transactor) has a balance of about $1,700 ($750), of which almost $1,000 (0) is revolving balance. In all, more than 50 percent of total balances and about two-thirds of total revolving balances are held by heavy revolvers. Light revolvers hold about 22 percent of total revolving balances.23
The bottom half of Table 1 examines how the costs of using a credit card vary with account usage type. The average heavy revolver pays more than $60 per month in interest charges, and more than 70 percent of all interest is paid by heavy revolvers. Light revolvers pay $15 of interest a month, making up about 20 percent of all interest. Similarly, heavy and light revolvers pay almost 50 percent and 30 percent of all late fees, respectively. By comparison, a higher burden of annual and other fees falls on transactors and light revolvers. Transactors pay almost 30 percent of all annual fees, whereas light revolvers pay 37 percent and heavy revolvers pay less than 20 percent.24 Nevertheless, the majority of annual fees are paid by revolver accounts. The summary statistics are broadly consistent with previous survey-based evidence of the costs of credit cards (for example, Stango and Zinman, 2009) and the biannual report on the credit card market issued by the Consumer Financial Protection Bureau.25
It is notable that heavy and light revolvers pay not only the bulk of interest charges, but also the majority of credit card usage fees. Although usage fees are distinct from both the credit and transaction functions of credit cards, in practice, they appear to be paid mainly by the same accounts that use credit cards for their credit function. Since the credit function of credit cards comprises approximately 80 percent of profitability and fees comprise most of the remaining 20 percent, this suggests that the majority of credit card revenues are paid by revolvers.
References
Adams, Robert M., and Vitaly M. Bord (2020). "The Effects of the COVID-19 Shutdown on the Consumer Credit Card Market: Revolvers versus Transactors," FEDS Notes. Washington: Board of Governors of the Federal Reserve System, October 21, 2020.
Adams, Robert M., Vitaly M. Bord, and Bradley Katcher (2021). "Why Did Credit Card Balances Decline so Much during the COVID-19 Pandemic?," FEDS Notes. Washington: Board of Governors of the Federal Reserve System, December 03, 2021.
Agarwal, Sumit, Souphala Chomsisengphet, Neale Mahoney, and Johannes Stroebel (2015). "Regulating Consumer Financial Products: Evidence from Credit Cards," Quarterly Journal of Economics, vol. 130 (February), pp.111–64.
Ausubel, Lawrence M. (1991). "The Failure of Competition in the Credit Card Market," American Economic Review, vol. 81 (March), pp. 50–81.
Gathergood, John, Neale Mahoney, Neil Stewart, and Jorg Weber (2019). "How Do Individuals Repay Their Debt? The Balance-Matching Heuristic," American Economic Review, vol. 109 (March), pp. 844–75.
Grodzicki, Daniel, and Sergei Koulayev (2021). "Sustained Credit Card Borrowing," Journal of Consumer Affairs, vol. 55 (Summer), pp. 622–53.
Gross, David B., and Nicholas S. Souleles (2002). "Do Liquidity Constraints and Interest Rates Matter for Consumer Behavior? Evidence from Credit Card Data," Quarterly Journal of Economics, vol. 117 (February), pp. 149–85.
Ponce, Alejandro, Enrique Seira, and Guillermo Zamarripa (2017). "Borrowing on the Wrong Credit Card? Evidence from Mexico," American Economic Review, vol. 107 (April), pp. 1335–61.
Stango, Victor, and Jonathan Zinman (2009). "What Do Consumers Really Pay on Their Checking and Credit Card Accounts? Explicit, Implicit, and Avoidable Costs," American Economic Review, vol. 99 (May), pp. 424–29.
Stango, Victor, and Jonathan Zinman (2016), "Borrowing High versus Borrowing Higher: Price Dispersion and Shopping Behavior in the U.S. Credit Card Market," Review of Financial Studies, vol. 29 (April), pp. 979–1006.
Appendix
Note: Net transaction margin is interchange income and annual fees minus interchange expense, rewards expense, fraud expense, and the share of interest expense and other non-interest expense attributable to purchase volume divided by purchase volume. Share purchases is purchase volume as a share of balances. Because purchase volume is a flow, both NTM and the share purchases are calculated using averages of the variables' monthly values.
Source: Federal Reserve Board, Form FR Y-14M, Capital Assessments and Stress Testing.
Note: Net transaction margin excluding rewards expense is interchange income and annual fees minus interchange expense, fraud expense, and the share of interest expense and other non-interest expense attributable to purchase volume divided by purchase volume. Because purchase volume is a flow, both NTM and the rewards expense are calculated using averages of the variables' monthly values.
Source: Federal Reserve Board, Form FR Y-14M, Capital Assessments and Stress Testing.
1. The estimate is based on data from the 2019 Survey of Consumer Finances. This figure only includes general purpose credit cards and excludes charge cards and private-label cards. Return to text
2. The Federal Reserve Board produces an annual report on the profitability of depository institutions' credit card operations, and the Consumer Financial Protection Bureau produces a biannual report that details many aspects of the consumer credit card market, including the cost of credit cards. A large academic literature, starting with Ausubel (1991), also seeks to explain the prevalence of high and steady credit card interest rates. Much of this literature has focused on liquidity constraints as well as biases and lack of optimization by credit card borrowers. See, for example, Gross and Souleles (2002); Gathergood et. al. (2019); Ponce, Seira, and Zamarripa (2017); and Stango and Zinman (2016). Return to text
3. Our study is closely linked to Agarwal et al (2015), who use account and portfolio data from Credit Card Metrics data assembled by the OCC. While minor differences exist in how interchange and rewards expenses are calculated, Agarwal et al (2015) mainly focus on profitability measures over the spectrum of FICO scores. They also focus on the cost to the consumer rather than bank profitability. Return to text
4. Because our data focus on issuing banks, we do not have information on revenues from merchant discounts, which are the prices banks charge merchants to process credit card transactions. These prices are typically some markup over interchange. Interchange from American Express and Discover more closely aligns with the merchant discount, as both have a more integrated business model with a single major issuer and acquirer (only a small percent of cards is issued by other banks on these networks). Return to text
5. The transaction function contributes negatively to profitability in recent years due to high rewards expenses, as we discuss below. Return to text
6. For computational simplicity, we use a 1 percent random sample of the account-level data, which corresponds to about 3 million accounts, and almost 280 million observations, for the January 2014 to December 2021 period. Return to text
7. The pandemic also coincided with the largest banks implementing the current expected credit loss methodology (CECL) as of January 2020. Part of the trend in provisioning might be attributed to this change. For more information, see the July 2021 Report to the Congress on the Profitability of Credit Card Operations of Depository Institutions, which is available at https://www.federalreserve.gov/publications/files/ccprofit2021.pdf. Return to text
8. Credit card banks are defined as banks with more than $200 million in assets that have at least 50 percent of assets as consumer loans and at least 90 percent of their consumer loans are credit card loans or related plans. For more information, see the July 2022 Report to the Congress on the Profitability of Credit Card Operations of Depository Institutions, which is available at https://www.federalreserve.gov/publications/files/ccprofit2022.pdf. Return to text
9. This is in-line with other estimates, such as Agarwal et al (2015). Return to text
10. As first discussed by Ausubel (1991) and noted by Agarwal et al (2015), among others, credit card bank profitability is significantly higher than the return on other banking activities. Although our Y-14M data start in 2014, extending the Call Report data to prior years shows that credit card profitability is also more volatile than the profitability of other banks. Return to text
11. Previous literature such as Agarwal et al (2015) uses average daily balances (ADB) to measure how much a credit card user who pays finance charges borrows. Credit card lenders use ADB when calculating interest charges. We use revolving balances to more easily decompose total balances as in equation (2), since both balances and revolving balances are snapshots at a single point in time. The correlation between revolving balances and ADB is more than 0.99. Return to text
12. Both NCM and NTM are measures of the average amount earned per dollar (of revolving balances or purchases), rather than the marginal amount earned per dollar. Return to text
13. NCM ranged from 65 percent to 92 percent of ROA during the 2014-2021 period. Return to text
14. NTM ranged from negative 20 percent to positive 12 percent of ROA during the 2014-2021 period. Return to text
15. The decline in the share of purchases in 2020 was the result of households drastically cutting spending due to the COVID-19 pandemic. The subsequent rebound in share purchases followed as spending recovered while revolving balances continued to decline. Return to text
16. The short-term rebound in NTM in 2020 is mainly driven by the decline in interest expense due to a fall in interest rates. As transaction volume began to increase in mid-2021, NTM declined to approximately its pre-pandemic levels. Return to text
17. More than 47 percent of credit card customers who switched to a new card over the past 12 months did so for a better rewards program; see https://www.jdpower.com/system/files/legacy/assets/2018135_u.s._credit_card_study_v2.pdf. Return to text
18. Balance transfer fees are included in the Other component of profitability. Return to text
19. Late and other fees ranged from 7 percent to 28 percent of ROA during the 2014-2021 period. Transfers, which are included in the Other component of profitability make up 2 percent of ROA on average, with a range of 1 to 4 percent, depending on the quarter. Return to text
20. The increase in the Other component in 2021 is driven in part by prepayments, which are credit card purchases paid down prior to the statement close. Higher prepayments increase credit card profitability because the lender receives interchange income on the purchases, but since they are paid down soon, does not need fund them for long. See Adams, Bord, and Katcher (2021) for more on the role of prepayments. Return to text
21. We exclude instances of revolving due to a forgotten payment. For example, if a borrower does not make a payment before the due date but subsequently pays off the entire balance, we do not count this as an instance of revolving. Return to text
22. We use the 2014–19 period to avoid contaminating our results with pandemic-related changes in usage. Return to text
23. See Adams and Bord (2020) and Grodzicki and Koulayev (2021) for more information on the differences between revolvers and transactors. Return to text
24. Note that annual fees are expressed as a monthly charge, to be consistent with finance charges and other fees. Return to text
25. The latest report is The Consumer Credit Card Market from September 2021 and is available at https://files.consumerfinance.gov/f/documents/cfpb_consumer-credit-card-market-report_2021.pdf Return to text
Adams, Robert,Vitaly M. Bord, and Bradley Katcher (2022). "Credit Card Profitability," FEDS Notes. Washington: Board of Governors of the Federal Reserve System, September 09, 2022, https://doi.org/10.17016/2380-7172.3100.
Disclaimer: FEDS Notes are articles in which Board staff offer their own views and present analysis on a range of topics in economics and finance. These articles are shorter and less technically oriented than FEDS Working Papers and IFDP papers.