FEDS Notes
November 26, 2021
Credit Portfolio Convergence in U.S. Banks since the COVID-19 Shock
Introduction
The COVID-19 pandemic has materially affected U.S. consumer behavior and business operations in many important aspects. This note focuses on the changes in banks' balance sheets and demonstrates how we could apply a novel measure of portfolio similarity to balance sheet data and assess the drivers of similarity change along the path of the pandemic.
Specifically, the note examines changes in the credit portfolio allocation of banks since the COVID-19 shock and reports the evolution of portfolio similarities across banks. Applying data from the Federal Reserve Board's Form FR Y-9C Consolidated Financial Statements for Bank Holding Companies (Y-9C) and classifying banks' assets according to credit risk exposure types and regulatory risk weights, we calculate "cosine similarity" of the credit assets for banks of comparable sizes. In the context of our asset classification, we find that the similarity measure increased since the first quarter of 2020, indicating growing convergence in banks' credit allocation since the COVID-19 shock.
More interestingly, the reasons behind the convergence vary for banks of different size. In particular, the rise of similarity among large banks is mainly contributed by the increase in assets with near-zero risk weights, such as Treasury holdings as well as cash and deposits in Federal Reserve Banks. By contrast, the increase in similarity among small banks is mainly due to the increase in commercial and industrial (C&I) loans to U.S. domestic companies, with the timing of the rise coinciding with the Paycheck Protection Program (PPP) lending. Our analysis supplements the literature on the effects of the COVID-19 on bank behavior by providing a new angle and highlighting the importance of banks' pre-pandemic differences in analyzing the changes.
Data and Methodology
Concerns on correlation risk among banks have risen in recent years in evaluating post–Global Financial Crisis financial regulations (for example, discussions in Greenwood and others, 2017; Bräuning and Fillat, 2019; Hoshi and Wang, 2021). In those ongoing discussions, the same regulatory environment and tightening capital requirements may push banks to adopt similar business models that could increase systemic risk. Hoshi and Wang (2021) document an upward trend in the similarity among the ten largest U.S. bank holding companies (BHCs) in terms of their credit portfolio allocation during the 2010–15 period.
In this note, we use the same cosine similarity measure as in Hoshi and Wang (2021).2 Instead of using data from the Federal Financial Institutions Examination Council's Form FFIEC 101 (Regulatory Capital Reporting for Institutions Subject to the Advanced Capital Adequacy Framework) as in that paper, we switch to FR Y-9C data, which enables us to enlarge the sample to include all Y-9C reporters with total assets greater than $10 billion (as of March 2018). To characterize the portfolio allocation of each BHC's credit risk exposure, we classify its credit assets into 12 categories: sovereign; corporate; retail; bank; residential real estate; income-producing residential real estate; commercial real estate; income-producing commercial real estate; equity; high-volatility commercial real estate; securitization; and other exposures. This classification largely matches credit asset classification in FFIEC101 reports and is also consistent with the risk-based capital framework in Basel Accords.3 The mapping of each category to Y-9C report items is given in table A1 in the appendix.
Cosine Similarity
Cosine similarity between portfolios for a pair of banks ($$i$$, $$j$$) can be defined as follows:
$$$$ \mathrm{Cos}\ {BAL}(i,j) = \frac{\sum_k ( {BAL\%}(i,k) * {BAL}\%(j,k) ) }{\sqrt{\sum_k({BAL\%}(i,k))^2}\sqrt{\sum_k({BAL\%}(j,k))^2}}, $$$$
where $${BAL\%}(i,k)$$ stands for the percentage share of balance sheet exposure in asset class $$k$$ among the total credit portfolio exposure for bank $$i$$. Cosine similarity equals zero when the pair of banks have no common asset classes—that is, either $${BAL\%}(i,k)$$ or $${BAL\%}(j,k)$$ equals zero for all asset classes $$k$$ and equals one when banks have identical portfolio allocations across all asset classes. Otherwise, the measure is somewhere between zero and one, with higher values indicating a higher degree of similarity between the portfolios of two banks. In contrast to other similarity measures used in the banking literature, this measure is scale independent—that is, it measures only the directional closeness of the asset portfolios between two banking organizations regardless of bank size.
We apply this formula on cosine similarity to the 12 asset classes in table 1 for pairs of banks belonging to three size groups. The grouping of banks is based on total assets of BHCs in the consolidated Y-9C report as of March 2018, with groups denoted as follows:
- Large firms comprise 13 BHCs with total assets greater than $250 billion.
- Small firms comprise 79 BHCs with total assets between $10 billion and $100 billion.
- Midsize firms comprise 20 BHCs with total assets between $100 billion and $250 billion.4
For each group, pairwise cosine similarities are calculated first for all possible pairs and the simple average is returned as the cosine similarity for the specific group. We examine the evolution of the group-averaged cosine similarities since 2018 in the next section.
Table 1. Average Credit Portfolio Allocations in Banks, 2018 versus 2020
(“Percent”)
| Asset Category | Year | Small Firms | Midsize Firms | Large Firms |
|---|---|---|---|---|
| Sovereign | 2018 | 23.57 | 21.95 | 36.61 |
| 2020 | 25.11 | 27.56 | 43.09 | |
| Corporate | 2018 | 18.83 | 19.89 | 16.7 |
| 2020 | 21.29 | 19.39 | 16.55 | |
| Retail | 2018 | 7.52 | 18.71 | 10.37 |
| 2020 | 6.64 | 18.35 | 8.7 | |
| Bank | 2018 | 1.29 | 2.63 | 2.8 |
| 2020 | 1.54 | 2.73 | 2.32 | |
| Residential Real Estate (RRE) | 2018 | 14.41 | 13.51 | 13.02 |
| 2020 | 13.07 | 10.43 | 10.84 | |
| Income-Producing RRE | 2018 | 4.99 | 1.32 | 1.3 |
| 2020 | 4.75 | 1.43 | 1.24 | |
| Commercial Real Estate (CRE) | 2018 | 6.87 | 3.01 | 1.05 |
| 2020 | 5.67 | 2.09 | 0.84 | |
| Income-Producing CRE | 2018 | 10.11 | 3.22 | 2.2 |
| 2020 | 9.64 | 2.78 | 1.97 | |
| High-Volatility CRE | 2018 | 3.74 | 1.74 | 0.77 |
| 2020 | 0.7 | 1.24 | 0.85 | |
| Equity | 2018 | 0.8 | 0.93 | 0.85 |
| 2020 | 1.04 | 1.35 | 4.07 | |
| Securitization | 2018 | 0.99 | 1.31 | 4.3 |
| 2020 | 3.61 | 1.4 | 0.64 | |
| Other | 2018 | 6.87 | 11.77 | 10.04 |
| 2020 | 6.95 | 11.26 | 8.9 |
Note: The percentage in the table represents the share of each asset class to the total sum of these assets, averaged across banks within each bank group. Two quarter-end data are presented in the table: 2018:Q1 and 2020:Q2.
Source: Staff calculations based on public data from Federal Reserve Board, Form FR Y-9C, Consolidated Financial Statements for Bank Holding Companies.
Changes in Cosine Similarity Following March 2020 Turmoil
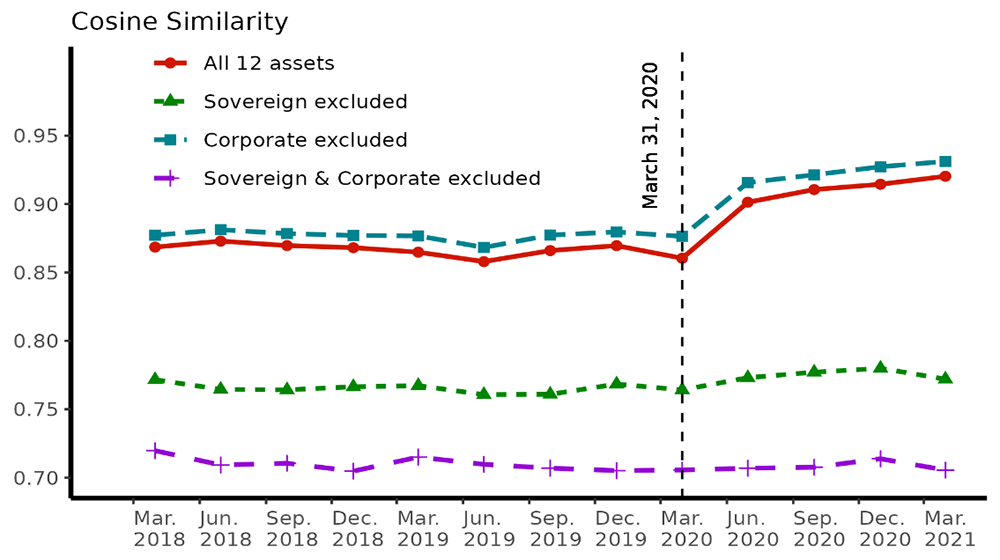
There are noticeable increases in the cosine similarities across all three bank groups since March 2020 (figure 1). When we decompose the changes to experiment the impact of each asset class, we find that the drivers for the changes vary widely based upon bank size, revealing some interesting patterns on how banks of different size diverged in response to the COVID-19 shock and its policy consequences.
Panel A. Large Firms
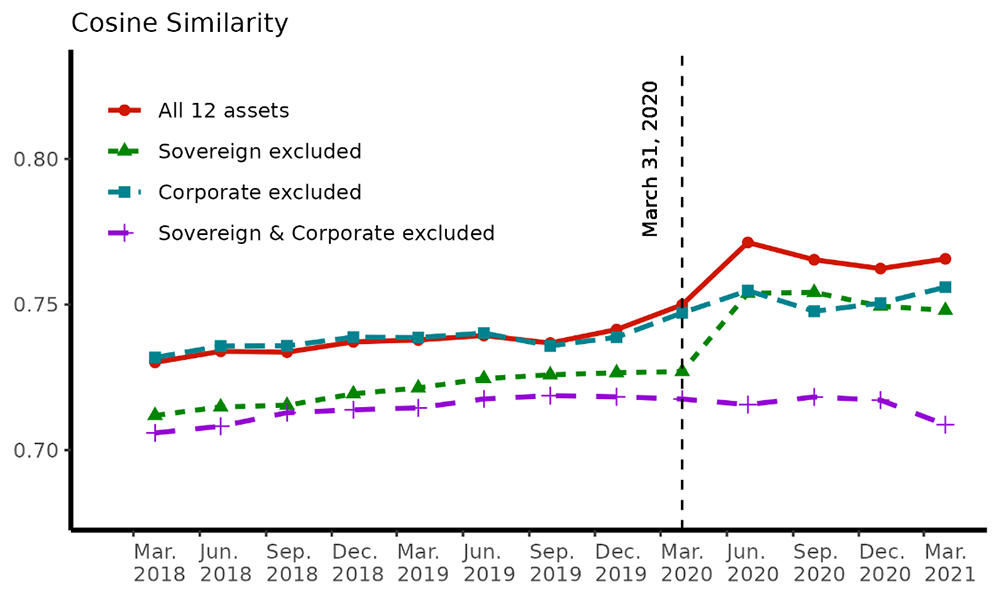
Panel B. Small Firms
Panel C. Midsize Firms
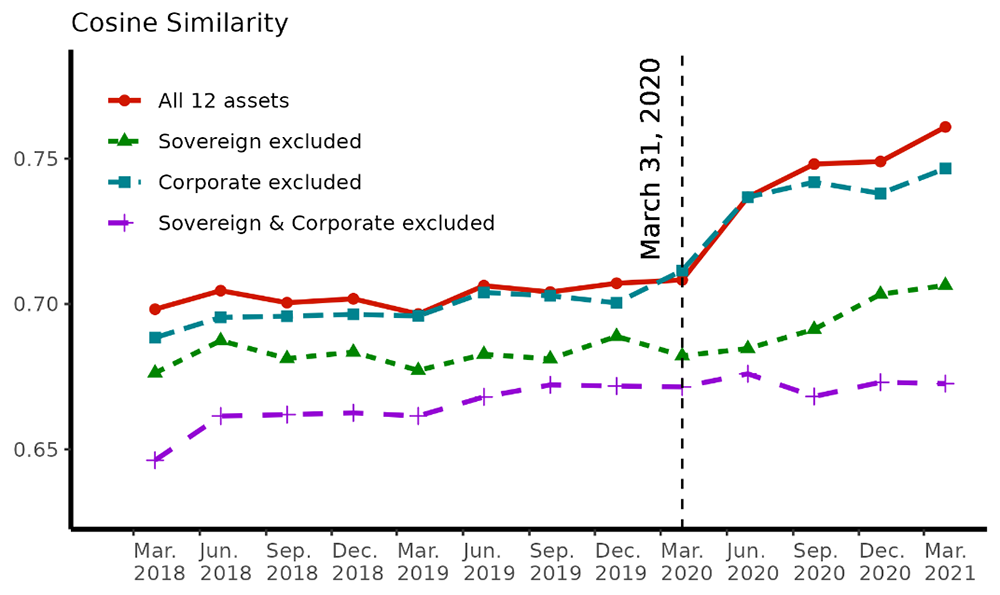
Note: This figure shows average cosine similarity for each bank group. Each panel represents a specific bank group by size.
Source: Staff calculations based on public data from Federal Reserve Board, Form FR Y-9C, Consolidated Financial Statements for Bank Holding Companies.
Large Firms: A Story of Sovereign Exposures
Before the COVID-19 crisis, large firms were the most similar out of the three groups according to the cosine similarity measure. For them, the average cosine similarity appears to be stagnant around 0.88 before 2020, but there is a noticeable jump in the quarter immediately following the COVID-19 crisis (panel A of figure 1). Cosine similarity continued to rise throughout 2020 even as measures of market stress and systemic risk appear to dissipate. Upon further examination, the clear cause of this increase is the massive increase in sovereign balance sheet exposures, as we define in table A1. If sovereign exposures are removed from the cosine similarity calculation, there is nearly no change in similarity over the entire period from 2018 to 2021 for large firms. Additionally, the level of cosine similarity on each date is noticeably lower (around 0.78) when sovereign exposures are removed.
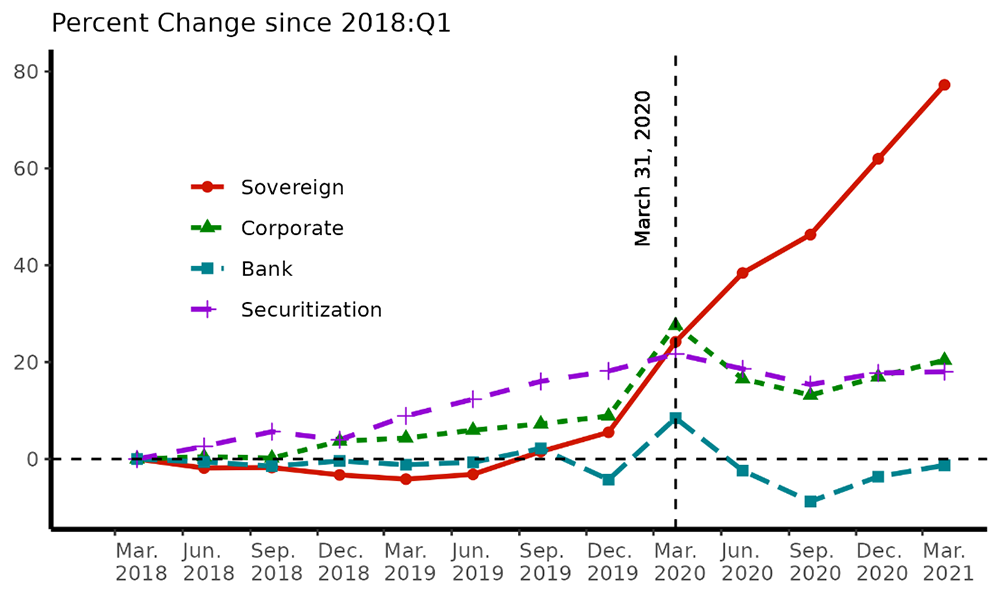
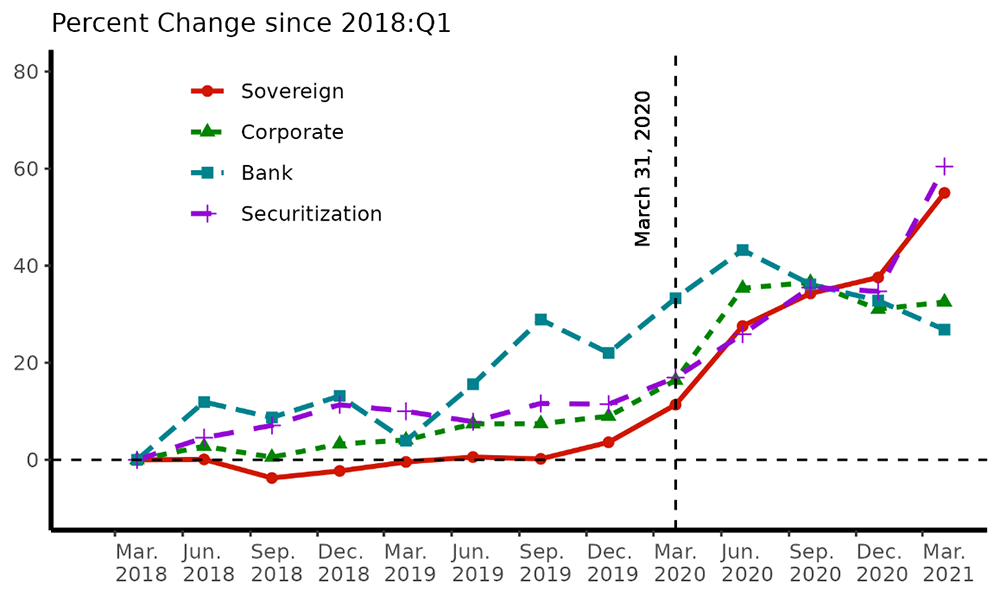
This finding leads us to examine the exposure changes in major asset classes for these bank groups. Figure 2 plots their aggregate percentage change of exposure since the first quarter of 2018 in four asset classes: sovereign, corporate, bank, and securitization. For the large firms, from March 2018 to December 2019, sovereign exposures increased by only about 5 percent. Just one quarter later, that number rose to 24 percent. Sovereign exposures continued to rise, and, by the end of 2020, sovereign exposures had increased by nearly 60 percent since 2018 (panel A of figure 2). Furthermore, the increase in sovereign exposures is unique compared with other asset classes. The two asset classes that have the next largest changes since 2018 are the bank and securitization exposures. These exposures changed quite similarly and did not have nearly as large the increase as seen in sovereign exposures.
The combination of a huge increase in sovereign exposures for large firms, coupled with the noticeable increase in cosine similarity only when including sovereign exposures, implies that there was a collective increase in sovereign exposures across large firms following the pandemic. Furthermore, this behavior was not only an immediate response to the pandemic, but also a behavior that is still ongoing, which may reflect continued uncertainty from the COVID-19 shock.
Small Firms: Corporate Lending
Although the overall level of similarity was lower for small firms, the change in cosine similarity from 2018 to 2021 was very similar to the pattern observed with large firms. Much like the large firms, cosine similarity among the small firms remained relatively constant around 0.74 before 2020. In the second quarter of 2020, there was about a 0.025 increase in similarity. The increase was not as large, and there did not appear the same lingering effect, as was seen with the large firms (0.04 increase in the second quarter of 2020). Cosine similarity for small firms did not revert to 2019 levels, but it did not continue to increase after 2020 either.
However, the key difference between the small and large firms is the underlying cause of the increase in similarity. First, sovereign exposures do not appear to be the main driver for the increase in small firms. Removing sovereign exposures from the cosine similarity calculation has a much smaller effect for the small firms compared with the large firms (panel B of figure 1). There is still a jump in cosine similarity for small firms when sovereign exposures are removed. In addition, exposure changes in figure 2 (panel B) show that the increase in small firms' sovereign exposures is significantly less pronounced than that of large firms. From 2018 to 2020, the aggregate sovereign assets increase 62.0 percent for large firms and 37.6 percent for small firms. The change in sovereign exposures is very similar to the increase in some other exposures for small firms.
Second, by comparing the cosine similarity with and without corporate exposures, we find that the corporate exposures played a significant role in rising cosine similarity among small firms during and after the COVID-19 crisis. In panel B of figure 1, we show that for small firms, cosine similarities with and without corporate exposures are almost identical before March 2020. However, since March 2020, cosine similarity with corporate exposures spiked quite significantly, while the calculation without corporate exposure does not increase nearly as significantly. There continues to be a large difference between cosine similarity with and without corporate exposure assets that continues into 2021. Because the calculation without corporate exposures is noticeably lower than the calculation with corporate exposures, it would imply that corporate exposure drove cosine similarity and small banks had similar behavior regarding their corporate exposures.
By removing both corporate and sovereign exposures in the cosine similarity calculation, we find almost no increase in cosine similarity after March 2020 for this group, implying that sovereign exposures also increased cosine similarly for small firms but not nearly to the same degree as for large firms, for small firms' sovereign assets made up only 23.3 percent of total exposure compared with 36.6 percent for large firms in the first quarter of 2018 (table 1). By the end of 2020, sovereign exposure made up 26.6 percent of total exposure for small firms and 47.1 percent of exposure for large firms. Although sovereign assets increased significantly in aggregate for small firms (panel B of figure 2), many other asset classes saw large increases as well, while the same cannot be said for large firms. Sovereign assets do increase cosine similarity among small firms, but the change in sovereign assets is proportional to other types of exposures. Therefore, the effect is muted.
Midsize Firms: A Hybrid Model
Midsize firms behave partly as large firms and partly as small firms. Figure 2, panel C, shows that their exposure changes over the COVID-19 period mimic more closely those of large firms than those of small firms. In particular, the sovereign exposures grew fastest among all asset classes in midsize firms as well, which is the same for large firms. However, figure 1, panel C, shows that the drivers for cosine similarity change in midsize firms need to be attributed to both sovereign exposures and corporate exposures. Excluding either of the exposures will not eliminate the jump in cosine similarity among midsize firms from the first quarter to the second quarter of 2020. The pattern of changes after the second quarter of 2020 in midsize firms is closer to small firms than to large firms.
It might be also interesting to note that among the three bank groups, midsize firms have the lowest average cosine similarity (around 0.70 before 2020). Unsurprisingly, some of the larger banks in this group behave similarly to banks in the large-firm group, while some of the smaller banks in this group behave similarly to banks in the small-firm group. In addition, some of the largest midsize firms behave a lot like small firms with no big change in sovereign exposure during the COVID-19 period. Hence, this group is more idiosyncratic than the rest and is examined separately.
Panel A. Large Firms
Panel B. Small Firms
Panel C. Midsize Firms
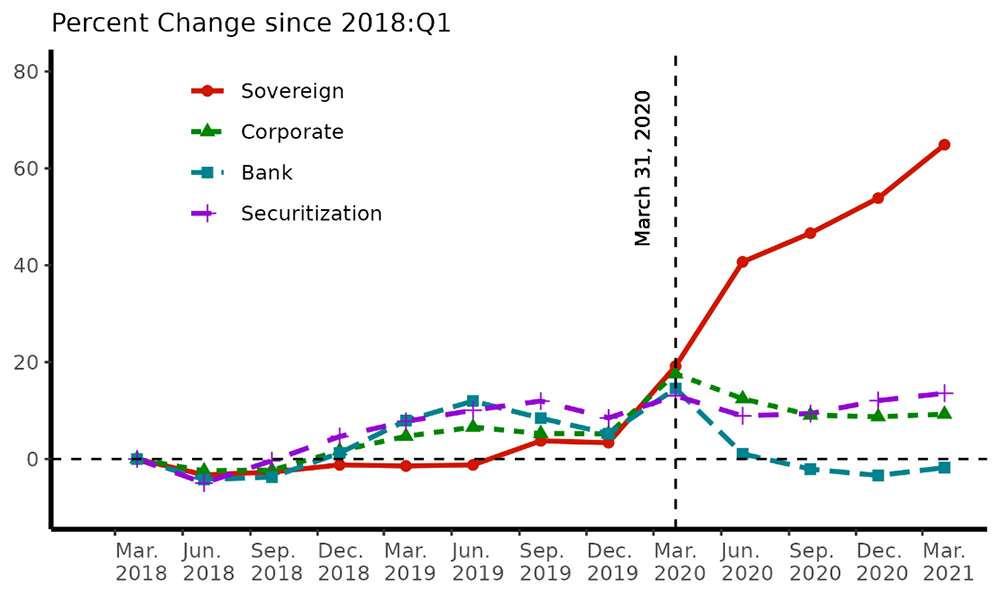
Note: This figure shows the increase in the exposures in the major asset classes since the 2018:Q1 level. Each panel represents a specific bank group by size. The changes are calculated by aggregating exposures for each bank group.
Source: Staff calculations based on public data from Federal Reserve Board, Form FR Y-9C, Consolidated Financial Statements for Bank Holding Companies.
Key Asset Classes in Highlight
Because sovereign and corporate exposures dominate the changes in asset allocation and consequent cosine similarity, we examine further the changes in their components in this section.
Sovereign Assets
First, we start with sovereign assets. In our definition, sovereign assets include about 20 different items from Y-9C BHCK data. We design this asset category so that the majority of these assets have zero risk weights by the Basel II Standardized Approach. We classify the major items in this sovereign asset class into four groups and report the share of each category in total sovereign exposures in table 2.
Table 2. Composition of Sovereign Exposures (2018:Q1)
(“Percent”)
| Form FR Y-9C Consolidated Financial Statements for Bank Holding Companies Data Item (BHCK) | Description | Small Firms | Midsize Firms | Large Firms |
|---|---|---|---|---|
| D958 | Cash and balances due from depository institutions – 0 percent risk weight category | 15.2 | 27.5 | 36.5 |
| B558, 1287 | U.S. Treasury securities | 19.8 | 13.1 | 20.8 |
| G304, G319, G307, G303, G300, G315, G312, K153, K145, K142, K150 | (Aggregated) agency mortgage-backed securities | 54.1 | 55.8 | 30 |
| 1742 | Amortized cost of held-to-maturity other foreign debt securities | <0.1 | <0.1 | <0.1 |
Note: This table shows the percentage of exposures of major items in the sovereign asset with 2018:Q1 data for each bank group. Denominators are the total amount of exposures in sovereign asset as we defined in table A1. Several small items in the sovereign asset class are omitted from the table.
Source: Staff calculations based on public data from Federal Reserve Board, Form FR Y-9C, Consolidated Financial Statements for Bank Holding Companies.
From table 2, we can see some significant differences in the composition of sovereign assets among different bank groups by size. Large firms have the majority of their sovereign assets in cash balances due from depository institutions (BHCK D958). This item basically reflects banks' cash positions, which include cash deposited at the Federal Reserve Bank and other institutions.5 In contrast, cash component is not the largest for small firms or midsize firms, falling behind agency mortgage-backed securities (MBS) and Treasury positions.
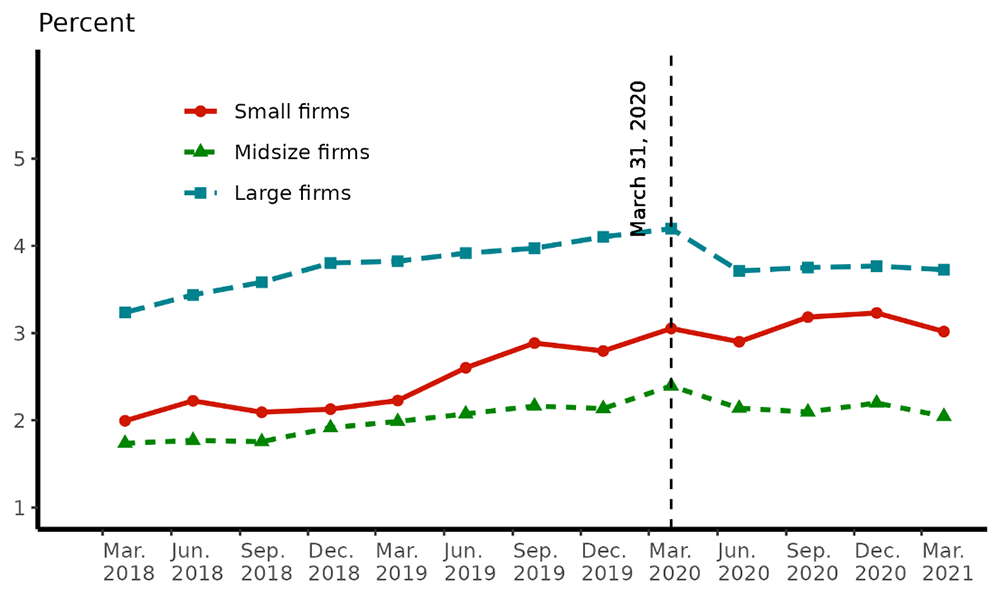
During the COVID-19 shock, major components of sovereign assets—namely, cash balances, Treasury securities, and agency MBS—all experienced large growth. The influx of cash from deposits due to government stimulus and asset purchasing plans was the driving force behind the growth. Figure 3 shows how the shares of these major sovereign components in the total assets changed over time. One noticeable difference between large firms and smaller firms is that Treasury holdings increased by around 10 percent since the first quarter of 2020 for large firms, whereas the share of Treasury holdings in small and midsize firms barely changed. Such difference might be due to the exemption of Treasury securities from the supplementary leverage ratio capital requirements for large firms, as part of the policy responses to the pandemic.
As to cash positions, all bank groups experienced a significant increase, largely due to the stimulus packages and the Federal Reserve's asset purchasing programs. Because cash positions used to occupy a large share in large banks' balance sheets, the amount of cash increase for large banks is also much larger than the increase for smaller firms. When large firms allocate more and more of their assets into Treasury and cash positions, their portfolio allocations become more and more similar as well. Such convergence is because those shares dominate sovereign exposure for large firms, and the sovereign exposures in turn are significant drivers for high cosine similarity among large firms (recall panel A of figure 1).
Panel A. Agency MBS
Panel B. Treasury Securities
Panel C. Cash Positions
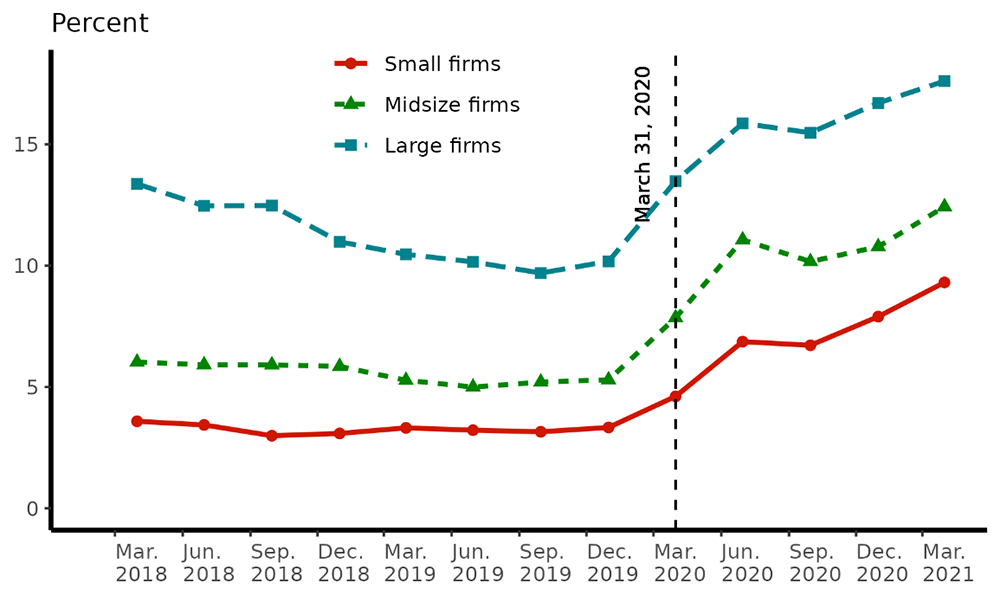
Note: This figure shows the change in exposures of major items in the sovereign asset as a percentage of total credit assets summed over the 12 categories as we define in table A1.
Source: Staff calculations based on public data from Federal Reserve Board, Form FR Y-9C, Consolidated Financial Statements for Bank Holding Companies.
Now that we have identified that the major driver for the portfolio convergence among large banks since the COVID-19 shock is the increase in Treasury and cash positions, the implication of such convergence on systemic risk is not as worrisome as it might appear to be, because those assets bear essentially zero default risk. If we excluded Treasury and cash positions from credit risk exposures, which might also be a reasonable approach, there would be no increase in similarity over the COVID-19 period for large firms, as shown in Figure 1.
Corporate Exposures
Second, we examine corporate exposures in more detail. Five Y-9C data items are used to create corporate exposures, as in table 3. Again, there are some significant differences in the composition of corporate exposures for firms of different size.
Table 3. Composition of Corporate Exposures (2018:Q1)
(“Percent”)
| Form FR Y-9C Consolidated Financial Statements for Bank Holding Companies Data Item (BHCK) | Description | Small Firms | Midsize Firms | Large Firms |
|---|---|---|---|---|
| 1763 | Commercial and industrial (C&I) loans to U.S. addressees | 75.7 | 77.6 | 49.7 |
| 1764 | C&I loans to non-U.S. addressees | 3.2 | 3.5 | 17 |
| J454 | Loans to nondepository financial institutions | 10.5 | 8.7 | 19.4 |
| 1545 | Security loans | 7.2 | 9.4 | 13.4 |
| 1590 | Agricultural loans | 3.3 | 0.8 | 0.4 |
Note: This table shows the percentage of exposures of major items in the corporate asset with 2018:Q1 data for each bank group. Denominators are the total amount of exposures in corporate asset as we defined in table A1.
Source: Staff calculations based on public data from Federal Reserve Board, Form FR Y-9C, Consolidated Financial Statements for Bank Holding Companies.
The most apparent difference is the amount of C&I loans to U.S. addresses. The small and midsize firms have more than 75 percent of their corporate exposures tied to these loans, while larger firms have only about one-half. As to C&I loans to non-U.S. addresses, unsurprisingly, smaller regional banks have much less exposure to international companies compared with larger banks with an international presence. Another noticeable difference is the category of loans to nondepository financial institutions, with large firms having a much higher portion of corporate exposures in this category.6
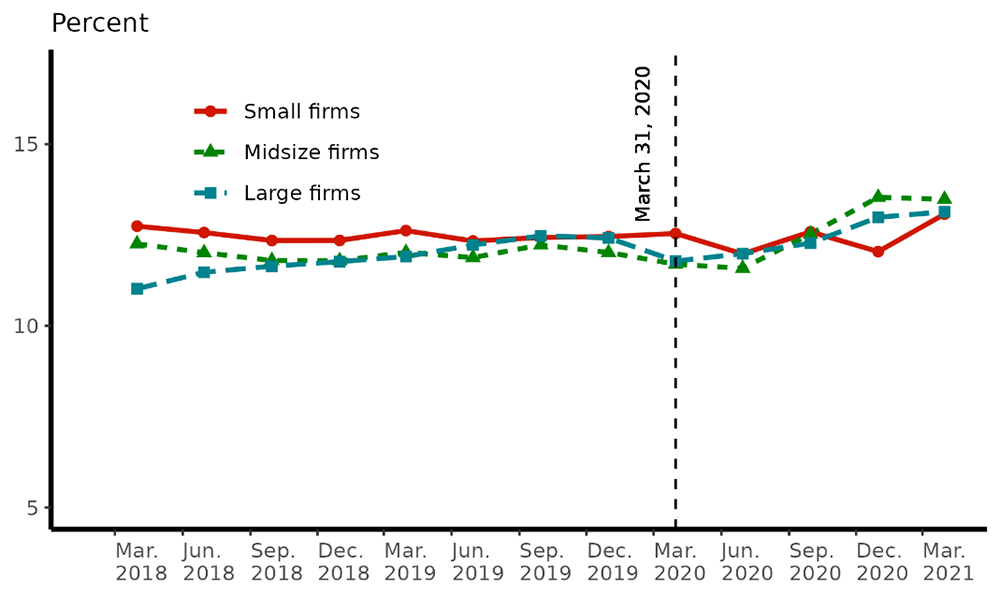
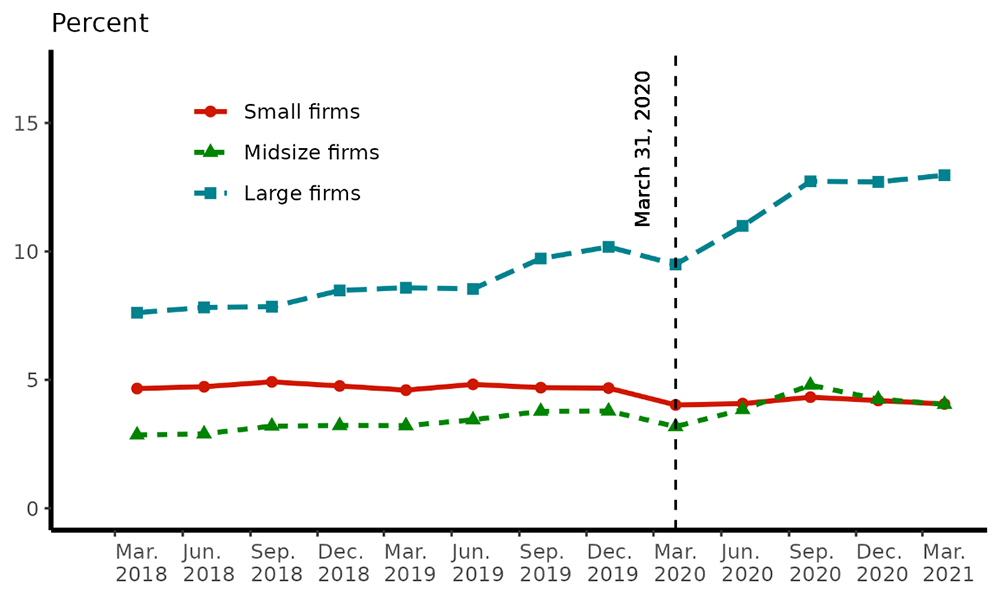
Figure 4 shows the change over time in the shares of the top two components of corporate exposures relative to total credit assets: C&I loans and loans to nondepository financial institutions. Focusing on panel A of figure 4 first, we find that although shares of C&I loans spiked for all bank groups during the pandemic, timing of the spikes varied. For large and midsize firms, the hikes in C&I loan share happened in the first quarter of 2020, while C&I loan share for small firms peaked in the second quarter of 2020. Such timing divergence reflects that the two distinct drivers behind the C&I loan increase – credit-line drawdowns and PPP lending – dominated banks of different size separately. As shown in Li, Strahan and Zhang (2020), cash demand from business borrowers in U.S. was concentrated in largest banks in the last three weeks of March 2020, thus driving the surge in C&I exposure in large banks. On the other hand, PPP lending began in April 2020 and its first two rounds ended in August 2020, which coincided with the C&I loan spike in small banks. Li and Strahan (2020) provide evidence that small banks were major facilitators for the PPP lending.7 Our comparison on credit portfolio decomposition has confirmed their findings. In addition, we also find that small banks' participation in the subsidized lending programs increased the degree of portfolio convergence among these banks, reflecting a wide-spread participation among small banks.
Panel A of figure 4 also shows that shares of C&I loans in the total credit exposures for both large and midsize banks decreased below the average levels before the COVID-19 shock, while the share for small banks remained higher than its pre-pandemic level. As to the share of loans to nondepository financial institutions, panel B of figure 4 shows that the share decreased in large banks while trended upward in small banks during the pandemic.
Panel A. C&I Loans to U.S. Addressees
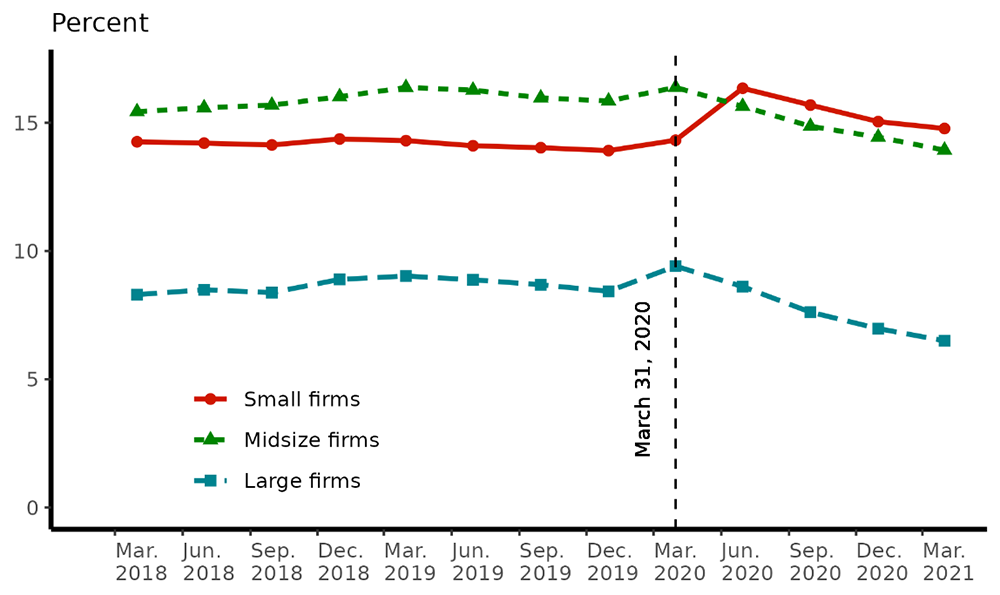
Panel B. Loans to Nondepository Financial Institutions
Note: This figure shows the change in exposures of major items in the corporate exposure as a percentage of banks' total credit assets summed over the 12 categories as we define in table A1.
Source: Staff calculations based on public data from Federal Reserve Board, Form FR Y-9C, Consolidated Financial Statements for Bank Holding Companies.
Conclusion and Discussion
With this note, we demonstrate how to measure the similarity of banks' credit portfolio allocations and analyze its changes over the COVID-19 pandemic. We find that during the pandemic, banks converged further within each size group. The convergence in large banks was primarily driven by the increase in their Treasury and cash holdings, while the convergence in small banks was primarily driven by the lending increase to domestic C&I borrowers. We document evidence that the COVID-19 shock affects these banks differently according to their pre-pandemic portfolio allocations. Our analysis confirms that small banks participated in fiscal supportive lending programs for business borrowers during the pandemic in the same collective manner. Given that the major drivers of bank convergence for large banks come from the safest assets, there is little implication of the convergence on the systemic risk in the banking system. This exercise also highlights the importance of understanding variations in banks' balance sheets and business models for conducting impact studies on the COVID-19 shock.
References
Bräuning, Falk and José L. Fillat (2019). "Stress Testing Effects on Portfolio Similarities among Large US Banks," Current Policy Perspectives, No. 19-1 (April), Federal Reserve Bank of Boston, https://www.bostonfed.org/publications/current-policy-perspectives/2019/stress-testing-effects-on-portfolio-similarities-among-large-us-banks.aspx/.
Form FR Y-9C, Consolidated Financial Statements for Bank Holding Companies. Board of Governors of the Federal Reserve System, National Information Center (NIC), https://www.ffiec.gov/NPW.
Girardi, Giulio, Kathleen W. Hanley, Stanislava Nikolova, Loriana Pelizzon, and Mila Getmansky Sherman (2021). "Portfolio Similarity and Asset Liquidation in the Insurance Industry," Journal of Financial Economics, vol. 142 (October), pp. 69–96.
Greenwood, Robin, Samuel G. Hanson, Jeremy C. Stein, and Adi Sunderam (2017). "Strengthening and Streamlining Bank Capital Regulation," Brookings Papers on Economic Activity, Fall, pp. 479–565, https://www.brookings.edu/bpea-articles/strengthening-and-streamlining-bank-capital-regulation/.
Hoshi, Takeo, and Ke Wang (2021). "Bank Regulatory Reforms and Declining Diversity of Bank Credit Allocation," CARF F-Series Working Paper, CARF-F-506. Tokyo: Center for Advanced Research in Finance, Faculty of Economics, University of Tokyo, February 1, https://www.carf.e.u-tokyo.ac.jp/en/research/5812/.
Kleymenova, Anya, Andrew K. Rose, and Tomasz Wieladek (2016). "Does Government Intervention Affect Banking Globalization?" Journal of the Japanese and International Economies, vol. 42 (December), pp. 146–61.
Li, Lei, and Philip E. Strahan (2020). "Who Supplies PPP Loans (And Does It Matter)? Banks, Relationships and the COVID Crisis," Journal of Financial and Quantitative Analysis, forthcoming.
Li, Lei, Philip E Strahan, and Song Zhang (2020). "Banks as Lenders of First Resort: Evidence from the COVID-19 Crisis," Review of Corporate Finance Studies, vol. 9(3), pp. 472–500.
Stiroh, Kevin (2018). "Supervisory Implications of Rising Similarity in Banking," speech delivered at the U.S. Banking Forum "Charting a Course for Stability and Success" of the Financial Times, New York, November 1, https://www.bis.org/review/r181109g.htm/.
Appendix.
Table A1: Asset Classification on Form FR Y-9C Consolidated Financial Statements for Bank Holding Companies Data
| Asset Category | Data Items |
|---|---|
| Sovereign | HCR1_SCALER*BHCKD958+BHCK0211+ BHCK8496+BHCKG300+BHCKG304+ BHCKG312+BHCKG316+BHCKK142+ BHCKK150+BHCK1287+BHCKB558+ BHCK8499+BHCKG303+BHCKG307+ BHCKG315+BHCKG319+BHCKK145+ BHCKK153+BHCK2081+BHCK1742+ BHCK1746 |
| Corporate | BHCK1590+BHCK1763+BHCK1764+ BHCKJ454+BHCK1545 |
| Retail | BHCKB538+BHCKB539+BHCKK137+ BHCKK207+BHCKF162+BHCKF163 |
| Bank | HCR1_SCALER*(BHCKD959+BHCKS397+ BHCKD960+BHCKS398) +BHCK1292+ BHCK1296 |
| Residential Real Estate (RRE) | DOM_RE_SCALER*(BHDM1797 + BHDM5367+BHDM5368) + BHCKG308+BHCKG311 |
| Income-Producing RRE | DOM_RE_SCALER*BHDM1460 |
| Commercial Real Estate (CRE) | DOM_RE_SCALER*BHDM1420+ BHCKF160+BHCKK146+BHCKK149 |
| Income-Producing CRE | BHCKF161 |
| High-Volatility CRE | BHCKF158+BHCKF159 |
| Equity | BHCK3656+BHCK1752+BHCKJA22+BHCKA511 |
| Securitization | BHCKS475+BHCKS480+BHCKS485+BHCKS490 |
| Other | (BHCKG320+BHCKG323+BHCKK154+ BHCKK157+BHCKC026+BHCKC027)- (BHCKS475+BHCKS480+BHCKS490)+ BHCK1737+BHCK1741+BHCKJ451+ BHCK2145+BHCK2150+BHCK2130+ BHCK2160-BHCK1752+BHCK3164 |
Note: Items in the “Code” column are from the Form FR Y-9C. “HCR1 Scaler” is a term for the ratio of post- to pre-adjustment balances of assets reported in line 1 of the HC-R Part II.
Source: Federal Reserve Board, Form FR Y-9C, Consolidated Financial Statements for Bank Holding Companies.
1. We thank Ben Ranish for his guidance on asset classifications using FR Y-9C data. We are also grateful to Christopher Finger, Greg Gupton, Takeo Hoshi, Don Kim, Lei Li, and Helen Xu for their helpful comments and suggestions. The views expressed in this paper are solely those of the authors and should not be interpreted as reflecting the views of the Board of Governors or the staff of the Federal Reserve System. Return to text
2. Other economic papers applying the same measure of portfolio similarity include Girardi and others (2021) for insurance companies' portfolio and Kleymenova, Rose, and Wieladek (2016) for cross-country portfolio mix. Return to text
3. The classification system defined here is solely the method by the authors and should not be interpreted as of the Board of Governors or the staff of the Federal Reserve System. Inevitably, similarity results depend on the asset classification. For more details on the conceptual foundation of this asset classification, including standardized-approach risk weights for each asset class, please refer to Basel consultative paper, "Basel II: International Convergence of Capital Measurement and Capital Standards: A Revised Framework - Comprehensive Version", June 2006, www.bis.org/publ/bcbs128.htm. Return to text
4. BHCs belonging to the large bank group are JP Morgan Chase, Bank of America, Wells Fargo, Citibank, Goldman Sachs, Morgan Stanley, Bank of New York Mellon, State Street, U.S. Bank, HSBC, PNC Bank, and TD Group; BHCs belonging to the midsize group are Truist Financial, Fifth Third Bancorp, MUFG, Northern Trust, Citizens Financial, KeyCorp Bank, BMO Financial, Barclays, BNP Paribas, UBS, Deutsche Bank, Credit Suisse, M&T Bank, Huntington Bancshares, American Express, Ally Financial, RBC, Regions Financial, Discover Financial, and Banco Santander. Charles Schwab is excluded from the analysis because its behavior is idiosyncratic and dramatically distorts the results. Seven firms with total assets between $10 billion and $100 billion are excluded from the sample due to incomplete data. Return to text
5. According to the FR Y-9C instruction, https://www.federalreserve.gov/reportforms/forms/FR_Y-9C20210630_i.pdf (PDF), page 301, BHCKD958 includes the following items: (1) the amount of currency and coin reported in Schedule HC, item 1(a); (2) any balances due from Federal Reserve Banks reported in Schedule HC, item 1(b); (3) the insured portions of deposits in Federal Deposit Insurance Corporation-insured depository institutions and National Credit Union Administration-insured credit unions reported in Schedule HC, items 1(a) and 1(b); and (4) the amount of negotiable certificates of deposit purchased through the Money Market Mutual Fund Liquidity Facility. Return to text
6. FR Y-9C Schedule HC-C Item 9.a. Loans to nondepository financial institutions include loans to insurance companies, real estate investment trusts, investment banks, mutual funds, and Small Business Investment Companies. Return to text
7. According to Li and Strahan (2020), banks with total assets under $50 billion provided about two thirds of the loans under the PPP program. Return to text
Hawley, Andrew, and Ke Wang (2021). "Credit Portfolio Convergence in U.S. Banks since the COVID-19 Shock," FEDS Notes. Washington: Board of Governors of the Federal Reserve System, November 26, 2021, https://doi.org/10.17016/2380-7172.2995.
Disclaimer: FEDS Notes are articles in which Board staff offer their own views and present analysis on a range of topics in economics and finance. These articles are shorter and less technically oriented than FEDS Working Papers and IFDP papers.