FEDS Notes
April 18, 2023
Did the Pandemic Change Who Became Behind on Rent? Characteristics of Renters Behind on Rent Before and After the Pandemic Onset
Zofsha Merchant, Erin Troland
As millions lost their jobs at the start of the COVID pandemic, many Americans risked missing their rent payments. Policymakers responded to the pandemic with hundreds of billions of dollars in government assistance and restrictions on evictions. Renters' financial well-being improved more compared to homeowners after many pandemic assistance programs were in place.1 Though mass nationwide evictions were avoided, by 2021 the percent of renters behind on rent in the past year increased to 17 percent from 10 percent in 2019 before the pandemic.2 However, among the 17 percent behind in 2021, little is known about their rent payment history before the pandemic. Were those behind in 2021 only (during the pandemic era) different from those who were also behind in 2019 (before the pandemic)? Understanding these differences has implications for the impact of recession assistance policies.
The pandemic era may have changed the composition, or types of renters behind on rent. On the one hand, higher-income households may make up a larger share of those newly behind on rent in 2021 compared to those also behind pre-pandemic. The pandemic recession caused widespread job losses, including among higher-income households.3 Higher-income renters should have, on average, a lower underlying risk of becoming behind on rent given a shock to their income or expenses. But the pandemic recession may have been large enough to cause them to miss rent payments. On the other hand, lower-income households may make up a larger share of those newly behind on rent in 2021. Lower-income renters should on average have a higher underlying risk of becoming behind on rent. The pandemic drove large increases in rent prices, which may have put pressure on lower-income renters.4 The nationwide eviction moratorium may also have provided short-term relief for lower-income renters to prioritize other bills besides rent, such as utilities, and delay rent payments. Finally, renters in lower-income neighborhoods were more likely to experience financial distress after the pandemic began.5
However, the pandemic era may have instead increased the percent of those behind on rent without changing the composition. Both renters newly behind and those also behind beforehand may have similar characteristics, and therefore similar risks of missing rent payments. Despite these similar risks, the overall likelihood of actually experiencing a negative financial shock was much lower in 2019 than after the pandemic began. Therefore, many renters did not happen to experience a shock in 2019. But once the pandemic hit, the effects were large and widespread. The timing of actually experiencing negative financial shocks is different across these two groups, but the risks of experiencing those shocks are similar. In this case, the percent of renters behind would increase but the composition would stay the same.
Understanding whether the composition of renters newly behind is different from those who had been behind before the pandemic has implications for the longer-term effect of recession-related assistance policies such as stimulus checks, unemployment, and rental assistance. Pandemic assistance policies were intended to help those in economic distress during the pandemic era, including those behind on rent after the pandemic began. Both the Coronavirus Aid, Relief, and Economic Security Act (CARES Act) and the American Rescue Plan had different combinations of short-term assistance to address the pandemic and resulting economic challenges. If more higher-income renters became behind in the pandemic era, short-term recession-related assistance would likely help many renters in the longer term. Higher-income renters are likely more stable financially in the absence of a major economic shock. Assistance would help get them back on their feet financially and help prevent future rent payment issues. In contrast, many lower-income renters may be one negative shock away from becoming behind again. If even more lower-income renters became behind in the pandemic era, short-term assistance would address their immediate challenges. However, other policies, such as longer-term rental assistance like expanded housing vouchers, may help address the longer-term, structural challenges lower-income renters face.6 Until now, data limitations have prevented comparisons of renters newly behind on rent versus those also behind before the pandemic began.
We use the 2021 Survey of Household Economics and Decisionmaking (SHED), a nationally representative survey of US adults, to examine two groups of renters: Those who were behind in 2021 only (after the pandemic began) and those were behind in both 2019 and 2021 (before and after the pandemic began).7 We compare characteristics of these two groups to determine whether renters who became behind in 2021 are different from those also behind in 2019. We choose characteristics that correlate with the risk of experiencing housing insecurity, such as income and demographic factors. We then compare both groups to renters who were not behind in 2021.
The majority of renters behind on rent after the pandemic began were not previously behind in 2019. Over two-thirds (69 percent) of renters who reported being behind on rent in the past 12 months in 2021 did not report being behind at any point in 2019. The remaining 31 percent of those behind in 2021 reported also being behind on rent at some point during 2019.
Renters behind in 2021 only and those behind in both years are similar across a broad range of characteristics that correlate with the risk of housing insecurity, and both groups appear to live in lower-income households with higher risks of becoming housing insecure. Both groups had similar usual incomes as proxied by education, age, parental education, and disability status. In each group, nearly 50 percent had a high school degree or less. In both groups, just around 10 percent had a bachelor's degree or more compared to 31 percent of those not behind in 2021. Additionally, those behind in 2021 only and those behind in both years received unemployment income and applied for rental assistance at similar rates and owed similar amounts of back rent.
We find racial disparities in becoming behind on rent in 2021, but such disparities appear to be primarily driven by differences in economic circumstances. Black and Hispanic renters are more likely than White renters to be behind in 2021, but these differences decline and are not statistically significant when controlling for factors that drive economic differences. This analysis builds on previous work that finds racial disparities in eviction and rent payment without directly accounting for economic differences.8 Differences in economic circumstances may be driven by a variety of factors such as discrimination in labor and housing markets.9 However, among all those who were behind in 2021, we do not find evidence of racial disparities in the likelihood of being behind in 2021 only versus behind in both years.
Overall, we find the composition of renters behind in 2021 is similar regardless of whether they were also behind in 2019. Both groups of renters have a higher risk of housing insecurity than those not behind in 2021.
1. Data and Methodology: Classifying Renters Behind on Rent Before and After the Pandemic Onset
We use the 2021 Survey of Household Economics and Decisionmaking (SHED), a nationally representative survey of adults, to distinguish between renters behind in 2021 only versus those behind in 2019 and 2021 (before and after the pandemic began). Approximately 12,000 respondents took the survey in October 2021. Among respondents who pay rent, we use two survey questions to classify renters by their rent payment history. The first question asked all renters if they had been behind on rent any time in the past year. Since the survey was conducted in October 2021, the question covers October 2020 to October 2021. This period captures the COVID-19 pandemic era, measuring rent payment net of many government assistance programs already in place and after rent prices began to grow at higher rates than pre-pandemic. The second question is a retrospective question that asked respondents: "Thinking back before the pandemic, at any point in 2019 were you behind on rent?"
From these questions, we split the 467 renters behind in 2021 into two groups:10
(1) Those behind on rent in 2021 only (after the pandemic began)
Behind on rent only from October 2020 – October 2021 and not behind on rent in 2019
(2) Those behind on rent in both 2019 and 2021 (before and after the pandemic began)
Behind on rent in both 2019 and from October 2020 – October 2021.
To analyze differences in the composition of these two groups, we compare economic and demographic characteristics across both groups. To select these characteristics, we turn to previous literature examining characteristics of renters facing housing insecurity such as eviction, high rent compared to income, and missing rent payments. Black and Latinx renters, particularly women, and those with children face the highest rate of eviction filings.11 Renters who are older, live in larger households, or have lower income are more likely to pay more than 30 percent of their income on rent.12 Black and Hispanic renters are more likely to have missed rent payments compared to White renters.13 Of these characteristics, our data allow us to examine race and ethnicity, households with children, age, education, parental education, and disability status as proxies for usual income. We also analyze current income, though this measure is likely endogenous to the income shocks renters may have faced leading to missing rent payments.14
To analyze the timing of economic shocks across these two groups, we examine two questions measuring changes in income and self-reported financial well-being. Respondents reported whether their income had increased, decreased, or stayed the same over the past year. Additionally, respondents reported how they were doing financially in 2021 compared to 2019.
Finally, we analyze differences in amounts of back rent owed among the two groups as well as interaction with government assistance programs. Among those who were behind on rent in the past year in 2021, the survey asked whether they were currently behind on rent and if so, how much they owe in back rent. The survey also collected information on receipt of unemployment benefits and application for and receipt of rental assistance.
A caveat to our analysis is that we cannot observe whether renters were behind on rent before 2019 or between the period of January 2020 – September 2020. Therefore, some renters in the 2021 only group may have been behind on rent in 2018 or earlier. Others may not have been newly behind in the pandemic era, but rather became behind in early 2020 before the pandemic began.
2. Results: The Pandemic Did Not Substantially Change the Composition of Renters Behind on Rent
The majority of renters behind on rent in 2021 had not previously been behind in 2019. Of the 17 percent of all renters behind on rent in 2021, 69 percent were behind in 2021 only, and 31 percent were also behind in 2019.15
However, the pandemic era did not substantially change the composition of those behind on rent. Renters who were behind in 2021 only and those who were behind in both 2019 and 2021 appear similar across a range of characteristics that correlate with the propensity to face housing insecurity. Renters in both groups have similar distributions of factors that correlate with usual income (Figure 1 and Figure 2). Education, parental education, and age have nearly identical distributions. Though disability status is somewhat higher in the group behind in both 2019 and 2021, these differences are not statistically significant. Similarly, modest variations in racial composition are not statistically significant (Figure 3). Slightly higher shares of renters behind in 2019 and 2021 are White or Black renters compared to 2021 only, and the opposite is true for Hispanic renters. Future work with a larger sample may draw stronger conclusions. Both groups also have similar shares of households with children (Figure 3). Though direct measures of actual income and financial resources in 2021 are endogenous to the shocks both groups experienced, we also show the groups are similar across these measures (Figure 4).
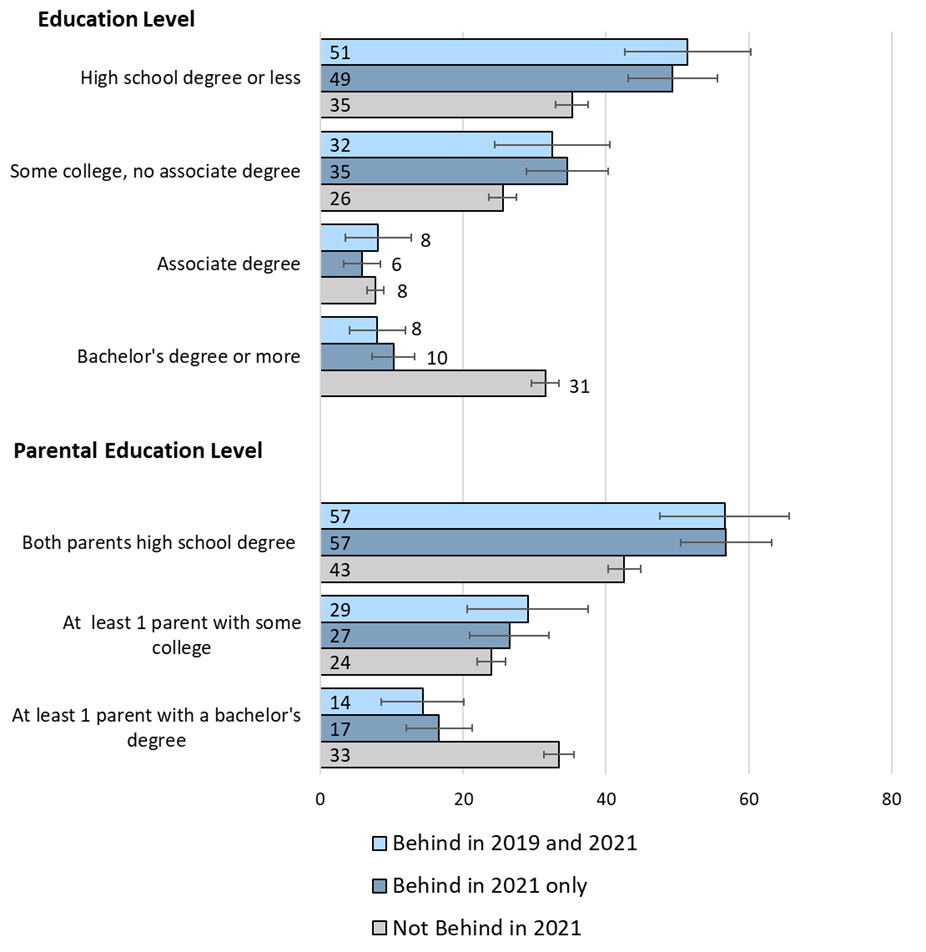
Notes: Each bar represents the percent of renters at each education level within each renter group. Summing the bars within renter group (bars of the same color) across education levels adds up to 100 percent (with some not exactly 100 percent due to rounding). Bars represent 95 percent confidence intervals using linear regressions with robust standard errors. Data from 2021 Survey of Household Economics and Decisionmaking. Key identifies bars in order from top to bottom.
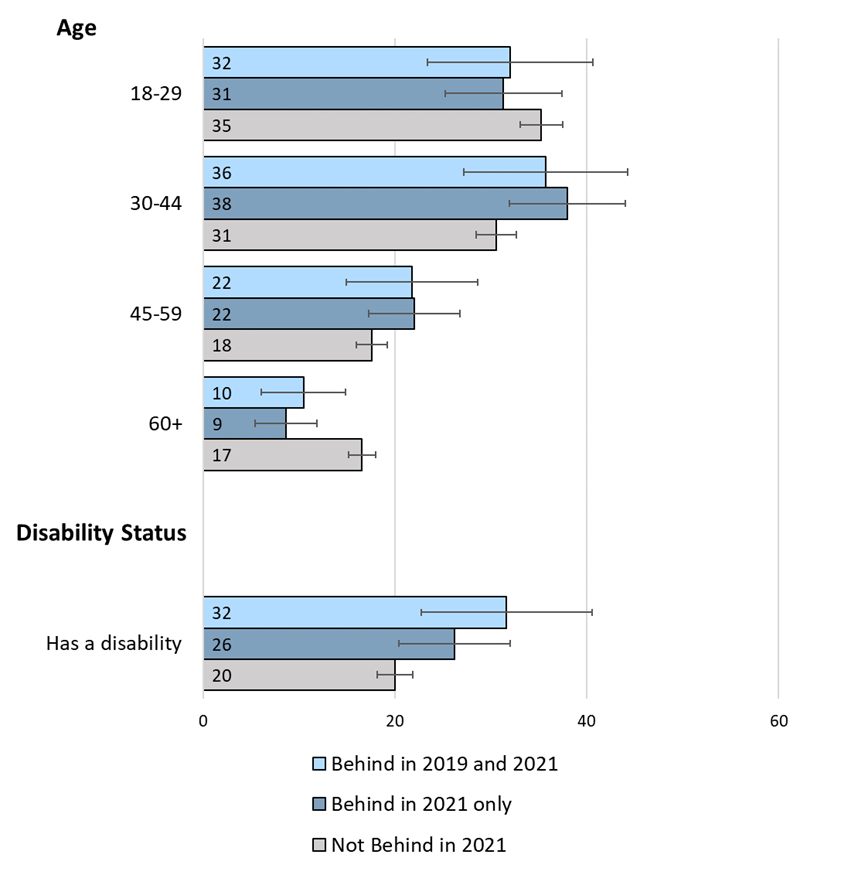
Notes: Under Age, each bar represents the percent of renters at each age level within each renter group. Summing the bars within renter group (bars of the same color) across age levels adds up to 100 percent. Under Disability Status, each bar represents the percent of renters within each renter group with a disability. Bars represent 95 percent confidence intervals using linear regressions with robust standard errors. Data from 2021 Survey of Household Economics and Decision making. Key identifies bars in order from top to bottom.
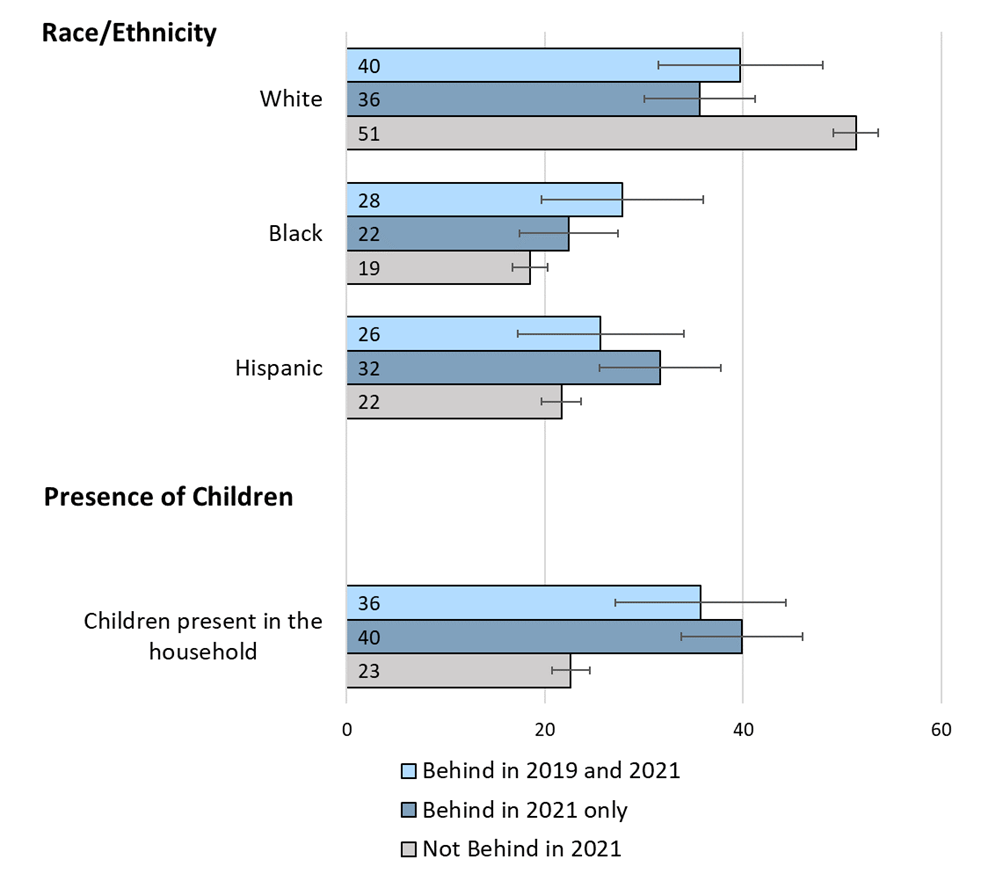
Notes: Under Race/Ethnicity, each bar represents the percent of renters of each race/ethnicity within each renter group. Under Presence of Children, each bar represents the percent of renters with a child in their house. Bars represent 95 percent confidence intervals using linear regressions with robust standard errors. Summing the bars within renter group (bars of the same color) across races/ethnicities adds up to less than 100 percent. This is because Asian renters, renters of other races, and renters of multiple races not included due to small sample size. White, Black, and Hispanic renters are reported in the survey data as mutually exclusive categories, with White renters and Black renters including those renters who are non-Hispanic only. Data from 2021 Survey of Household Economics and Decision making. Key identifies bars in order from top to bottom.
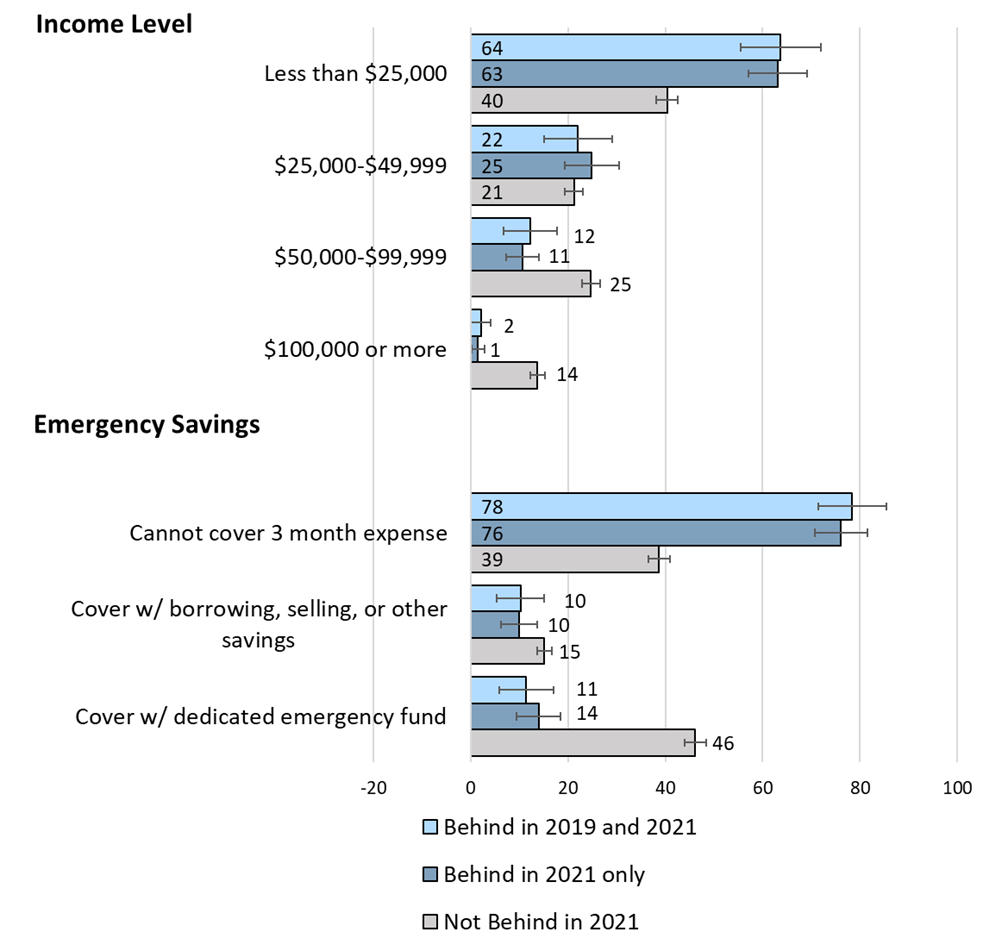
Notes: Each bar represents the percent of renters at each income level or ability to cover three months of expenses with emergency savings within each renter group. Summing the bars within renter group (bars of the same color) across income levels or across emergency savings adds up to 100 percent (with some not exactly 100 percent due to rounding). Bars represent 95 percent confidence intervals using linear regressions with robust standard errors. Data from 2021 Survey of Household Economics and Decisionmaking. Key identifies bars in order from top to bottom.
Moreover, renters in both groups behind in 2021 tend to be in lower-income households, with a higher risk of face housing insecurity compared to those not behind. Ten percent or less of renters in both groups behind in 2021 have a bachelor's degree or more compared to 31 percent of renters not behind in 2021 (Figure 1), suggesting that only a small fraction of those behind after the pandemic onset were higher-income renters. Results are similar for parental education and economic characteristics in 2021 (Figure 1 and Figure 4). Both groups behind on rent in 2021 also have higher rates of disability and far higher rates of children in the household than those not behind (Figure 2 and Figure 3). Forty percent of renters behind in 2021 and 36 percent behind in 2019 and 2021 have children compared to just 23 percent of those not behind.
Though both groups appear similar along factors that correlate with the propensity to become housing insecure, the two groups differ in the timing of realized economic hardship, consistent with the timing of becoming behind on rent. Forty-two percent of renters behind only in 2021 faced a decline in total monthly income in the previous year compared to 26 percent of renters who were also behind in 2019 (Figure 5). Both rates are much higher than the share not behind in 2021 at just 13 percent. Twenty-seven percent of renters behind in 2021 only report being much worse off financially in 2021 compared to 2019, versus 15 percent of renters who were also behind in 2019. In contrast, renters who were also behind in 2019 are much more likely to report that they are doing about the same financially (32 percent) than renters behind in 2021 only (19 percent).
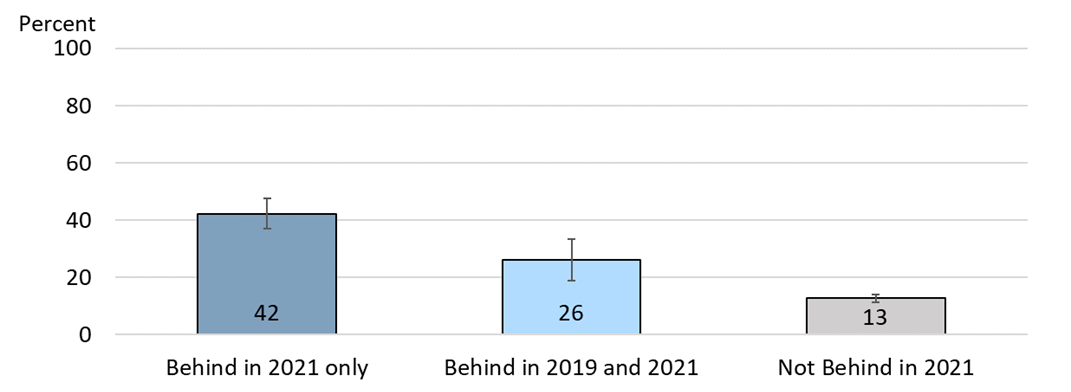
Notes: Bars represent 95 percent confidence intervals using linear regressions with robust standard errors. Data from 2021 Survey of Household Economics and Decisionmaking.
Racial Disparities in Rental Debt
Similar to previous work on evictions and rent payment, we find racial disparities in the overall likelihood of being behind on rent. These disparities appear to be driven by differences in economic circumstances that can arise from a variety of factors, including housing and labor market discrimination. Without accounting for differences in economic circumstances, Black and Hispanic renters were around eight to nine percentage points more likely to be behind on rent in 2021 compared to White renters' average of 13 percent. However, these differences decrease to 3 and 4 percent respectively and become statistically insignificant with controls for education, parental education, age, disability status, self-reported discrimination, current family income, and the presence of children in the household (Figure 6 and Table 1). Additionally, even with these controls, around 90 percent of the variation in rent payment remains unexplained, as the R-squared term is just 11 percent. Adding a control for past rent payment in 2019 adds some additional explanatory power, increasing the R-squared to 18 percent.
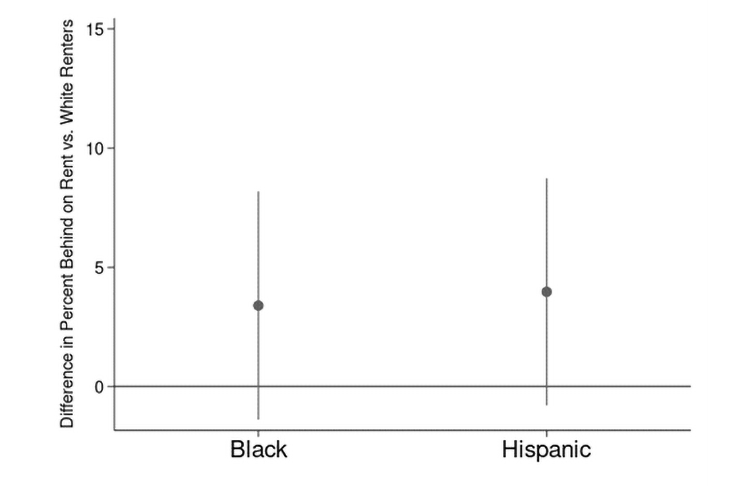
Notes: Bars represent 95 percent confidence intervals using linear regressions with robust standard errors. Data from 2021 Survey of Household Economics and Decisionmaking.
Among those behind on rent in 2021, renters of different racial and ethnic groups had similar likelihoods of being behind in 2021 only versus behind in both years. For those behind in 2021, 66 percent of White renters and 64 percent of Black renters were behind on rent in 2021 only, similar to the overall rate of 69 percent for all renters behind in 2021 (Figure 7). Hispanic renters behind saw slightly higher rates of being behind in 2021 only, but these rates are not statistically different than those for Black or White renters (Figure 7).
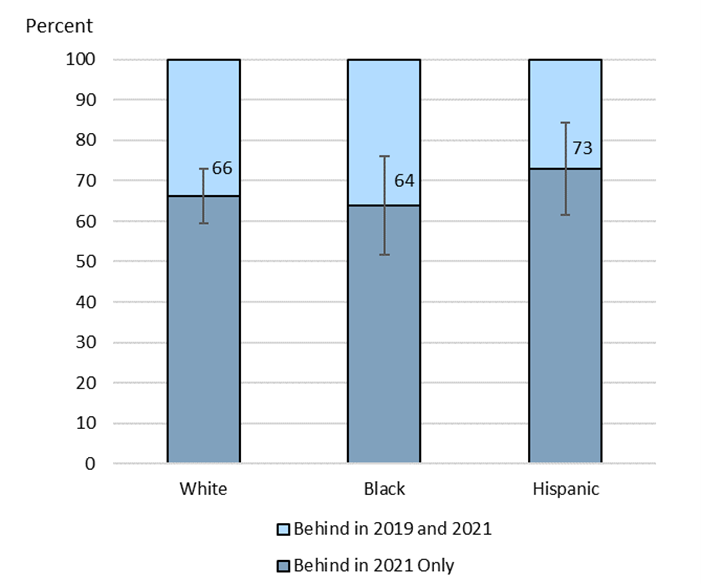
Notes: Bars represent 95 percent confidence intervals using linear regressions with robust standard errors, without controlling for other factors as in Figure 6. Data from 2021 Survey of Household Economics and Decisionmaking. Key identifies bars in order from top to bottom.
Pandemic Assistance and Back Rent
Renters behind in 2021 only and renters behind in both 2019 and 2021 were equally likely to apply for rental assistance and receive unemployment assistance (Figure 8). Both groups applied for rental assistance at similar rates (around 35 percent). Renters who were behind in both years had higher rates of receiving rental assistance, but the difference is not statistically significant.16 For both groups, 23 percent received unemployment assistance in the past year (the same reference period as the question about being behind on rent), compared to 11 percent of those not behind on rent in 2021.
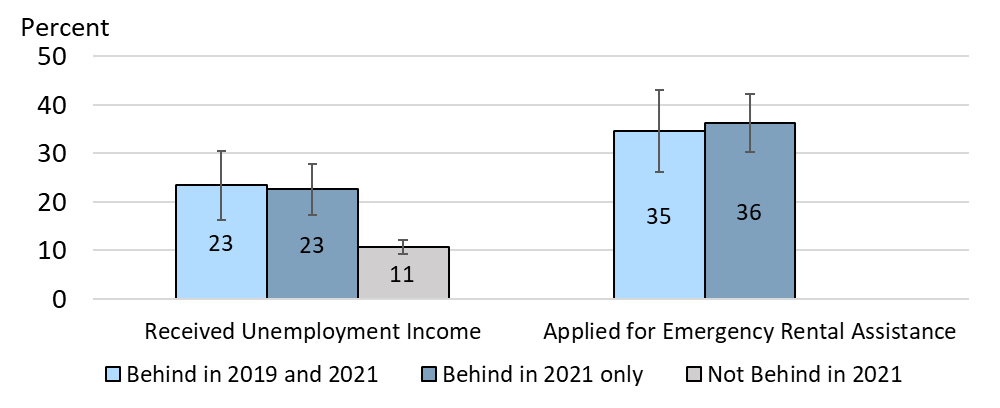
Notes: Bars represent 95 percent confidence intervals using linear regressions with robust standard errors. Data from 2021 Survey of Household Economics and Decisionmaking. Rental assistance questions were not asked of those not behind on rent in 2021. Key identifies bars in order from left to right.
Renters in each group who still owed back rent at the time of the survey in October 2021 owed similar amounts. Among those who still had rental debt, the median amount owed was $1,200 across both groups. However, the 75th percentile of renters behind in 2021 only was somewhat higher ($2,500) than the 75th percentile of those behind in both years ($2,000). Estimates of total back rent in October 2021 at the time the SHED data were collected ranged from around $9 billion to around $17 billion.17
Robustness to Alternative Renter Classification
We compare the characteristics of all renters behind on rent in 2019 to all renters behind on rent in 2021 and find that regardless of how we categorize renters according to their realized negative economic shocks, they face similar underlying risks of becoming behind on rent. Those behind in 2019 could be behind in 2019 only or behind in both 2019 and 2021. Those behind in 2021 could be behind in 2021 only or behind in both 2019 and 2021. Of all renters in 2021, 10 percent were behind in 2019 and 17 percent were behind in 2021. This classification is theoretically less relevant for understanding the longer-term impacts of recession policies, as renters behind in 2019 only were not behind during a recession and its aftermath.
However, similar to our main results, we find that both groups of renters have similar compositions across characteristics that are correlated with housing insecurity propensity and tend to live in lower-income households. Proxies for usual income such as disability status, education level, age, and parental education had similar distributions across these two groups. The median education level for renters behind in 2019 was a high school degree and for those behind in 2021 was some college, no degree. Both groups had similar rates of having a child who lives with them. The racial/ethnic compositions of each group were slightly more similar than in our main analysis. Finally, both groups received unemployment assistance at similar rates.
Discussion
The pandemic era increased the percent of renters behind on rent but did not substantially change the composition of those behind across a variety of characteristics such as education and income. Renters behind only in 2021 were broadly similar to those also behind in both 2019 and 2021 across a range of characteristics correlated with housing insecurity, suggesting similar risks of becoming behind. Both groups live in households with lower usual income than those who were not behind in 2021, as measured by education, parental education, and disability status. We find modest variation in racial and ethnic composition across the two groups, though sample size limitations prevented drawing firm conclusions that future work may be able to resolve.
One explanation for our results is that renters behind in 2021 and those also behind in 2019 have similar risks of housing insecurity but differ in the timing of realized economic shocks leading to actual housing insecurity. To illustrate this, we use an analogy of flood risk. The risk of experiencing economic hardship from economic shocks can be compared to the risk of experiencing a flood. Though people may live in areas that have similar underlying risks of flood, not everyone in those areas experiences a flood in a given year. In some years, small, localized floods affect a smaller number of people with similar flood risk. In other years, a large, widespread flood affects large numbers of people who have similar flood risk. Similarly, the two groups of renters were already at similar risk of missing rent payments. In 2019, fewer renters in this at-risk group actually became behind on rent because the likelihood of experiencing an economic shock was lower when the national economy was doing well. But the COVID-19 pandemic was like a widespread flood to the economy, affecting both groups.
Another explanation is that our observable measures of housing insecurity risk do not capture enough variation to help us distinguish between the two renter groups. Though these factors, such as income and race/ethnicity, are taken from previous literature on housing insecurity, they only explain around 10 percent of the variation in rent payment in 2021. When we add a control for rent payment history in 2019 on top of these standard observable housing insecurity risk factors, the regression explains around 18 percent of the variation in rent payment in 2021. This finding suggests that rent payment history captures other factors that drive housing insecurity risk besides the standard observables in our main regression analysis. Other unobservable factors may explain why, for example, some higher-income renters became behind on rent even before the pandemic (one in ten of those behind in both 2019 and 2021 had a bachelor's degree or more).
If, however, our measures do capture enough meaningful variation in housing insecurity risk, the impact of short-term assistance policies is likely temporary for many renters. For those higher-income renters with lower underlying housing insecurity risk, short-term assistance likely helped prevent a financial downward spiral that would put them at a higher risk of missing rent payments in the future. However, most renters behind in 2021 appeared to be lower-income renters with high housing insecurity risk. These renters are one negative shock away from becoming behind again, and short-term government assistance can provide temporary relief. However, to address the longer-term problem of persistent, structural housing insecurity, other policies may be needed.
Table 1. Racial Disparities in Behind on Rent in 2021 Regression Results
| Have you been behind on your rent at any time in the past year? | |
|---|---|
| Race/Ethnicity - 4 categories | |
| Black | 0.034 |
| Hispanic | 0.040 |
| Education- 6 Categories | |
| High school degree | 0.003 |
| Some college, no degree | 0.040 |
| Certificate or technical degree | -0.043 |
| Associate degree | -0.039 |
| Bachelor's degree or more | -0.045 |
| Age - 7 Categories | |
| 25-34 | 0.068** |
| 35-44 | 0.054 |
| 45-54 | 0.077** |
| 55-64 | 0.058* |
| 65-74 | -0.036 |
| 75+ | -0.052 |
| Presence of children in the household? | |
| Yes | 0.114*** |
| Disability Status | |
| Has a disability | 0.034 |
| Parents' education status- 3 Categories | |
| At least 1 parent with some college, either with a bachelor's degree | 0.005 |
| At least 1 parent with a bachelor's degree | -0.023 |
| Self reported discrimination or unfair treatment? | |
| Yes | 0.090*** |
| Income- 4 Categories | |
| $25,000 - $49,999 | -0.043* |
| $50,000 - $99,999 | -0.129*** |
| $100,000 or more | -0.167*** |
| Constant | 0.124*** |
| Observations | 2198 |
| Adjusted R-squared | 0.096 |
Note: p-values in parentheses
* p<0.10 ** p<0.05 *** p<.01
1. Dobre, Rush, & Wilson (2021). Financial conditions for renters before and during the COVID-19 pandemic. CFPB Office of Research. Research Brief No. 2021-9. https://files.consumerfinance.gov/f/documents/cfpb_financial-conditions-for-renters_report_2021-09.pdf Return to text
2. Federal Reserve Board. (2022). Economic Well-being of US Households in 2021. https://www.federalreserve.gov/publications/files/2021-report-economic-well-being-us-households-202205.pdf Return to text
3. Chetty, F., Hendren, S., & the Opportunity Insights Team (2022). The Economic Impacts of COVID-19: Evidence from a New Public Database Built Using Private Sector Data. Working Paper. Return to text
4. National median rent for new leases grew 18 percent during 2021 compared to 2 percent during 2019. Median new lease rent grew 16 percent between December 2019 and December 2021. Source: Authors' calculations using Apartment List Rent Estimates. https://www.apartmentlist.com/research/national-rent-data Return to text
5. Hermann, A., Wedeen, S., Airgood-Obrycki, W. & Herbert, C (2023). The Geography of Renter Financial Distress and Housing Insecurity During the Pandemic. The Joint Center for Housing Studies. Return to text
6. Fischer, W. (2022). Housing Investments in Build Back Better Would Address Pressing Unmet Needs. Center for Budget and Policy Priorities. https://www.cbpp.org/research/housing/housing-investments-in-build-back-better-would-address-pressing-unmet-needs . Olsen, E. (2021). Thanks to Manchin, BBB's housing provisions are dead. The Hill. https://thehill.com/opinion/finance/587057-thanks-to-manchin-bbbs-housing-provisions-are-dead-and-should-stay-that-way/ Return to text
7. Both questions come from the 2021 survey fielded in October 2021. For rent payment in 2021, the rent payment question covers October 2020-October 2021. For rent payment in 2019, question was asked of renters in 2021. about their rent payments in 2019. Return to text
8. Hepburn, P., Louis, R., & Desmond, M. (2020). Racial and gender disparities among evicted Americans. Sociological Science, 7, 649-662. Wedeen, S. (2021). Reed, D., Divringi, E., & Akana, T. (2021). Renters' Experiences During COVID-19. Federal Reserve Bank of Philadelphia Research Brief. Return to text
9. See: Darity Jr, W. A., & Mason, P. L. (1998). Evidence on discrimination in employment: Codes of color, codes of gender. Journal of Economic Perspectives, 12(2), 63-90; Neumark, D. (2018). Experimental research on labor market discrimination. Journal of Economic Literature, 56(3), 799-866; Galster, G. (1990). Racial steering in urban housing markets: A review of the audit evidence. The Review of Black Political Economy, 18(3), 105-129; Neumark, D., & Rich, J. (2019). Do field experiments on labor and housing markets overstate discrimination? A re-examination of the evidence. ILR Review, 72(1), 223-252. Return to text
10. A subsample of individuals who took both the 2019 and 2021 SHED was used to determine how many individuals were renters in both years. Approximately 88 percent of the subsample of renters in 2021 were also renters in 2019. Four percent owned a home in 2019, and 8 percent neither owned a home nor paid rent in 2019. Return to text
11. Hepburn, P., Louis, R., & Desmond, M. (2020). Racial and gender disparities among evicted Americans. Sociological Science, 7, 649-662. Wedeen, S. (2021). Black and Hispanic Renters Face Greatest Threat of Eviction in Pandemic. Joint Center for Housing Studies. https://www.jchs.harvard.edu/blog/black-and-hispanic-renters-face-greatest-threat-eviction-pandemic. Return to text
12. Oh, D. (1995). Households With Rent Burdens: Impact on Other Spending and Factors Related to the Probability of Having A Rent Burden. Journal of Financial Counseling and Planning, 6, 139-147. Larrimore, J., & Schuetz, J. (2017). Assessing the Severity of Rent Burden on Low-Income Families. FEDS Note. https://www.federalreserve.gov/econres/notes/feds-notes/assessing-the-severity-of-rent-burden-on-low-income-families-20171222.html Return to text
13. Reed, D., Divringi, E., & Akana, T. (2021). Renters' Experiences During COVID-19. Federal Reserve Bank of Philadelphia Research Brief. Disparities in rent payment by race and ethnicity may arise from factors such as labor market and housing discrimination that drive economic differences. See footnote 7. Return to text
14. The survey measured actual income in 2021 and did not collect information on actual income in 2019. Return to text
15. Among the 467 renters in the 2021 SHED behind on rent in 2021, 319 were behind in 2021 only and 148 were behind in both 2019 and 2021. Return to text
16. Among those who applied for rental assistance, 36 percent of renters behind in 2021 received assistance compared to 44 percent of renters behind in both years. However, this analysis is restricted to just those renters currently behind on rent in October 2021 (as opposed to those behind at some point in the past year as of October 2021), which reduces the sample size to 118 in the 2021 only group and 49 in the 2019 and 2021 group. Return to text
17. Reed, D., & Divringi, E. (2021). Household Rental Debt during COVID-19: Update for August 2021. Federal Reserve Bank of Philadelphia. https://www.philadelphiafed.org/-/media/frbp/assets/community-development/briefs/updatedhouseholdrentdebt-final.pdf; Parrott, J., & Zandi, M. (2021). The Race to Save Millions from Eviction. Urban Institute. https://www.urban.org/research/publication/race-save-millions-eviction; Federal Reserve Board. (2022). Economic Well-being of US Households in 2021. https://www.federalreserve.gov/publications/files/2021-report-economic-well-being-us-households-202205.pdf Return to text
Merchant, Zofsha, and Erin Troland (2023). "Did the Pandemic Change Who Became Behind on Rent? Characteristics of Renters Behind on Rent Before and After the Pandemic Onset," FEDS Notes. Washington: Board of Governors of the Federal Reserve System, April, 18, 2023, https://doi.org/10.17016/2380-7172.3292.
Disclaimer: FEDS Notes are articles in which Board staff offer their own views and present analysis on a range of topics in economics and finance. These articles are shorter and less technically oriented than FEDS Working Papers and IFDP papers.