FEDS Notes
June 28, 2018
(Don't Fear) The Yield Curve
Eric Engstrom and Steven Sharpe1
See https://www.federalreserve.gov/econres/feds/files/2018055r1pap.pdf for a revised, slightly updated, more fully exposited version of the analysis in this Note.
Introduction
Commonly cited measures of the term spread, such as the difference between the 10-year and 2-year nominal Treasury yields, have dropped over the past several years (Figure 1, blue line), a trend that has raised concerns and provoked extensive commentary in the financial press. Those concerns owe to the statistical power that low levels of term spreads have shown for predicting historical recessions over the subsequent year or so.2 In this note, we show that, for predicting recessions, such measures of a "long-term spread"--the spread in yields between a far-off maturity such as 10 years and a shorter maturity such as 1 or 2 years--are statistically dominated by a more economically intuitive alternative, a "near-term forward spread." This spread can be interpreted as a measure of the market's expectations for the direction of conventional near-term monetary policy. When negative, it indicates the market expects monetary policy to ease, reflecting market expectations that policy will respond to the likelihood or onset of a recession. By that token, the current level of the near-term spread does not indicate an elevated likelihood of recession in the year ahead, and neither its recent trend nor survey-based forecasts of short-term rates point to a major change over the next several quarters.
Defining Near-Term Forward Spreads
Like a standard term spread measure using yield to maturity, a forward spread gauges the slope of the Treasury term structure. However, using forward rates should help identify more precisely than yields where on the maturity spectrum the signal for recession lies.3 The forward rate at a given maturity can be thought of as a gauge of the market's expected short rate at that horizon, plus a term premium. On the other hand, because a bond's yield is an average of the forward rates over the term of a bond, yields tend to dull the signal embedded in forward rates. The near-term forward spread we focus on is the difference between the current implied forward rate (on Treasury bills) six quarters from now and the current yield on a three-month Treasury bill, plotted in red alongside the long-term yield spread in Figure 14. Arguably, changes in this forward spread should be driven largely by changes in the market's expectations for the path of interest rates set by monetary policymakers over the next six quarters, departing from this only to the extent of fluctuations in term premiums on shorter-term Treasuries.
Figure 1: Long-term Yield Spread and Near-term Forward Spread
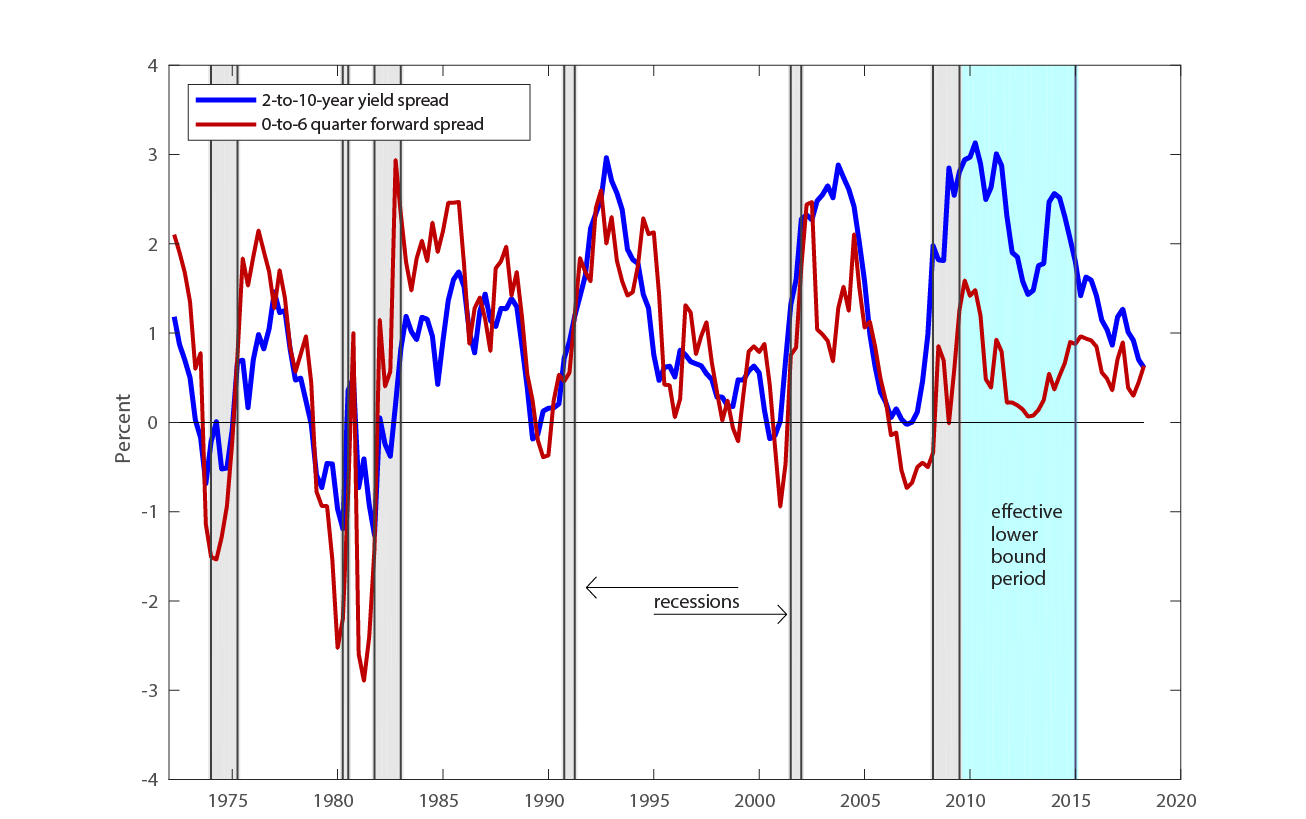
Source: Federal Reserve Bank of New York; Federal Reserve Board staff estimates.
Indeed, as shown in Figure 2, the near-term spread covaries closely with a survey-based measure of the expected trajectory of the federal funds rate over a roughly comparable horizon, the dotted green line, and they have moved nearly in lock step since 2001.5 Thus, the near-term forward spread does indeed appear to be a pretty good gauge of market expectations regarding monetary policy. In particular, when the near-term forward spread is negative, it signals that investors expect the Federal Reserve to ease monetary policy in the near term. When do investors expect monetary policy easing? Presumably, when they anticipate a substantial slowing or decline in economic activity. Consequently, it is not all that surprising that negative readings for the near-term spread tend to precede (and thus can be used statistically to forecast) recessions. This does not mean that inversions of the near-term spread cause recessions. Rather, the near-term spread merely reflects something that market analysts already track closely--investors' expectations for monetary policy over the next several quarters and, by extension, the economic conditions driving those expectations. While, measures of the long-term spread also impound this information, they are likely to be affected by other factors unimportant for forecasting recessions, which would likely degrade their forecasting power.6
Figure 2: Near-term Forward Spread and Market-Expected Paths of Short Rates
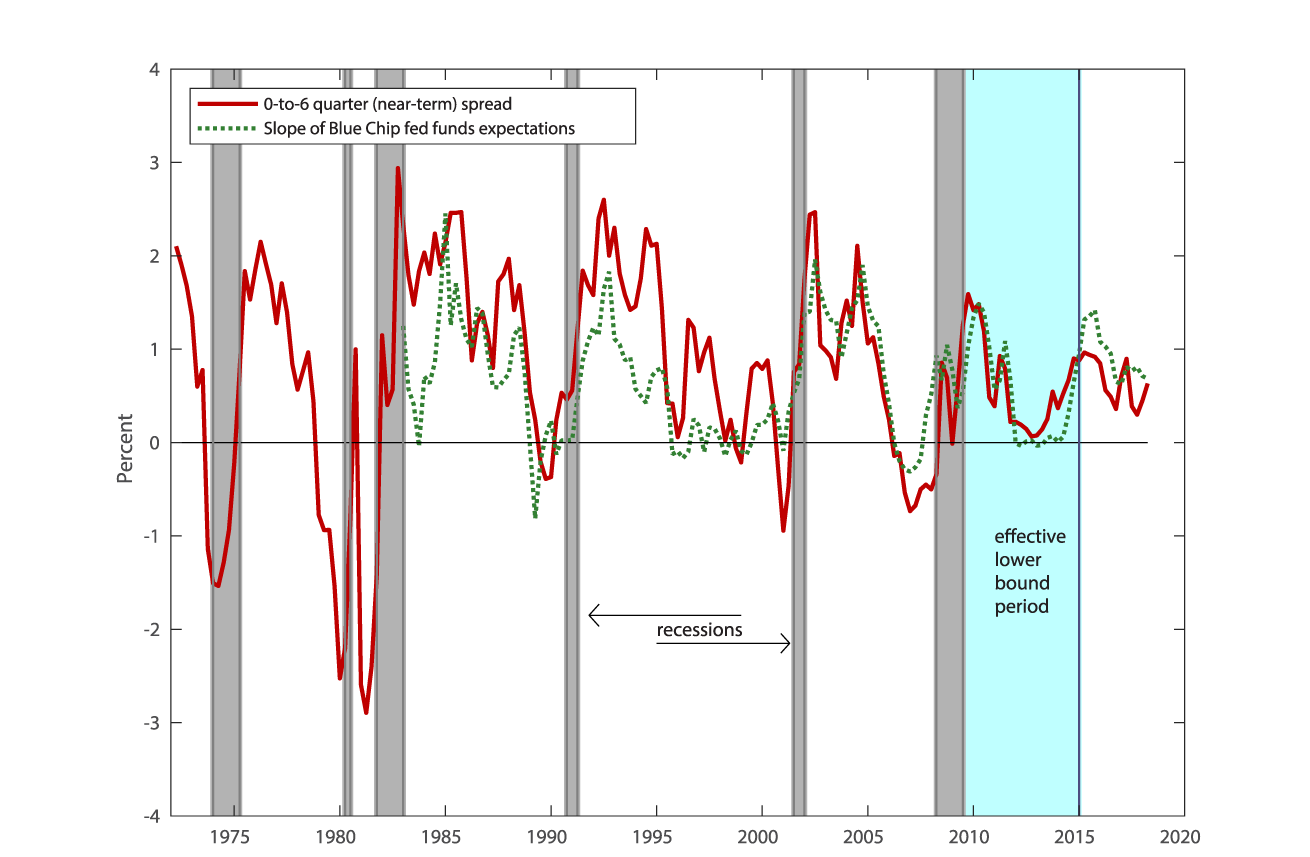
Source: Federal Reserve Bank of New York; Blue Chip Financial Forecasts; Federal Reserve Board staff estimates.
Results
Following the long-standing academic literature, our recession prediction analysis, is based on a probit model, estimated on data from 1972:Q1 to 2018:Q1. We estimate the probability of transition to recession within the four quarters ahead as a function of the near-term forward spread, a standard long-term yield spread and, in some specifications, added controls.7 The statistical results of our primary specification are shown in the first column of Table 1. In this, specification (labeled spec (1)), the near-term forward spread is highly significant; all else being equal, when it falls from its mean level by one standard deviation (about 80 basis points) the probability of recession increases by 35 percentage points. In contrast, the estimated effect of the competing long-term spread on the probability of recession is economically small and not statistically different from zero. Figure 3 shows the fitted conditional probabilities of recession from our primary specification (red line) compared to those from a more conventional model estimated using only the long-term spread (blue line). Generally, our model exhibits somewhat steeper spikes before recessions, indicating a sharper prediction. Perhaps most notably, it provides a clearer signal leading up to the most recent "Great Recession". Even so, there is admittedly little daylight between the two alternative models' most recent readings on the probability of recession in the year ahead. Both put that in the moderate range of 15 to 20 percent.8
Table 1: Near-term Spread versus Far-term spreads for Forecasting Recessions
| Explanatory Variables (Spreads) | Spec (1) | Spec (2) | Spec (3) | Spec (4) | Spec (5) | |
|---|---|---|---|---|---|---|
| 6 Quarter Forward - 1 Quarter T-bill | Sensitivity | 0.35 | 0.32 | 0.26 | 0.38 | 0.43 |
| pval | (<0.01) | (0.04) | (0.18) | (<0.01) | (<0.01) | |
| 10 Year Yield - 2 Year Yield | Sensitivity | 0.06 | ||||
| pval | (0.43) | |||||
| 10 Year Yield -1 Year Yield | Sensitivity | 0.07 | ||||
| pval | (0.45) | |||||
| 10 Year Yield - 1 Quarter T-bill | Sensitivity | 0.11 | ||||
| pval | (0.46) | |||||
| 40 Quarter Forward - 6 Quarter Forward | Sensitivity | 0.08 | 0.13 | |||
| pval | (0.25) | (0.20) | ||||
| Other Controls? | No | No | No | No | Yes | |
Notes: Data are quarterly 1972:Q1-2018:Q1. Results are for probit regressions in which the dependent variable is an indicator equal to 1 if the economy transitions to a recession 1, 2, 3, or 4 quarters ahead. Sensitivity is defined as the change in the estimated probability of recession when the explanatory variable falls by one standard deviation from its unconditional mean value, while the other explanatory variables remain at their unconditional means. The rows labeled pval report the bootstrapped significance level for a Wald test that the coefficient for the variable is significantly different from zero (bootstrapped under null hypothesis that the coefficient for that variable is zero). Controls, when included, are the excess bond premium and the nominal 90-day Treasury bill rate.
Sources: Federal Reserve Bank of New York; Federal Reserve Board staff estimates.
Returning to Table 1, we examine the robustness of our initial result by running a number of additional specifications. The second and third columns show results when we use alternative candidates for the long-term spread, the 10-year minus 1-year and the 10-year minus 3-month spreads. The latter choice overlaps more with our near-term spread, and is thus more highly correlated with the near-term spread. In this case, the hypothesis that the near-term spread has no marginal effect can only be rejected at the 14 percent significance level, though we can still easily accept the hypothesis that the long-term spread has zero marginal effect.
Figure 3: Estimated Recession Probabilities
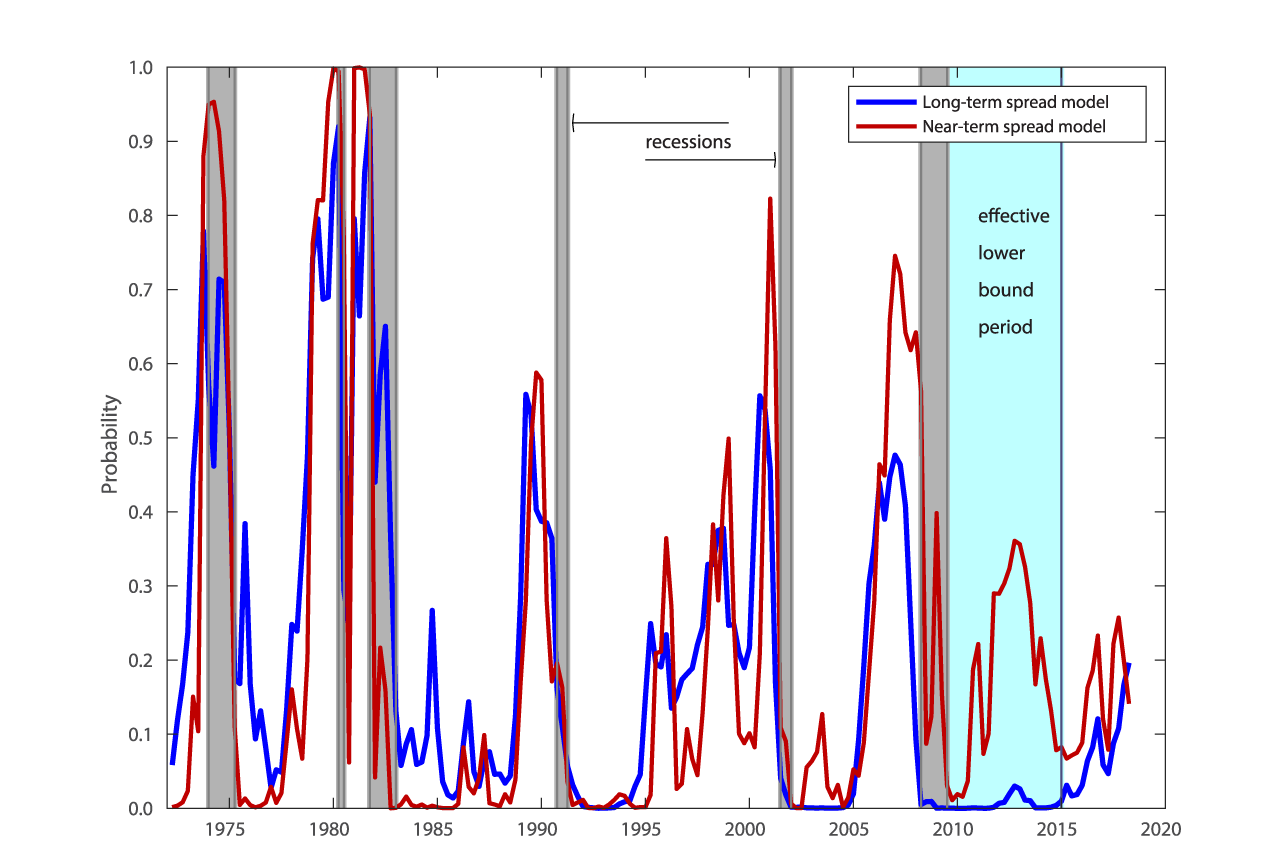
Source: Federal Reserve Bank of New York; Federal Reserve Board staff estimates.
These results suggest that perhaps a better approach to testing whether there is additional information in the term structure beyond six quarters would be to instead include the 6-40 quarter forward spread, which is the complement to (i.e. does not overlap with) our near-term spread. Together, they span the slope of forward rates out to 10 years. In this specification (spec (4)), we again definitively reject the hypothesis that there is additional information in the term structure beyond what is contained in the near-term spread. In the final column (spec (5)), we take spec (4) and add two control variables, the "excess bond premium" from Gilchrist and Zakrajsek (2012) and the nominal 90-day Treasury bill rate. Though not shown, the excess bond premium coefficient is highly significant, but its inclusion does not result in any diminution of the coefficient on the near-term forward spread.
Finally, we note that the dominance of the near-term spread for forecasting economic activity is not limited to our probit framework and other modeling choices. Appendix Table 1 demonstrates that, when simply forecasting four-quarter ahead real GDP growth in a plain vanilla regression setting, the near term-spread is again a more powerful predictor than all the long-term spreads we tested.
Conclusion
The narrow lesson to take away from this exercise is that the current near-term forward spread, which arguably serves as a proxy for market expectations of Federal Reserve policy, indicates the market is putting fairly low odds on a rate cut over the next four quarters. Unlike far-term yield spreads, the near-term forward spread has not been trending down in recent years, and survey-based measures of longer-term expectations for short term interest rates show no sign of an expected inversion.9 More generally, our findings do not support the practice of appealing to the long-term spread for a different signal about the prospects for year-ahead economic performance. A more subtle suggestion from our analysis is that the predictability of recessions by the near-term spread would appear to be a case of "reverse causality." That is, the near-term spread may only predict recessions because it impounds expectations that market participants have already formed.
References
Michael D. Bauer and Thomas M. Mertens (2018), "Economic Forecasts with the Yield Curve," FRBSF Economic Letter 2018-07 (San Francisco: Federal Reserve Bank of San Francisco, March 5)
Estrella, A. and F. S. Mishkin (1998), "Predicting U.S. Recessions: Financial Variables as Leading Indicators," Review of Economics and Statistics 80(1), pp. 45-61.
Harvey, Campbell, 1986, “Recovering Expectations of Consumption Growth from an Equilibrium Model of the Term Structure of Interest Rates,” Ph.D. dissertation, University of Chicago.
Simon Gilchrist and Egon Zakrajsek (2012), "Credit Spreads and Business Cycle Fluctuations," American Economic Review, vol. 102 (June), pp. 1692–720.
Peter Johansson and Andrew Meldrum (2018), "Predicting Recession Probabilities Using the Slope of the Yield Curve," FEDS Notes (Washington: Board of Governors of the Federal Reserve System, March 1).
Rudebusch, Glenn D., and John C. Williams. 2009. "Forecasting Recessions: The Puzzle of the Enduring Power of the Yield Curve." Journal of Business and Economic Statistics 27(4), pp. 492–503.
Appendix Table 1: Near-term Spread vs Far-term Spreads for Forecasting GDP Growth
| Explanatory Variables (Spreads) | Spec (1) | Spec (2) | Spec (3) | Spec (4) | Spec (5) | |
|---|---|---|---|---|---|---|
| 6 Quarter Forward - 1 Quarter T-bill | Coef | 1.35 | 1.43 | 1.69 | 1.23 | 1.22 |
| pval | (<0.01) | (<0.01) | (<0.01) | (<0.01) | (<0.01) | |
| 10 Year Yield - 2 Year Yield | Coef | -0.40 | ||||
| pval | (0.15) | |||||
| 10 Year Yield - 1 Year Yield | Coef | -0.36 | ||||
| pval | (0.16) | |||||
| 10 Year Yield - 1 Quarter T-bill | Coef | -0.46 | ||||
| pval | (0.12) | |||||
| 40 Quarter Forward - 6 Quarter Forward | Coef | -0.21 | -0.09 | |||
| pval | (0.16) | (0.37) | ||||
| Other Controls | Growth | Growth | Growth | Growth | Growth, EBP, Short Rate | |
Notes: Data are quarterly 1972:Q1-2018:Q1. Results are for OLS regression coefficients in which the dependent variable four-quarter ahead real GDP growth. The rows labeled pval report the bootstrapped significance level for the coefficient (significance levels are bootstrapped under null hypothesis that the coefficient for the spread variables are zero, but predictability due to the controls is preserved). In the rows labeled "Controls," "growth" refers to GDP growth, "EBP" refers to the excess bond premium, and "short rate" refers to the three-month nominal Treasury bill rate.
Sources: Federal Reserve Bank of New York; Federal Reserve Board staff estimates.
1. Board of Governors of the Federal Reserve System. The views in this document do not necessarily reflect those of the Federal Reserve System, its Board of Governors, or staff. Return to text
2. Campbell Harvey in his 1986 dissertation pioneered the literature which documents that recession prediction model linked to the term structure of interest rates have substantial empirical success. Many studies over the past couple decades have documented this predictive power of the term structure, such as Estrella, and. Mishkin (1998) and Rudebush and Williams (2009), to name just a couple. Recently, Bauer and Mertens (2018) and Johansson and Meldrum (2018) show that the predictive power of term spreads remains undiminished of late, and is robust to the inclusion of additional predictors. Return to text
3. In some sense, our approach echoes the philosophy driving the Johansson-Meldrum (2018) analysis, where the signal embedded in the term spread is decomposed by examining the three principal components of yield curve. Return to text
4. The current level of the forward rate 6 quarters ahead is inferred from the yields to maturity on Treasury notes maturing 6 quarters from now and 7 quarters from now. In particular, it is the rate that would have to be earned on a 3-month Treasury bill purchased six quarters from now that would equate the results from two investment strategies: simply investing in a Treasury note that matures 7 quarters from now versus investing in a Treasury note that matures 6 quarters from now and reinvesting proceeds in that 3-month Treasury bill. Return to text
5. Starting in 1997, the survey-based measure is the Blue Chip expected federal funds rate 5-quarters ahead minus the Treasury bill yield. Prior to 1997, the 5-quarter ahead forecast is not available, so a 4-quarter ahead forecast scaled by a factor of 5/4 is used instead. Return to text
6. One such factor could be a secular decline in the inflation risk premium on long-term bonds. Return to text
7. One minor departure from the most previous studies is that we drop from the estimation any observations in which the economy was already in recession in the previous quarter. This choice enables us to estimate the probability of transition into recession, rather than the probability of either transitioning to or remaining in recession. Arguably, one should allow for a somewhat different model for estimating the probability of remaining in recession. However, our main results are not sensitive to this choice. We also drop observations during which the effective lower bound was binding, following other recent studies. Return to text
8. The near-term spread model forecasts a higher probability of recession during the effective lower bound period because the near-term spread was pegged near zero, and presumably bounded from above by forward guidance by the FOMC. The near-term spread thus arguably was not reflective of expectations of macroeconomic performance in this period. Return to text
9. In the 2018:Q2 Survey of Professional Forecasters, the mean forecasts for the current year, and the one-, two-, and three-year ahead annual average rate for the three-month Treasury bill are 1.9, 2.6, 2.9, and 2.9 percent, respectively. Return to text
10. In daily data from 1971-2018, the two measures differ by more than 1 basis point on only 0.13 percent of days. Return to text
Note: This Note was edited Aug. 5, 2022 to include complete attributions for several references to other research.
Engstrom, Eric, and Steve Sharpe (2018). "(Don't Fear) The Yield Curve," FEDS Notes. Washington: Board of Governors of the Federal Reserve System, June 28, 2018, https://doi.org/10.17016/2380-7172.2212.
Disclaimer: FEDS Notes are articles in which Board staff offer their own views and present analysis on a range of topics in economics and finance. These articles are shorter and less technically oriented than FEDS Working Papers and IFDP papers.