FEDS Notes
February 12, 2026
Downside and Upside Economic Uncertainty
Over the last year, many forecasts have called out a slowdown in the U.S. economy driven mainly by heightened trade and geopolitical tensions. Instead, growth in the United States has remained quite solid. Real U.S. gross domestic product (GDP) grew at a strong annual rate of 3.8 percent in the second quarter of 2025. Moreover, the IMF's October 2025 World Economic Outlook projected a still-solid 2.0 percent pace of growth for 2025 as a whole.2 In this note, we use a data-driven approach to explore three key questions related to the U.S. economy: (1) whether econometric-based forecasts deviated from observed data in 2025 more than in previous years, (2) whether economic unpredictability in 2025 was driven by trade-related indicators, and (3) whether these deviations are mostly due to better-than-expected news.
We look beyond individual survey-based forecasts and examine how predictable the economy is when forecasts are generated from a large, systematic information set built from a wide range of macroeconomic and financial data. To do so, we calculate a measure of Real Economic Uncertainty (REU) introduced by Jurado, Ludvigson, and Ng (2015), which quantifies how difficult it is to forecast a wide range of macroeconomic variables based on a large set of domestic and global indicators used as predictors. High REU corresponds to periods when even rich econometric models produce unusually volatile forecast errors. We propose two innovations to the standard aggregate REU framework. First, we construct sectoral measures of real economic uncertainty to assess whether trade or other (non-trade) aspects of the economy drive the recent heightened economic uncertainty. Second, to assess whether economic forecasts miss the observed values in a particular direction, we decompose REU into its upside and downside components, which are associated with economic outcomes that are "better-" and "worse-than-expected," respectively.
Measuring Real Economic Uncertainty
Following Jurado, Ludvigson, and Ng (2015), to calculate aggregate REU, we start from a large dataset of U.S. macroeconomic time series. These variables include indicators for output, inflation, investment, consumption, housing, employment, and trade flows. For each variable, we make a forecast conditional on a rich set of over 200 domestic and global predictors, capturing the public information forecasters would reasonably use at the time.3 We then examine the resulting surprises or forecast errors, which are the difference between the predicted and the observed values of each economic variable. When the conditional variation of those errors is high, even after conditioning on the rich set of predictors, the series is considered difficult to forecast and, therefore, more uncertain.
We group variables into categories to construct sectoral measures of real economic uncertainty. This allows us to calculate not only an aggregate measure of REU but also measures for specific aspects of the economy, including trade. The trade component of REU is constructed from net-export series (for total goods and services and subcategories), rather than separate import and export series. Trade variables account for roughly a fifth of the total number of variables used to calculate aggregate REU. For the forecasts of trade-related series, we include additional predictors that proxy for firms' frontloading of imports and exports around anticipated tariff changes or other known trade events (de Soyres, Goernemann, and Machol, 2025). These predictors include survey-based measures of firms' new orders, production, supplier deliveries, inventories, and related indicators of demand and supply conditions from the National Association of Purchasing Managers (NAPM). Therefore, our trade uncertainty measure captures the remaining unpredictability in trade outcomes after accounting for these anticipatory frontloading factors.
Upside and Downside Components of Uncertainty
By construction, REU does not distinguish between positive and negative surprises, treating each as contributing to uncertainty symmetrically. Depending on the nature of each variable, positive and negative surprises could be generally considered either as better- or worse-than-expected news. For instance, higher-than-expected inflation is generally considered negative news, while higher-than-expected output is generally considered positive news. To distinguish positive from negative surprises, we further split real economic uncertainty into components depending on the direction of the surprise.
To facilitate the interpretation of the components of REU and homogenize the characterization of forecast surprises into better- or worse-than-expected, for each series in our dataset, we first determine whether higher values are typically associated with stronger or weaker overall activity. To do so, we look at the historical correlation between each series and a broad summary index of U.S. real activity, such as the Chicago Fed National Activity Index. For variables that unconditionally move positively with that index, higher-than-expected realizations are classified as upside or better-than-expected surprises. Conversely, for variables that unconditionally move inversely with real activity, such as inflation or unemployment, higher-than-expected realizations are treated as downside or worse-than-expected surprises.4 We can then compute separate measures of uncertainty based on upside and downside forecast errors and aggregate them across sectors.
What is Driving Economic Uncertainty in 2025?
Figure 1 plots total real economic uncertainty, the black line, since 2020 decomposed into its upside and downside components, the blue and orange bars, respectively. Not surprisingly, REU jumped at the onset of the Covid-19 pandemic and stayed well above its historical mean for several years. Throughout the period of elevated uncertainty in the aftermath of the pandemic, the contribution of upside and downside uncertainty remains somewhat constant at around 50 percent. REU has increased moderately since mid-2024, although the proportion of upside to downside uncertainty since then has remained similar at around 50 percent. Thus, over the period considered, REU reflects a balanced mix of better-than-expected and worse-than-expected outcomes. On aggregate, then, the evidence does not suggest that economic forecasts were overly pessimistic in 2025.
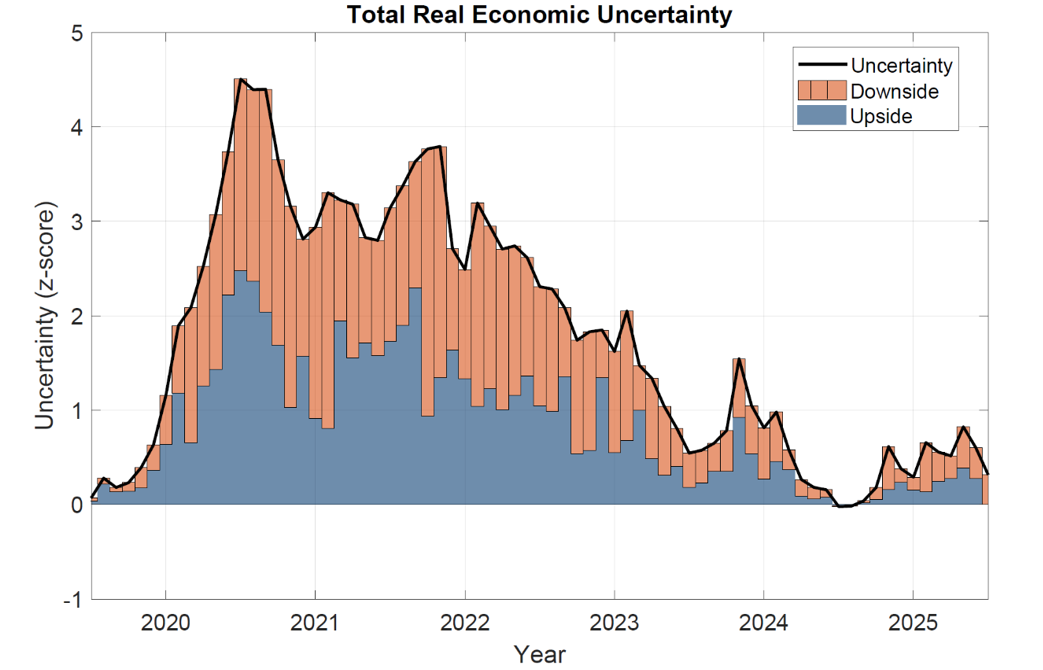
Note: The figure plots the total REU (the black contour line) and its upside and downside components in blue (bottom) and orange (top) bars, respectively. The REU is standardized to have zero mean and unit standard deviation over the sample 1963:01 to 2025:06.
Figure 2 splits REU into its sectoral components; in particular, into uncertainty about trade flows in the left panel and uncertainty about all other (non-trade) aspects of the economy in the right panel. The recent runup in total REU is dominated by upside uncertainty about trade, which suggests that realized trade flows in 2025 have repeatedly deviated from the model's forecasts even after accounting for firms' frontloading around anticipated tariff changes. Moreover, almost the entirety of the gap between forecast and observed trade flows is on the upside, which implies that net exports have been higher than the econometric model anticipates in 2025. This evidence suggests that trade-related uncertainty has been more pessimistic about the resilience of trade flows than in previous episodes.
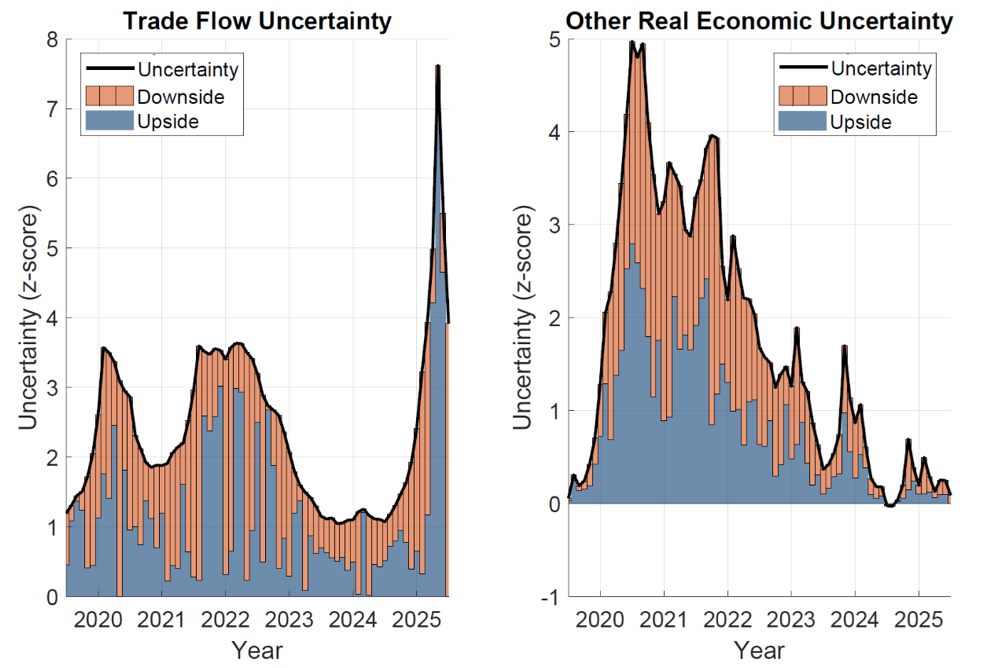
Note: The figure plots the sectoral economic uncertainty (the black contour line), and its upside and downside components in blue (bottom) and orange (top) bars, respectively. The left panel shows trade flow uncertainty, and the right panel shows the aggregate uncertainty from all sectors except trade. Both measures are standardized to have zero mean and unit standard deviation over the sample 1963:01 to 2025:06.
Uncertainty about all other non-trade aspects of the economy tells a different story. This uncertainty was high relative to historic standards in the early Covid period, with sizable contributions from both upside and downside surprises and declined steadily until reaching levels close to its historical average by mid-2024. Since then, both upside and downside components in non-trade economic uncertainty have been small, indicating that forecast errors for variables other than trade have been at historic lows and that both upside and downside uncertainties are roughly balanced.
Table 1 digs deeper into the upside-to-downside uncertainty decomposition for each group of variables in the aggregate REU index. For each category, we report the share of series with upside surprises in 2025. Trade flow uncertainty stands out: roughly three-quarters of trade series fall into this group, far more than for any other category. Thus, as also suggested by the evidence in Figure 2, the recent rise in aggregate REU is driven largely by upside trade uncertainty. Uncertainty about prices and inflation ranks second, with a bit more than half of the series in that category exhibiting upside uncertainty, indicating that over half of underlying inflation series are lower than the model's forecasts. In contrast, uncertainty about labor markets and housing have the lowest shares of downside uncertainty, indicating that for these sectors, data-driven forecasts were, on average, too optimistic. This pattern is in line with the slowing in job growth and the cooling of housing activity, even as overall GDP growth has remained resilient. Similarly, for output, the proportion of over-pessimistic series is about 38 percent. For context, during previous recessions, including those in 2001 and 2008, the proportion of over-pessimistic series falls to around 20-25 percent, and during strong expansionary periods like the late 1990s, this proportion rises to approximately 60-65 percent. This suggests that, from the perspective of our data-driven approach, forecasts for output in 2025 were neither excessively pessimistic nor optimistic relative to historical patterns.
Table 1: Upside Surprises
| Category | % of Upside Surprises |
|---|---|
| Trade Flows | 76.80% |
| Prices/Inflation | 56.40% |
| Output/Production | 37.70% |
| Investment | 34.00% |
| Consumption/Retail | 33.80% |
| Housing | 32.10% |
| Employment | 22.70% |
Note: The table reports the fraction of underlying variables with upside surprises in the first half of 2025. Upside surprises are defined as positive forecast errors (higher than expected) if the variable is positively correlated with the Chicago Fed national activity index, or negative forecast errors if the variable is negatively correlated, over the full sample spanning 1963:01 to 2025:06.
Conclusion
In this note, we assess whether standard data-driven forecasting models are systematically under- or over-predicting economic outcomes in the U.S. economy in 2025. We find that, in 2025, the economy remained hard to predict overall, with aggregate real economic uncertainty still above pre-pandemic levels and above its historic mean. Over this period, elevated trade uncertainty was the main driver of the heightened REU, as uncertainty about all other non-trade aspects of the economy remained just slightly above its historical mean. Moreover, trade uncertainty was largely due to its upside component in 2025, reflecting generally positive surprises in trade flows (i.e., higher net exports) relative to model forecasts. In contrast, uncertainty about some other aspects of the economy showed a moderate tilt toward downside uncertainty, particularly in labor and housing markets, though as noted earlier, the magnitude of deviations between realized and forecast values in these sectors is not unusual by historical standards.
Reference
de Soyres, François, Nils Goernemann, and Chris Machol (2025): Racing Against Tariffs: Global Impacts of Frontloading. FEDS Note.
Jurado, Kyle, Sydney C. Ludvigson, and Serena Ng (2015): Measuring Uncertainty, American Economic Review, 105(3): 1177-1216
Ng, Serena (2021): Modeling Macroeconomic Variations After COVID-19, NBER Working Paper No. 29060
1. The analysis and conclusions set forth are those of the authors and do not indicate concurrence by other members of the research staff or the Board of Governors. Return to text
2. Source: www.imf.org/en/publications/weo/issues/2025/10/14/world-economic-outlook-october-2025. Return to text
3. Following Jurado, Ludvigson, and Ng (2015), we use a dynamic factor model to form a forecast for each variable. To capture potential regime shifts and nonlinearity in the forecasting equation during the Covid-19 pandemic, we also include a set of Covid-specific factors following Ng (2021). Return to text
4. Using unconditional correlations with a broad activity index provides a simple but consistent rule to classify upside and downside surprises across many variables. However, it is worth noting that for some variables, such as inflation, the correlation with economic activity may be time varying and depend on the nature of the underlying shock (e.g., demand versus supply). Therefore, this classification should be interpreted as a reduced-form reference rather than a shock-specific mapping. Return to text
Londono, Juan M., and Sai Ma (2026). "Downside and Upside Economic Uncertainty," FEDS Notes. Washington: Board of Governors of the Federal Reserve System, February 12, 2026, https://doi.org/10.17016/2380-7172.3993.
Disclaimer: FEDS Notes are articles in which Board staff offer their own views and present analysis on a range of topics in economics and finance. These articles are shorter and less technically oriented than FEDS Working Papers and IFDP papers.