FEDS Notes
July 01, 2022
Economic Resilience in the COVID-19 Pandemic
Emily Highkin and Eva Van Leemput
Introduction
The global spread of COVID-19 virus in early 2020, and the measures taken to contain it pushed the global economy into a deep contraction. As illustrated in Figure 1, global GDP fell 10.5 percent below its pre-pandemic level in the second quarter of 2020. However, as Figure 1 also highlights, subsequent waves of the virus did not have the same damaging effects. For example, the second global wave of coronavirus in the fourth quarter of 2020, and the accompanying social distancing restrictions, did not result in the same contraction observed in the second quarter of 2020. In this note we investigate the sources of the observed abatement in economic damage due to the pandemic. Specifically, we study how the connections between the pandemic, government restrictions, and activity have changed since the crisis began.
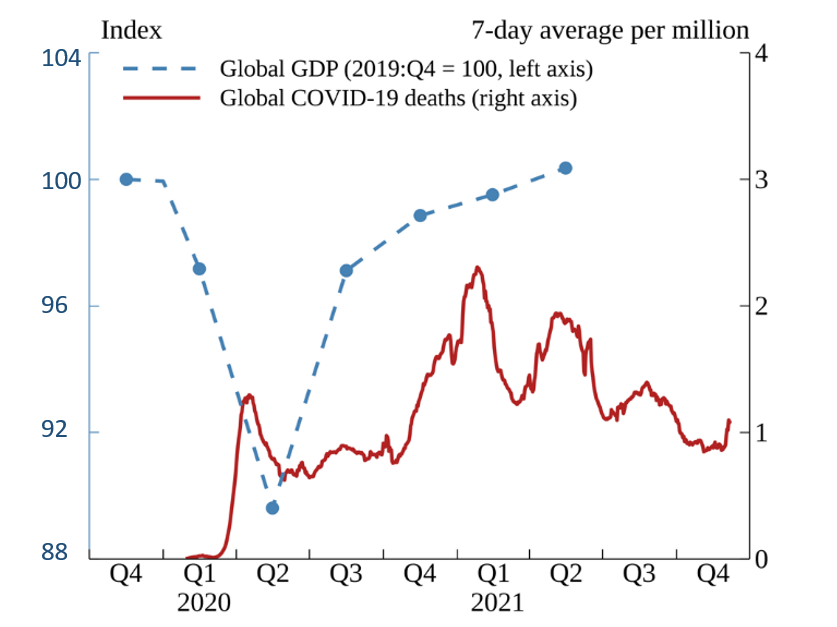
Note: The global aggregates include Argentina, Australia, Brazil, Canada, Chile, China, Colombia, France, Germany, Hong Kong, India, Indonesia, Israel, Italy, Japan, Malaysia, Mexico, New Zealand, the Philippines, Russia, Saudi Arabia, Singapore, South Korea, Spain, Sweden, Switzerland, Taiwan, Thailand, the United Kingdom, the United States, and Vietnam.
Sources: Federal Reserve Board Staff Calculations; Blavatnik School of Government, University of Oxford; Haver Analytics.
Disentangling the connection between the pandemic and activity
The Pandemic and Government Restrictions
First, we examine how government responses to the pandemic have evolved since early 2020. Figure 2 plots global daily new COVID-19 cases and deaths against the severity of government restrictions as measured by the Oxford Stringency Index (OSI).1 Governments around the world put in place severe social distancing restrictions towards the end of the first quarter of 2020 and eased them throughout the summer as new cases and deaths related to COVID-19 notably subsided. That said, as the blue dashed lines highlight, global restrictions intensified again in the winter of 2020 amid a severe second wave, and again in April 2021. However, neither resurgence induced the same level of restrictions as observed in early 2020. All told, this simple comparison highlights that the lockdown measures imposed to control the spread of the virus lessened in relative severity over time.
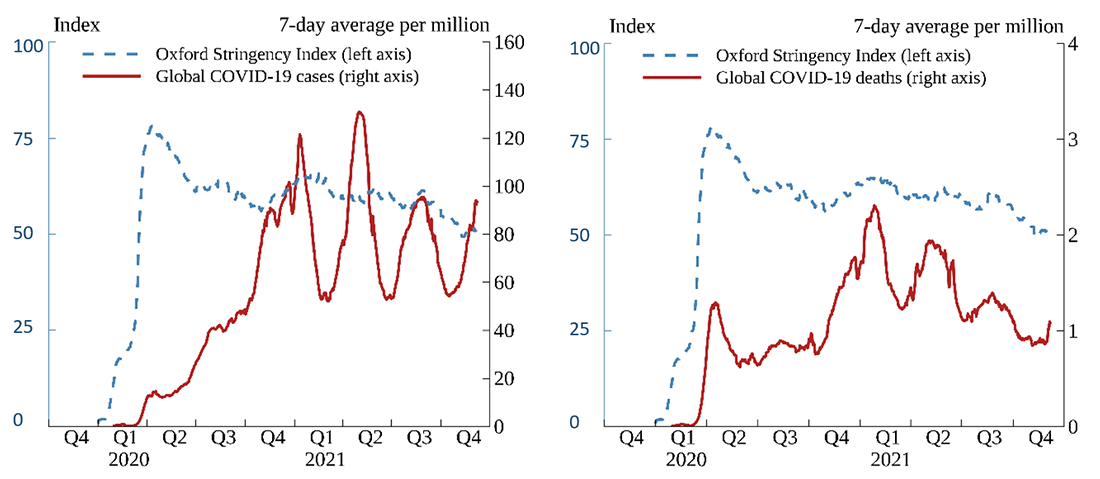
Note: The global aggregates include Argentina, Australia, Brazil, Canada, Chile, China, Colombia, France, Germany, Hong Kong, India, Indonesia, Israel, Italy, Japan, Malaysia, Mexico, New Zealand, the Philippines, Russia, Saudi Arabia, Singapore, South Korea, Spain, Sweden, Switzerland, Taiwan, Thailand, the United Kingdom, the United States, and Vietnam.
Sources: Blavatnik School of Government, University of Oxford; Center for Systems Science and Engineering at Johns Hopkins University.
Government Restrictions and Mobility
Next, we examine how these government restrictions impacted populations' behavior and how this relationship has changed since the first COVID-19 wave. To this end, we regress the level of mobility as measured by Google mobility data, which tracks smartphone movements, on the OSI level. The red line in Figure 3 is the regression line for the second quarter of 2020. Higher levels of social distancing restrictions across the world are negatively correlated with mobility levels, as tighter restrictions either prohibit or discourage people from going to work, going to restaurants, or participating in other activities.
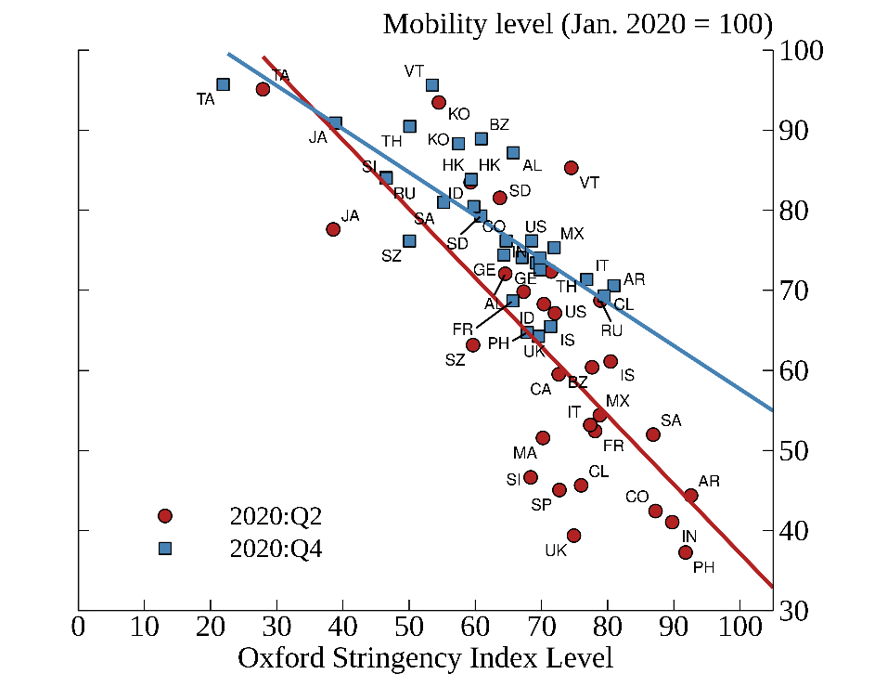
Note: We include 30 countries: AR is Argentina, AL is Australia, BZ is Brazil, CA is Canada, CL is Chile, CO is Colombia, FR is France, GE is Germany, HK is Hong Kong, IN is India, ID is Indonesia, IS is Israel, IT is Italy, JA is Japan, KO is South Korea, MA is Malaysia, MX is Mexico, NZ is New Zealand, PH is the Philippines, RU is Russia, SA is Saudi Arabia, SD is Sweden, SI is Singapore, SP is Spain, SZ is Switzerland, TA is Taiwan, TH is Thailand, UK is the United Kingdom, US is the United States, and VT is Vietnam. China is excluded because Google does not report mobility for China. Mobility is measured as a daily deviation from its level in early January 2020. The mobility index is the unweighted average of "retail and recreation" and "workplace" mobility.
The regression details are:
2020:Q2: $$y = 123.11 – 0.86x$$ ; $$R^2 = 0.56$$ ; $$t-statistic = -5.84$$
2020:Q4: $$y = 111.82 – 0.54x$$ ; $$R^2 = 0.58$$ ; $$t-statistic = -6.10$$
The difference in slopes in 2020:Q2 and 2020:Q4 is statistically significant at the 1 percent confidence interval.
Sources: Federal Reserve Board Staff Calculations, Blavatnik School of Government, University of Oxford; Google Community Mobility Reports.
To analyze how this relationship evolved, we run the same regression using data for the fourth quarter of 2020 (the blue line in Figure 3).2 There are two main takeaways. First, the relationship between restrictions and mobility remains negative: consumers again reduced their movements either voluntarily or due to mandates. Second, the slope of the regression line flattened. All else equal, for the same level of restrictions imposed, the percentage decline in mobility was much smaller in the fourth quarter of 2020 than in the second. This change in behavior could be driven by many factors including less voluntary social distancing due to mask-wearing.
Mobility and Economic Activity
Finally, we study the relationship between mobility and economic activity, and how it has changed across the first and second global COVID-19 waves. Figure 4 plots the level of real GDP against the level of mobility with both variables indexed to pre-pandemic levels. The red and blue lines are regression lines for the observations from the second and fourth quarters of 2020, respectively. There are two lessons drawn. First, economies exhibited higher resilience to changes in mobility in the fourth quarter, as evidenced by the smaller slope of the blue lines versus the red lines. This implies that compared to the first half of last year the same change in mobility is accompanied by a smaller change in GDP. This higher resilience of economic activity could reflect various developments including less uncertainty about income or a drawdown of excess savings. Second, economies are increasingly adaptive and are able to operate at a higher level for any given level of mobility, evidenced by the blue line's higher intercept. Increasingly prevalent behaviors such as online shopping, virtual medical care, or simply attaining higher productivity at home exemplify the heightened adaptation suggested by our model.
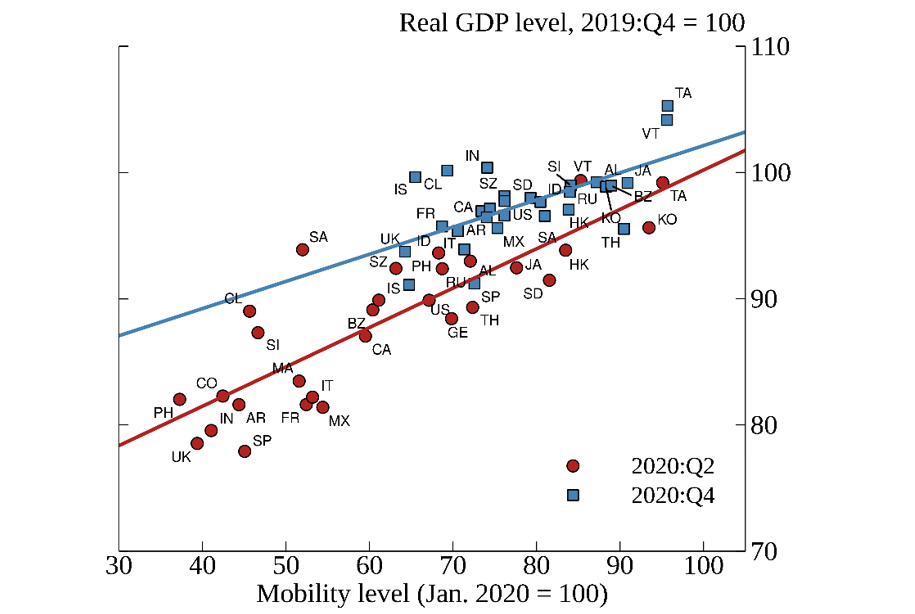
Note: We include 30 countries: AR is Argentina, AL is Australia, BZ is Brazil, CA is Canada, CL is Chile, CO is Colombia, FR is France, GE is Germany, HK is Hong Kong, IN is India, ID is Indonesia, IS is Israel, IT is Italy, JA is Japan, KO is South Korea, MA is Malaysia, MX is Mexico, NZ is New Zealand, PH is the Philippines, RU is Russia, SA is Saudi Arabia, SD is Sweden, SI is Singapore, SP is Spain, SZ is Switzerland, TA is Taiwan, TH is Thailand, UK is the United Kingdom, US is the United States, and VT is Vietnam. China is excluded because Google does not report mobility for China. Mobility is measured as a daily deviation from its level in early January 2020. The mobility index is the unweighted average of "retail and recreation" and "workplace" mobility.
The regression details are:
2020:Q2: $$y=68.7 + 0.31x$$ ; $$R^2 = 0.74$$ ; $$t-statistic = 8.75$$
2020:Q4: $$y=80.3 + 0.22x$$ ; $$R^2 = 0.40$$ ; $$t-statistic = 4.20$$
The difference in slopes in 2020:Q2 and 2020:Q4 is statistically significant at the 1 percent confidence interval.
Sources: Federal Reserve Board Staff Calculations; Google Community Mobility Reports; Haver Analytics.
Conclusion
In this note, we investigated the sources of the observed decline in economic damage from the pandemic and its related social distancing restrictions by comparing the COVID-19 waves in second and the fourth quarters of 2020. We provide evidence that three main factors changed this relationship. First, we find that social distancing restrictions were less severe during the second wave, which mitigated economic damage. Second, we show that consumer's mobility elasticity to the imposition of social distancing restrictions markedly decreased in the second wave. In other words, they did not reduce their movements, either voluntarily or mandated, by as much as observed in the first wave for the same level of imposed social distancing restrictions. Finally, we provide evidence that increased adaptation of the economy to the mobility restrictions imposed by the virus mitigated the damaging effects on economic activity globally.
1. The Oxford Stringency Index is a COVID-19 Government Response Tracker that captures government restrictions around 9 dimensions, including workplace closures, school closures, restrictions on movement.
Thomas Hale, Noam Angrist, Rafael Goldszmidt, Beatriz Kira, Anna Petherick, Toby Phillips, Samuel Webster, Emily Cameron-Blake, Laura Hallas, Saptarshi Majumdar, and Helen Tatlow. (2021). "A global panel database of pandemic policies (Oxford COVID-19 Government Response Tracker), https://www.nature.com/articles/s41562-021-01079-8." Nature Human Behaviour. Return to text
2. In this note, we limit to focus on the connections between the pandemic, government restrictions, and activity to the first and second COVID-19 wave, as vaccines had not become widely available yet, which allows for a more direct comparison. Return to text
Highkin, Emily, and Eva Van Leemput (2022). "Economic Resilience in the COVID-19 Pandemic," FEDS Notes. Washington: Board of Governors of the Federal Reserve System, July 01, 2022, https://doi.org/10.17016/2380-7172.3060.
Disclaimer: FEDS Notes are articles in which Board staff offer their own views and present analysis on a range of topics in economics and finance. These articles are shorter and less technically oriented than FEDS Working Papers and IFDP papers.