FEDS Notes
September 24, 2025
Examining the Relationship Between Loan Pricing and Credit Risk
Azamat Abdymomunov, Ronel Elul, Doriana Ruffino, and James Wang1
Introduction
In this note, we focus on examining bank lenders' pricing of credit risk, and how higher loan interest rates may serve as compensation for higher credit losses. First, we study the extent to which loan-level and regional-level risk is priced at the product level. Second, we analyze how risk at the bank level, and across a business cycle, is compensated for by higher interest income. Our study builds on and extends previous work showing that expected credit risk is a key factor in loan pricing (e.g., Edelberg 2006). Moreover, our analysis is also relevant to understanding the impact of bank capital requirements on credit supply. Previous work (Acharya et al. 2018) has shown that banks raise interest rates for risky loans in response to the introduction of new risk-based capital requirements. To the extent that banks incorporate this risk into pricing, the potential impact of these higher capitalization requirements on credit supply to riskier borrowers may be mitigated.
Our analysis proceeds in three parts. First, we analyze the pricing of credit risk for two key types of loan portfolios, as examples. Using loan-level mortgage and supervisory data on credit card loans, we confirm that commonly used measures of credit risk, such as the loan's loan-to-value (LTV) ratio and the borrower's credit score, are highly predictive of loan pricing. However, while the correlation is high, there is still a great deal of variation in loan interest rates that remain unexplained. Second, we document that one source of residual interest rate variation can be attributed to geographic risk factors. We extend the analysis of Hurst et al. (2016) on the pricing of geographic risk in the residential mortgage market to the credit card market, and we confirm that geographic risk plays a role as well. However, we find that credit card interest rates appear to be less sensitive to geographic risk than mortgages.
Finally, we analyze pricing of total credit risk at the bank level. We demonstrate that banks with higher realized total credit losses are those that also report greater interest and fee income over an entire business cycle. Specifically, we find that a 1 percent increase in average net charge-offs is associated with a 0.6 percent increase in average interest and fee income. This indicates that higher charged interest and fee rates compensate for a portion of loan losses, inclusive of risks due to the loan level, regional level, and bank level, and across the business cycle.
In addition to expected credit risk, we note that the literature has also identified other factors that may affect loan pricing, such as: profitability (Martynova et al. 2020 and Bikker and Vervliet 2017), bank risk aversion (Camba-Mendez and Mongelli 2021), supervision and capital regulation (Acharya et al. 2018, Berrospide and Edge 2024, Pierret and Steri 2020, and Bahaj and Malherbe 2017), policy uncertainty (Bordo et al. 2016 and Ashraf and Shen 2019), and industry competitiveness (Valta 2012).
Pricing of Credit Risk: Product Level
We first consider how loan pricing varies with key predictors of default using loan-level data on interest rates, loan characteristics, and loan performance. We use data from two sources: ICE McDash mortgage servicer data for bank-held jumbo loans, and the supervisory Y-14M Credit Card collection. Both datasets contain a long panel of loan and borrower characteristics and performance data, which allows us to calibrate simple credit models of expected default. Specifically, our data samples comprise information on 1.25 million mortgage loans over the period from 2005 through 2024 and 284,914 credit card borrowers over the period from 2013 through 2024.
The literature on credit risk (e.g., Agarwal et al. 2018 and Ambrose et al. 2004) shows that credit card underwriting is heavily dependent on credit scores, while LTV ratios and credit scores are key determinants of mortgage pricing. We take these loan-level risk characteristics and develop simple logit default models based on these characteristics at origination. For mortgages, we include indicators for FICO score ranges at origination, LTV ranges at origination, and the origination year. For credit cards, we apply a similar model with linear and quadratic parametrizations of FICO score at origination and the origination year.2
In Figure 1, we plot the log of the expected default rate, predicted from our models of default, against the log of loan interest rate spread at origination, separately for mortgages and credit cards.3 The loan interest rate spread is defined as a spread between the loan interest rate and a benchmark market rate. Both panels of Figure 1 show a strong positive relationship between expected losses and pricing at origination, indicating that banks price loans to offset higher expected default risk. Both panels show a slight leveling-off of interest rates at higher levels of expected risk, which could be due to regulations such as usury or pricing limits (Rigbi 2013), as well as banks using credit limits or approved loan balances as non-price factors to adjust for increased risk. While including additional loan-level attributes could lead to more granularity in expected risk and an even stronger relationship between risk and pricing, many loan-level factors, such as prior delinquency, affect credit card underwriting through their effect on credit scores.
Figure 1. Relationship Between Origination Interest Rate Spread and Expected Default for Mortgages and Credit Cards
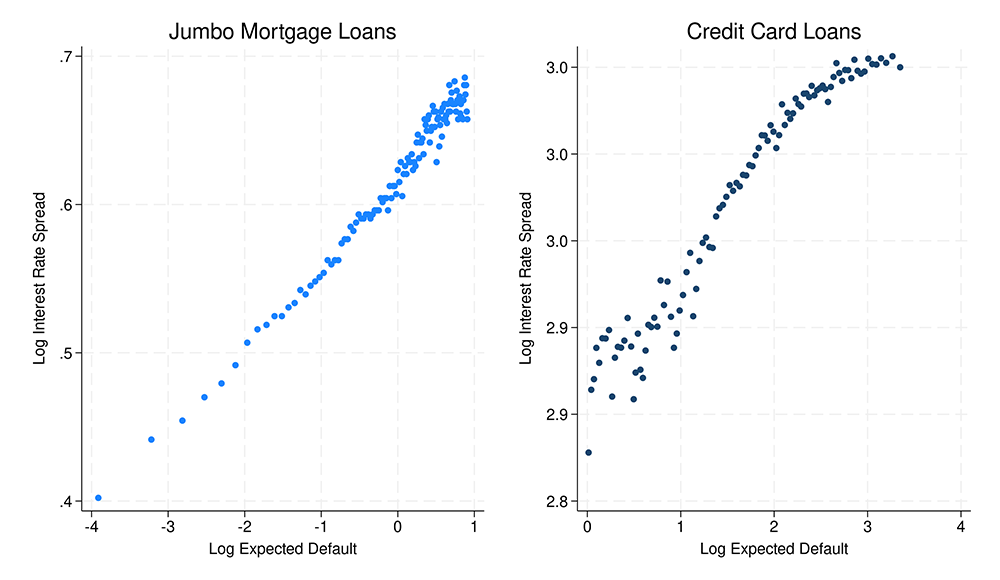
Note: Mortgage data is from the ICE McDash dataset for 1.25 million fixed-rate jumbo loans for the period 2005-2024. The Jumbo Mortgage Loans X axis is the bin-scatter of the log of predicted default from a model of mortgage defaults on loan attributes including indicators for ranges of credit score, LTV, and origination quarter. The interest spread is the origination interest rate over the 10-year treasury rate. Mortgage default captures adverse termination events such as foreclosures. Credit card data is for 284,914 credit card loans from supervisory Y-14M Credit Card schedule for the period 2013–2024. The Credit Card Loans X axis is the bin-scatter of the log of predicted default from a model of credit card defaults on loan attributes including linear and quadratic parametrizations of credit score and origination quarter. The interest spread is the origination purchase APR over the prime rate. Credit card default is defined as more than 90 days past due.
Source: ICE McDash Residential Mortgage Servicing Database, FR Y-14M Schedule D: Domestic Credit Card Data.
Conditional on loan-level expected credit risk, there is still a great deal of remaining variation in pricing. We next show that a portion of this can be attributed to risk factors common to the geographic level. Borrowers' ability (or willingness) to repay depends not only on the loan-level risk factors but also on other factors that may be common to their region, such as the expected severity of regional unemployment and housing price cycles.
Hurst et al. (2016) have shown that, in the absence of regulatory considerations that may constrain regional variation (such as for mortgages securitized by the government-sponsored enterprises), mortgage lenders do indeed price these regional risks. We verify this is also the case for the credit card market, following their methodology, by comparing interest rate residuals and regional delinquency rates.
Figure 2 compares the residuals of a pricing model given by the following:
$$$$ r_{ikt}=\alpha_0+\alpha_1X_{it}+\alpha_2D_t+\varepsilon_{ikt} $$$$
where $$r_{ikt}$$ is the credit card's APR at origination to borrower $$i$$, in three-digit zip code region $$k$$, and in quarter $$t$$. $$X_{it}$$ represents the borrower's credit score with a quadratic parametrization, and $$D_t$$ is a vector of year by quarter indicators.
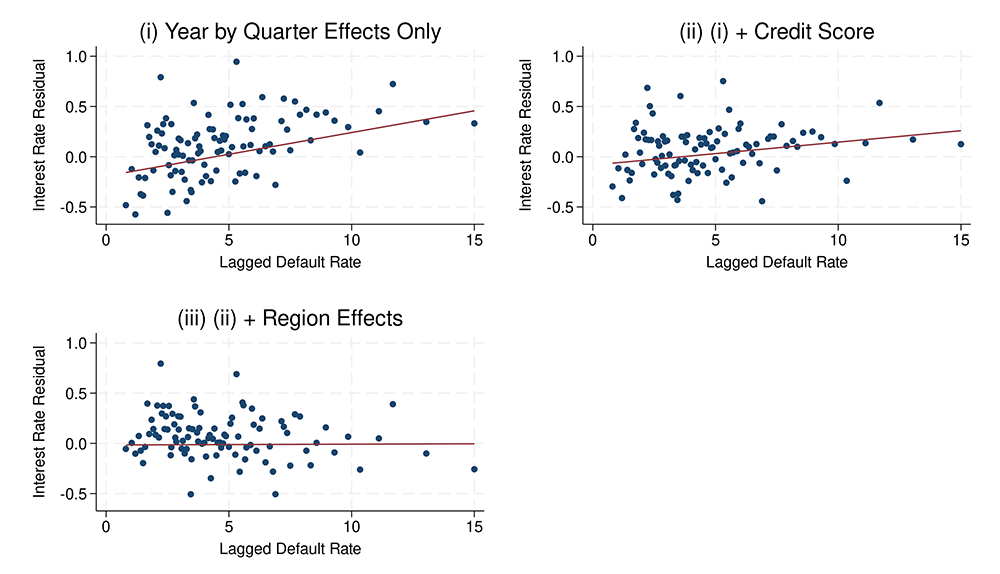
Note: Credit card data is for 284,914 credit card loans from the supervisory Y-14M Credit Card schedule for the period 2013–2024. Each point represents the median of a binned set of three-digit zip codes given by their average interest rate residual and lagged default rate in an observation quarter. The lagged default rate is the nine-quarter lagged default rate of all credit cards originated in the three-digit zip code within the last nine quarters that had defaulted by the observation quarter. The interest rate residual is the residuals from a model of credit card APR pricing on different sets of controls by panel. Panel (i) includes year by quarter of origination only. Panel (ii) adds in credit score linear and quadratic effects. Panel (iii) adds in three-digit zip code effects. Region quarter pairs are included provided there are at least 100 credit card accounts within that region quarter.
Source: FR Y-14M Schedule D: Domestic Credit Card Data.
To analyze the role of regional factors, we average residuals $$\varepsilon_{ikt}$$ over all borrowers within each region $$k$$ and quarter $$t$$. These regionalized residuals capture variation in interest rates, controlling for credit scores that may vary with geography. In Figure 2, we plot these residuals against average delinquency rates for that region and observation quarter. The average delinquency rate is calculated as the fraction of loans that have defaulted by quarter $$t$$ for all loans originated within nine quarters prior to quarter $$t$$. This average delinquency rate represents a measure of geographic risk that would have been observable to lenders prior to the origination of that loan.
To demonstrate the role of regional factors relative to the role of credit score in the variation of interest rates, we incrementally add control variables in the above specification. First, we estimate residuals in the specification with quarter dummies. Panel (i) of Figure 2 shows that, if one controls only for the origination quarter in the pricing model, then the relationship between a region's interest rate residual and its default rate is relatively steep. Panel (ii) shows that the slope becomes substantially flatter after adding a credit score to the quarterly dummies, as this now controls for regional differences in credit scores. The remaining slope is small but still significant and positive, which reflects the correlation between loan pricing and expected regional default risk.
The positive relationship between a regional average delinquency rate and the interest rate residual, after controlling for both credit scores and quarter of origination, is statistically significant. For a 100 bps increase in the regional average delinquency rate, average credit card APRs in that region increase by roughly 5 bps. Nonetheless, this effect is relatively small compared with the average credit card APR of 20 percent.
For credit cards, this increase in pricing due to regional risk is also small relative to that for residential jumbo mortgages. Hurst et al. (2016) identify an increase of approximately 30 bps in jumbo mortgage interest rates for a 100 bps increase in regional default rates. The larger sensitivity for mortgages may be due to the mortgage market's high sensitivity to regional home prices (Elul et al. 2025), or differences in regional foreclosure processes (Dobbie and Song 2015 and Scharfstein and Sunderam 2013). This difference could also be explained by the fact that credit card lenders tend to be large and geographically diversified, and so less exposed to regional risk (Musto and Souleles 2006). Due to the credit card industry being more concentrated, credit card lenders may use their market power to set pricing nationally (Herkenhoff and Raveendranathan 2024 and Drechsler et al. 2025).4
Finally, Panel (iii) displays the relationship between the interest rate residual and average default after adding zip-code indicators to control for persistent regional effects in the above specification. The remaining residuals show a flat and insignificant relationship with regional delinquency rates. This result indicates that credit score, time-related systematic factors, and persistent regional characteristics are the main explanatory factors for the relationship between regional delinquency and loan pricing.
Pricing of Credit Risk: Bank-Level
In the previous section, we analyzed loan-level and regional factors in pricing two retail lending portfolios, as examples. In this section, we study the extent to which banks price total credit risk for the entire lending portfolio. To do so, we analyze the relationship between total credit losses and interest income at the bank level over an entire business cycle. We use data from the FR Y-9C Consolidated Financial Statements for Bank Holding Companies (BHCs) covering the period 2008–2019. The use of the Y-9C has certain benefits. First, the Y-9C data provides all-in interest income, which may contain more aspects of pricing, such as fees, promotional pricing, and incentives, than can be captured by a single origination interest rate. Second, the Y-9C data allows us to use net charge-offs, which are a broader measure of credit risk than loan defaults. Net charge-offs capture additional aspects of credit risk, such as loss-given default, recovery costs, and the total loan balance exposed to default; these factors would not be observed by focusing solely on loan default rates.5
In Figure 3, we plot the relationship between total interest and fee income generated by loans and total net charge-offs for 586 U.S. BHCs with more than a billion dollars in total assets. Figure 3 shows that banks with greater credit risk, as measured by average net charge-offs from 2008 to 2019, are also those banks with greater average interest and fee income during the same period. This relationship is statistically significant and indicates that a 1 percent increase in average net charge-offs is associated with a 0.6 percent increase in average interest and fee income. We note that pricing exhibits substantial heterogeneity despite the higher level of aggregation. This heterogeneity indicates that other factors, such as market power, may also play a significant role in pricing loans.
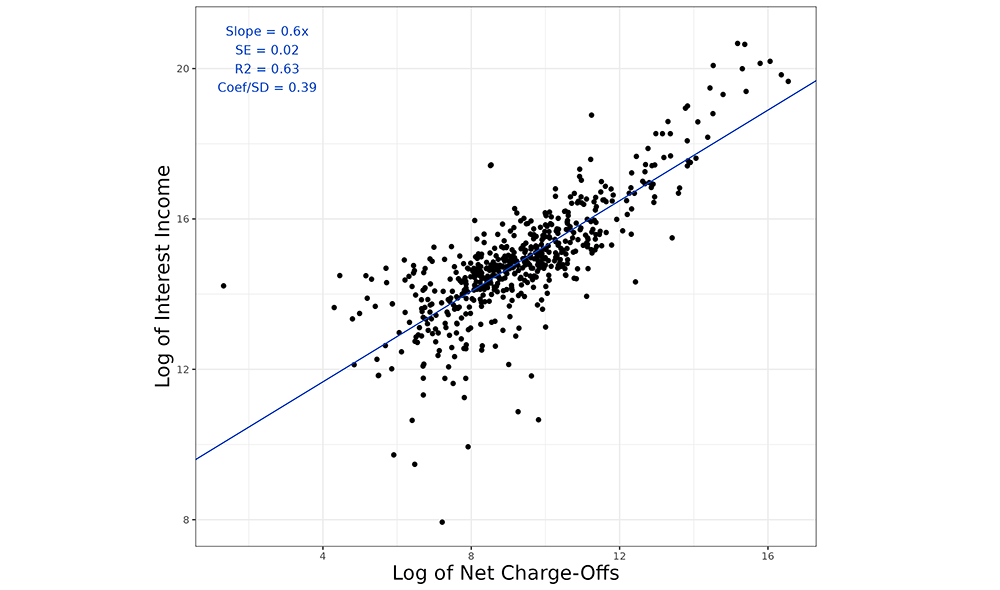
Note: Data is from the Y-9C plotting the log of total interest and fee income above the prime rate against the log of net charge-offs for 586 banks with more than a billion dollars in total loan assets. Observations are from the Q4 snapshot from 2008 to 2019.
Source: FR Y-9C Consolidated Financial Statements for Holding Companies.
Conclusion
We analyzed the relationship between credit risk and interest rates at different levels of aggregation. First, we studied this relationship for credit card and mortgage loan portfolios as examples of the effect of risk characteristics on loan pricing. We confirmed that loan-level characteristics, such as credit score and LTV, are key risk pricing factors for these portfolios. In addition, we found that regional risk is also priced into these portfolios. We estimated that regional factors play a smaller role in pricing credit card portfolios relative to mortgage loan portfolios. Finally, we examined the interest and risk relationship at the overall bank level, and we showed that banks with larger credit losses were also those with overall higher interest and fee income.
While this study has focused on the critical role of default risk in loan pricing, future research could broaden the scope to incorporate other costs associated with lending to riskier borrowers, such as regulatory capital requirements. Quantifying how risk-based capital requirements interact with a bank's own efforts to price credit risk would provide a more comprehensive picture for how banks manage risk and credit supply.
Reference
Acharya, Viral V., Allen N. Berger, and Raluca A. Roman. 2018. "Lending implications of U.S. bank stress tests: Costs or benefits?" Journal of Financial Intermediation 34: 58–90. https://doi.org/10.1016/j.jfi.2018.01.004.
Agarwal, Sumit, Souphala Chomsisengphet, Chunlin Liu, et al. 2018. "Benefits of relationship banking: Evidence from consumer credit markets." Journal of Monetary Economics 96: 16–32. https://doi.org/10.1016/j.jmoneco.2018.02.005.
Ambrose, Brent W. , Michael LaCour-Little, and Anthony B. Sanders. 2004. "The effect of conforming loan status on mortgage yield spreads: A loan level analysis." Real Estate Economics 32(4): 541–569. https://doi.org/10.1111/j.1080-8620.2004.00102.x
Ashraf, Badar Nadeem, and Yinjie Shen. 2019. "Economic policy uncertainty and banks' loan pricing." Journal of Financial Stability 44: 100695. https://doi.org/10.1016/j.jfs.2019.100695.
Bahaj, Saleem, and Frederic Malherbe. 2017. "A positive analysis of bank behavior under capital requirements." Working paper. https://dx.doi.org/10.2139/ssrn.3045065.
Barnes, Kayleigh, Connor Bopst, and John Driscoll. 2025. "Predicting credit card delinquency rates." FEDS Note.
Berrospide, Jose M., and Rochelle M. Edge. 2024. "Bank capital buffers and lending, firm financing and spending: What can we learn from five years of stress-test results?" Journal of Financial Intermediation 57: 101061. https://doi.org/10.1016/j.jfi.2023.101061.
Beyhaghi, Mehdi, Cesare Fracassi, and Gregory Weitzner. "Adverse selection in corporate loan markets." Journal of Finance, forthcoming, http://dx.doi.org/10.2139/ssrn.3733932.
Bikker, Jacob A., and Tobias M. Vervliet. 2017. "Bank profitability and risk-taking under low interest rates." International Journal of Finance & Economics 23 (1): 3–18. https://doi.org/10.1002/ijfe.1595.
Bordo, Michael D., John V. Duca, and Christoffer Koch. 2016. "Economic policy uncertainty and the credit channel: Aggregate and bank level U.S. evidence over several decades." Journal of Financial Stability 26: 90–106. https://doi.org/10.1016/j.jfs.2016.07.002.
Camba-Mendez, Gonzalo, and Francesco Paolo Mongelli. 2021. "Risk aversion and bank loan pricing." Economics Letters 200: 109723. https://doi.org/10.1016/j.econlet.2020.109723.
Dobbie, Will, and Jae Song. 2015. "Debt relief and debtor outcomes: Measuring the effects of consumer bankruptcy protection." American Economic Review 105 (3): 1272–1311.
Drechsler, Itamar, Hyeyoon Jung, Weiyu Peng, et al. 2025. "Credit card banking (PDF)." Federal Reserve Bank of New York Staff Reports No. 1143.
Edelberg, Wendy. 2006. "Risk-based pricing of interest rates for consumer loans." Journal of Monetary Economics 53 (8): 2283–2298. https://doi.org/10.1016/j.jmoneco.2005.09.001.
Elul, Ronel, Deeksha Gupta, and David Musto. "Concentration in mortgage markets: Government sponsored enterprise exposure and risk-taking in uncertain times." Management Science, forthcoming.
Herkenhoff, Kyle F., and Gajendran Raveendranathan. 2024. "Who bears the welfare costs of monopoly? The case of the credit card industry." Review of Economic Studies. https://doi.org/10.1093/restud/rdae098.
Hurst, Erik, Benjamin J. Keys, Amit Seru, and Joseph Vavra. 2016. "Regional redistribution through the U.S. mortgage market." American Economic Review 106 (10): 2982–3028.
Martynova, Natalya, Lev Ratnovski, and Razvan Vlahu. 2020. "Bank profitability, leverage constraints, and risk-taking." Journal of Financial Intermediation 44: 100821. https://doi.org/10.1016/j.jfi.2019.03.006.
Musto, David K., and Nicholas S. Souleles. 2006. "A portfolio view of consumer credit." Journal of Monetary Economics 53 (1): 59–84.
Pierret, Diane, and Roberto Steri. 2020. "Stressed banks." Working paper. https://dx.doi.org/10.2139/ssrn.3066403.
Rigbi, Oren. 2013. "The effects of usury laws: Evidence from the online loan market." Review of Economics and Statistics 95 (4): 1238–1248.
Scharfstein, David, and Adi Sunderam. 2013. "Concentration in mortgage lending, refinancing activity and mortgage rates." National Bureau of Economic Research Working Paper 19156.
Valta, Philip. 2012. "Competition and the cost of debt." Journal of Financial Economics 105 (3): 661–682. https://doi.org/10.1016/j.jfineco.2012.04.004.
1. Azamat Abdymomunov ([email protected], Federal Reserve Bank of Richmond); Ronel Elul ([email protected], Federal Reserve Bank of Philadelphia); Doriana Ruffino ([email protected], Federal Reserve Board of Governors); James Wang ([email protected], Federal Reserve Board of Governors).
We thank Jose Berrospide, Mehdi Beyhaghi, John Driscoll, Sharjil Haque, Anya Kleymenova, John Krainer, Young Hwa Seok, Teng Wang, and Paige Weisman for the helpful comments and discussion. We thank Ryan Jin, Ethan Butler, Omar Ahmad, and Madison Staiman for helpful research assistance. The views expressed in this paper do not necessarily reflect the position of the Federal Reserve Bank of Richmond, the Federal Reserve Bank of Philadelphia, or the Board of Governors of the Federal Reserve System. Return to text
2. While credit card interest rates are frequently adjustable and may change post-origination, we focus our analysis on origination pricing. Post–Great Financial Crisis credit card regulation limits the ability of credit card issuers to reprice outstanding balances for borrowers that are not delinquent (see Profitability of Credit Card Operations of Depository Institutions (PDF), June 2024). Return to text
3. We performed a similar analysis for the Corporate and Industrial (C&I) portfolio and found that there is a strong negative relationship between interest rate spreads and internal loan ratings, with higher-rated corporate facilities associated with lower loan spreads. While this relationship is consistent with our mortgage and credit card analysis, some caution is needed for interpreting the C&I results. Firms use an array of different mechanisms beyond interest rates to price credit risk, such as a facility's covenant structure, monitoring scheme, willingness to re-negotiate, relationship lending subsidies, and other unobserved cross-subsidization lending with the obligor. Comparatively, these factors are less of a factor for consumer lending. See Barnes et al. (2025) for a recent discussion of modeling credit card delinquency. Return to text
4. The credit card industry's higher concentration does not imply greater pricing markups (Beyhaghi et al. [forthcoming]). Return to text
5. One limitation of using the Y-9C data is that its measure of interest income includes post-origination penalties and fees. These post-origination factors may instead reflect how banks use fees and penalties to manage higher realized risk. Some of these concerns are addressed by the previous loan-level analysis, which uses origination interest rates and measures of expected risk at origination. Return to text
Abdymomunov, Azamat, Ronel Elul, Doriana Ruffino, and James Wang (2025). "Examining the Relationship Between Loan Pricing and Credit Risk," FEDS Notes. Washington: Board of Governors of the Federal Reserve System, September 24, 2025, https://doi.org/10.17016/2380-7172.3876.
Disclaimer: FEDS Notes are articles in which Board staff offer their own views and present analysis on a range of topics in economics and finance. These articles are shorter and less technically oriented than FEDS Working Papers and IFDP papers.