FEDS Notes
August 23, 2022
How Do U.S. Life Insurers Manage Liquidity in Times of Stress?
Nathan Foley-Fisher, Nathan Heinrich, Stéphane Verani1
In this note, we describe U.S. life insurers' liquidity management when the COVID-19 pandemic broke. We show that life insurance companies immediately created cash buffers to manage potential liquidity shocks. They did not create these buffers by selling their liquid assets. Rather, life insurers' cash buffers came largely from Federal Home Loan Banks (FHLBs) and interest rate derivatives. Understanding the sources of liquidity in times of crises is crucial, as the National Association of Insurance Commissioners (NAIC) continues its review and development of new guidance for regulation of life insurers' liquidity management.2
Life insurers manage their cash flows tightly and keep cash holdings to a minimum in normal times. Excess cash holdings are wasteful to life insurers because most of their liabilities are long term with predictable cash flows. In periods of stress, however, life insurers create cash buffers to manage potential liquidity shocks. For example, large life insurers do issue some runnable liabilities, such as funding agreement-backed securities (FABS), which render them vulnerable to adverse cash flow shocks (Foley-Fisher, Narajabad, and Verani, 2019). Uncertainty during the pandemic created the potential for adverse liquidity shocks in the life insurance industry. In response, the industry boosted its cash holdings to record levels, with an increase of nearly $90 billion in one quarter (roughly 75 percent quarter-on-quarter growth).
We document sources for the enormous cash holdings boost by life insurers at the onset of the pandemic. Life insurers obtained about $20 billion in new FHLB advances. In addition, we estimate that a further $20 billion came from variation margin on derivatives, mostly used to hedge movements in interest rates. Importantly, we show that none of this extraordinary cash buildup came from abnormal asset sales, including the sales of Treasury securities. Lastly, the increase in FHLB borrowings stayed elevated when calm returned to financial markets after aggressive policy actions by the Federal Reserve. This ratcheting up of FHLB borrowing is a repeat of what happened during the 2007–08 run on FABS.
We then show that a large fraction of life insurers' most liquid assets—in particular, their Treasury securities—are not immediately available to meet liquidity needs. These assets are encumbered, meaning that they cannot be sold for regulatory, contractual, or other reasons, though the amount and degree of encumbrance is not well known. For example, we estimate that about half of life insurers' Treasury holdings are encumbered. In addition, their holdings of Treasury securities are relatively small, accounting only for about 4 percent (or $150 billion) of their general account assets in the fourth quarter of 2019.
The remainder of this note has four sections. Section 1 documents cash flow management in the life insurance industry. Section 2 explains where life insurers sourced cash at the outset of the pandemic. Section 3 describes how encumbrances may affect life insurers' ability to sell Treasury securities. Section 4 concludes.
1. Cash holdings in the life insurance industry
Figure 1 shows the quarterly time series of life insurers' cash positions, measured as "net cash, cash equivalents, and short-term assets" in statutory filings.3 The figure presents two main messages. First, in normal times, the industry manages its cash flows tightly. Despite holding more than 5 trillion in assets, cash holdings are typically around $100 billion, or only about 2 percent of life insurers' general account assets. By comparison, commercial banks' cash holdings are typically about 15 percent of their total assets.4 Life insurers minimize their cash holdings because most of their liabilities are generally long term. The average duration of their liabilities is around 20 years (Huber, 2022). Thus, the opportunity cost of holding cash is especially high for life insurers.
Figure 1. Life insurers' cash holdings: "net cash, cash equivalents, and short-term assets" in statutory filings
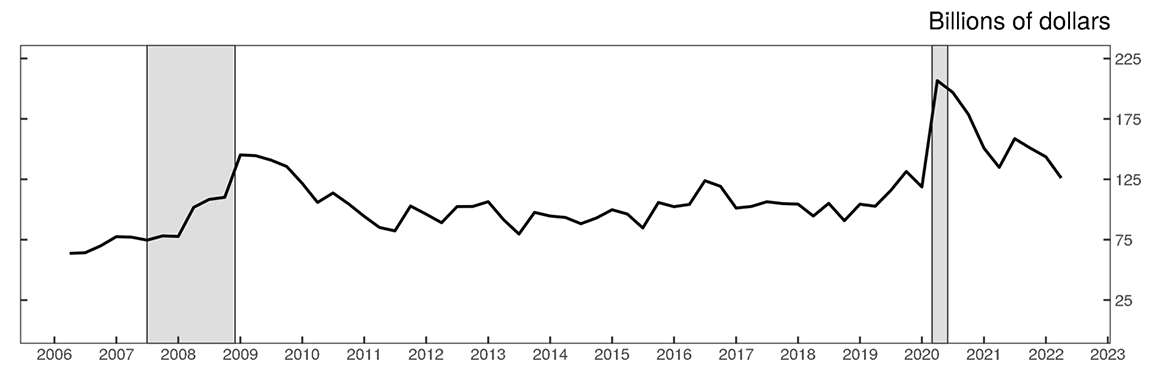
Note: The shaded regions indicate periods of stress for life insurers (2007:Q2—2008:Q4 and 2020:Q1—2020:Q2).
Source: Authors' calculations based on NAIC statutory filings.
The second message from Figure 1 is that life insurers create cash buffers in times of stress, such as during the Global Financial Crisis (GFC) and the COVID-19 pandemic, shown by the gray regions in the figure. These cash buffers protect life insurers from adverse liquidity shocks.5 One salient source of adverse cash flow shocks is the runnable liabilities issued by large life insurers, including FABS, as well as repurchase agreements (repo) and securities lending (Foley-Fisher, Narajabad, and Verani, 2020; Foley-Fisher, Gissler, and Verani, 2019). In times of uncertainty, short-term investors that hold these liabilities may choose to withdraw their funding, creating an adverse liquidity shock for those insurers. At the onset of crises, in anticipation of such shocks, life insurers build cash buffers.
Figure 1 reveals record cash holdings by life insurers at the beginning of the pandemic. In the fastest growth recorded in the data, in 2020:Q1, cash holdings rose $88.5 billion (equivalent to 75 percent quarter-on-quarter growth).6 Using higher-frequency monthly data, we found that most of the increase ($70 billion) occurred in March 2020.7 The spike is consistent with highly elevated concerns about potential liquidity shocks.8 The size of the movement during the pandemic compared with the GFC suggests that insurers learned from the previous crisis and moved quickly in the face of greater risks to the corporate bond market.
Figure 2 below shows the net change in cash as the sum of cash flows from three components. First, "Operations" (the dashed line) includes insurance premiums and income from investments. Cash flows from operations tend to be quite stable. Second, "Investments" (the dotted line) includes trading of investment securities. Cash flows from investments are negative because life insurers typically buy more investments than they sell. And, third, "Financing and miscellaneous" sources (the dot-dashed line) includes deposit-type contracts, surplus notes, capital notes, and other sources. In a decomposition of the relative importance of the three components, cash flows from this third component are generally responsible for most of the variation in net cash.9
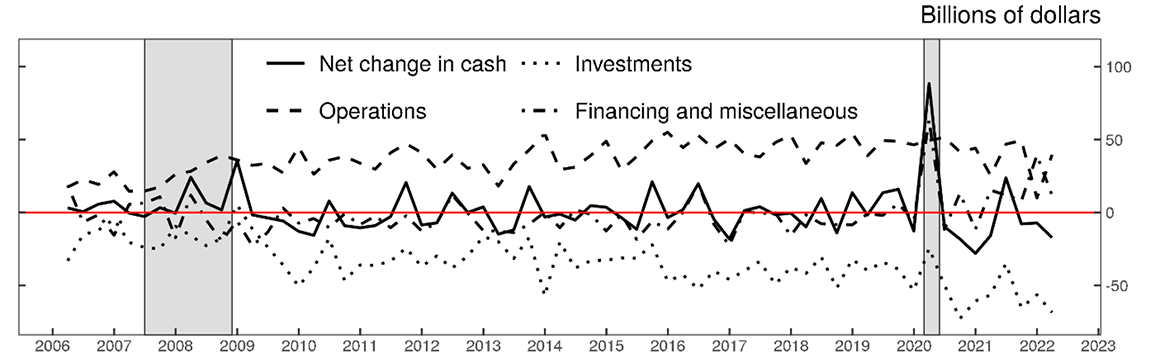
Note: The shaded regions indicate periods of stress for life insurers (2007:Q2—2008:Q4 and 2020:Q1—2020:Q2).
Source: Authors' calculations based on NAIC statutory filings.
For the first quarter of 2020, most of the positive cash flow came from financing and miscellaneous sources. While the average cash flow from this component was close to zero for the sample as a whole, it was a whopping $63.5 billion in the first quarter of 2020. Diving deeper, Figure 3 shows a breakdown of cash flows associated with sources within this component. There are three main categories: "Borrowed funds" (the dashed line), "Net deposits" from deposit-type contracts (the dotted line), and a residual "Other cash provided" category (the dot-dashed line). We decomposed the relative importance of these three sources to variation in the total cash flow from financing and miscellaneous sources. We found that the residual category generally drives variation in the total cash flow.10
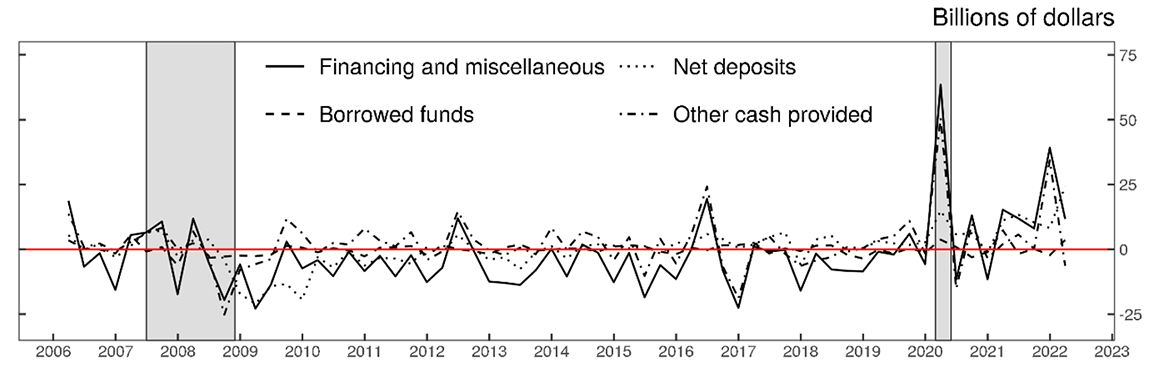
Note: The shaded regions indicate periods of stress for life insurers (2007:Q2—2008:Q4 and 2020:Q1—2020:Q2).
Source: Authors' calculations based on NAIC statutory filings.
For the first quarter of 2020, the residual category had positive cash flows of $50.7 billion, which accounts for the lion's share of the total increase in the life insurance industries' cash holdings. In the next section, we provide further details about individual sources.
2. Where did life insurers find cash at the onset of the pandemic?
Statutory filings are silent about the components of the residual category of cash flows. Accounting standards make it difficult to identify cleanly all the individual drivers of the industry-wide cash spike documented in the previous section. Nevertheless, we identified two major drivers.
a. Federal Home Loan Banks
FHLBs provide government-guaranteed funding as a "lender of next-to-last resort" in the U.S. financial system (Narajabad and Gissler, 2017a). Their funding is used by a range of institutions, including banks, thrifts, credit unions, and insurance companies. As long as investors are willing to hold their debt, FHLBs can provide this funding. Growth of FHLBs poses new risks to U.S. financial stability that are beyond the scope of this note (see Narajabad and Gissler, 2017b).
U.S. life insurers initially ramped up their borrowing from the FHLBs during the 2007–08 run on FABS (Foley-Fisher, Narajabad, and Verani, 2020). This event was the first time that the FHLB system acted as a source of government-backed liquidity for life insurers issuing runnable nontraditional liabilities collateralized by funding agreements, such as puttable FABS and guaranteed investment contracts. Life insurers issue nontraditional liabilities to earn a spread between the cost of raising funds with nontraditional liabilities and the yields on assets purchased with these funds, which necessarily involves some degree of maturity, liquidity, credit transformation, or a combination of these. In the aftermath of the run, FHLBs replaced most of life insurers' FABS funding (Foley-Fisher, Narajabad and Verani, 2019).
Life insurers again ratcheted up their borrowing from FHLBs during the COVID-19 pandemic. Figure 4 shows the surge in FHLB advances to the life insurance industry in the first quarter of 2020, rising by about $20 billion, or more than 20 percent quarter-on-quarter growth. FHLB advances do not appear as "borrowed funds" in statutory filings (e.g., Figure 3) because they are collateralized by funding agreements so are treated as insurance contracts rather than debt.
Figure 4. Federal Home Loan Bank advances to U.S. life insurers collateralized by funding agreements
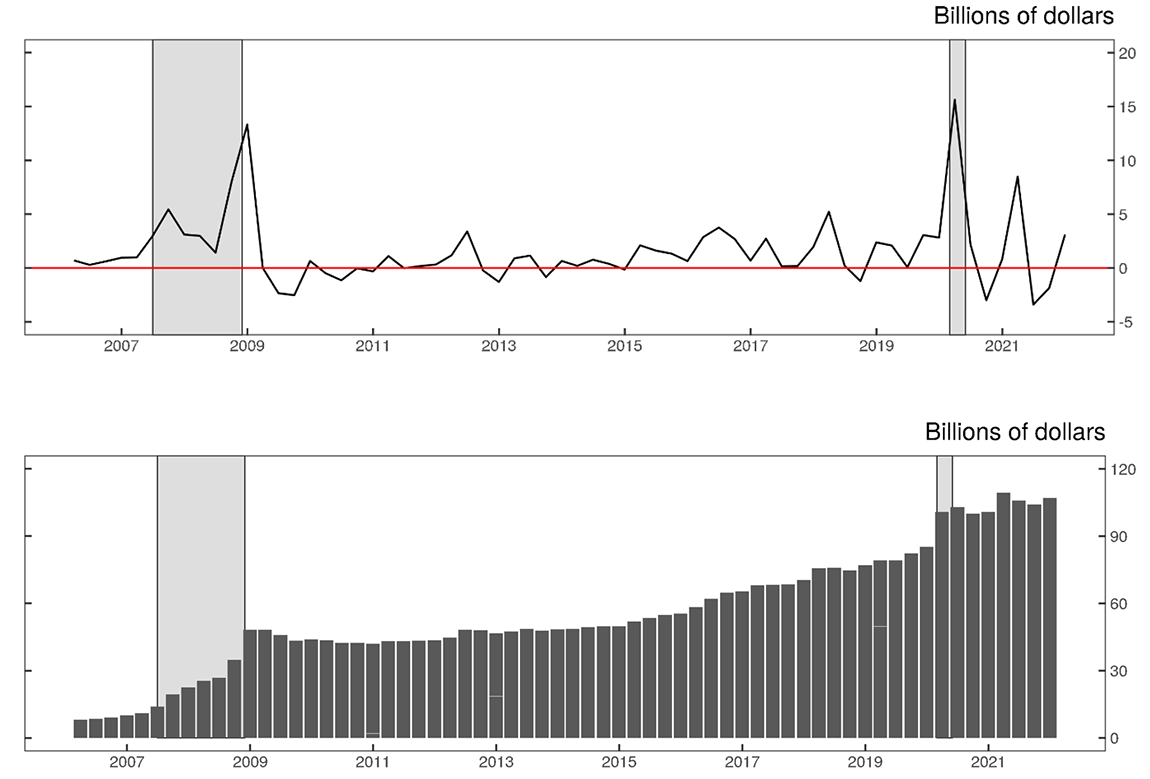
Note: Panel A shows the quarterly change. Panel B shows the level. The shaded regions indicate periods of stress for life insurers (2007:Q2—2008:Q4 and 2020:Q1—2020:Q2).
Source: Authors' calculations based on NAIC statutory filings.
It is highly likely that life insurers initially kept their FHLB funding as cash (shown in Figure 1) to preserve liquidity. Contemporaneous industry reports indicate that the funding was intended to provide options to respond to stress scenarios (Zawacki, 2020). That said, FHLB funding is fungible, so we cannot directly tie its growth to the cash spike. Insurers could, in principle, have used the funding to invest in other assets or used it as a substitute for other liabilities.
Moreover, as Panel B of Figure 4 indicates, FHLB funding did not decline as the pandemic evolved and financial markets stabilized. By the end of the sample, insurers accounted for about 35 percent of all borrowing from the FHLB system, and one life insurer is the largest single borrower from the FHLB system with $15.3 billion in total advances outstanding. Life insurers likely chose to redirect the funding into their spread business.
b. Derivatives variation margin
The dashed line in Figure 5 shows that the net variation margin cash received by life insurers on existing derivative contracts with counterparties rose by $16 billion in the first quarter of 2020. More than 90 percent of life insurers' derivatives are interest rate swaps used to hedge movements in interest rates. Insurance regulation encourages the use of derivatives be used to hedge existing balance sheet risks, and discourages speculation by setting relatively high capital charges. Life insurers received cash when the Federal Reserve cut interest rates, as their counterparties on the other side of fixed-for-float interest rate swap contracts had to post margin.11 Confirming this intuition, the dotted line is negatively correlated with the solid line in the same figure, which is the market yield on 10-year Treasury securities. We calculate the net cash that life insurers received from derivative variation margins—that is, not initial margin from new derivative contracts. The net calculation is the difference between cash collateral pledged to life insurers and cash collateral pledged by life insurers. We parse the text of individual line items of statutory filings to identify cash collateral. The estimate covers all derivative contracts, as we cannot match individual collateral received or pledged to individual derivative contracts.
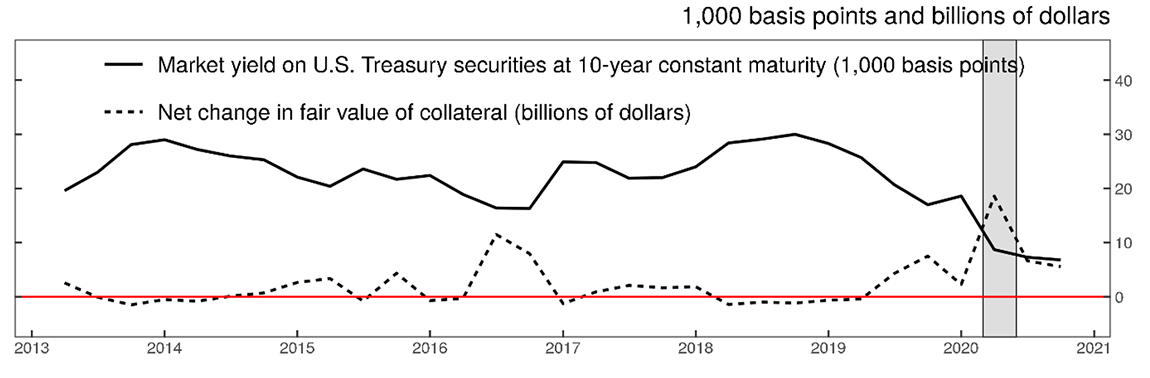
Note: The shaded region indicates a period of stress for life insurers (2020:Q1—2020:Q2).
Source: Authors' calculations based on NAIC statutory filings and Federal Reserve Economic Data from the Federal Reserve Bank of St. Louis.
3. Why don't insurers create cash buffers by selling liquid assets such as Treasury securities?
In Figure 2, we showed that abnormal asset sales were not the main driver of the increase in cash holdings. Confirming this broad conclusion, Panel A of Figure 6 shows quarterly transactions in securities rated triple A and double A. The solid line indicates sales only, while the dashed line is the net position that includes cash returned from maturing, called, and redeemed securities as well as purchases of new securities. Negative values (below the red horizontal line) indicate quarters when life insurers received cash, on net, from their holdings. Panel B shows the same information for the subset of Treasury securities. In looking at the end of the sample period, life insurers did not receive an abnormal amount of cash from net changes to their positions in the first quarter of 2020. More generally, net Treasury transactions are quite small and do not drive much of the variation in net cash flows documented above. These findings suggest that insurers do not use their Treasury holdings to manage potential adverse liquidity shocks.
Figure 6a. Transactions of bonds rated triple A and double A by quarter in the life insurance industry
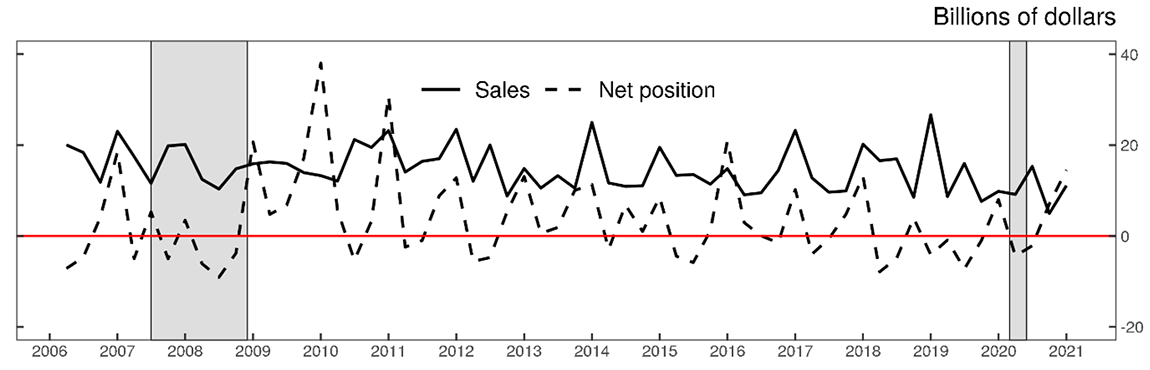
Note: The shaded regions indicate periods of stress for life insurers (2007:Q2—2008:Q4 and 2020:Q1—2020:Q2). Negative net positions mean life insurers are reducing their holdings either by selling or by not replacing maturing, called, and redeemed bonds.
Source: Authors' calculations based on NAIC statutory filings and Mergent Fixed Income Securities Database.
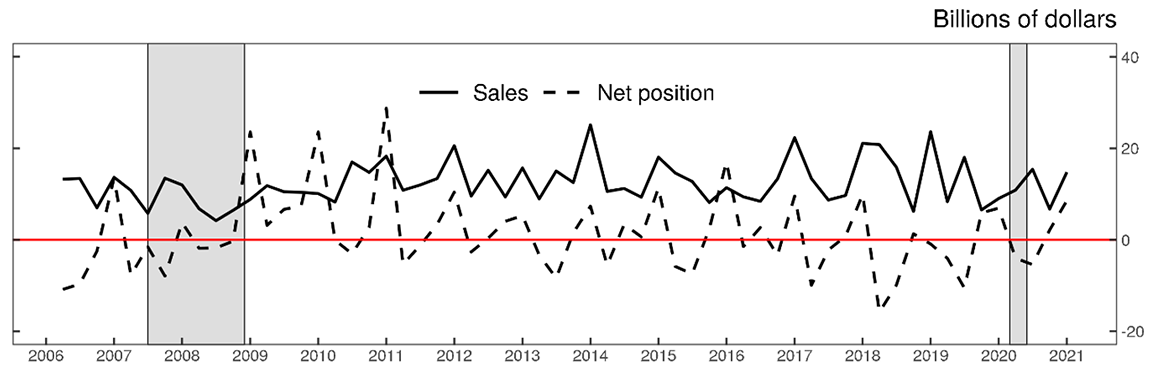
Note: The shaded regions indicate periods of stress for life insurers (2007:Q2—2008:Q4 and 2020:Q1—2020:Q2). Negative net positions mean life insurers are reducing their holdings either by selling or by not replacing maturing, called, and redeemed bonds.
Source: Authors' calculations based on NAIC statutory filings.
Why do life insurers use FHLB funding and derivatives instead of selling Treasury securities? One reason is that Treasury securities are a vital source of collateral and are encumbered—that is, unavailable for sale for regulatory or contractual reasons, such as being pledged as collateral in repurchase agreements. In general, the life insurance industry's relatively small holdings of U.S. government securities, which have relatively lower yields, reflects their substantial liquidity premium. This liquidity premium means that investing life insurance premium and annuity considerations in U.S. government securities is unprofitable because life insurers must compensate policyholders for the illiquidity they bear when signing up for a life annuity or buying life insurance (Verani and Yu, 2021).
Figure 7 shows a rough estimate of the amount of Treasury holdings that are encumbered based on statutory filings for the end of each year. During the sample period, it is common for half of Treasury holdings to be flagged as pledged. The black line in the same figure shows the total amount of Treasury securities held as a percentage of net admitted assets excluding separate accounts for the entire industry. In the pre-crisis period, life insurers held roughly 2 percent in Treasury securities, which rose to 4 percent in the post-GFC period and has been declining in recent years.
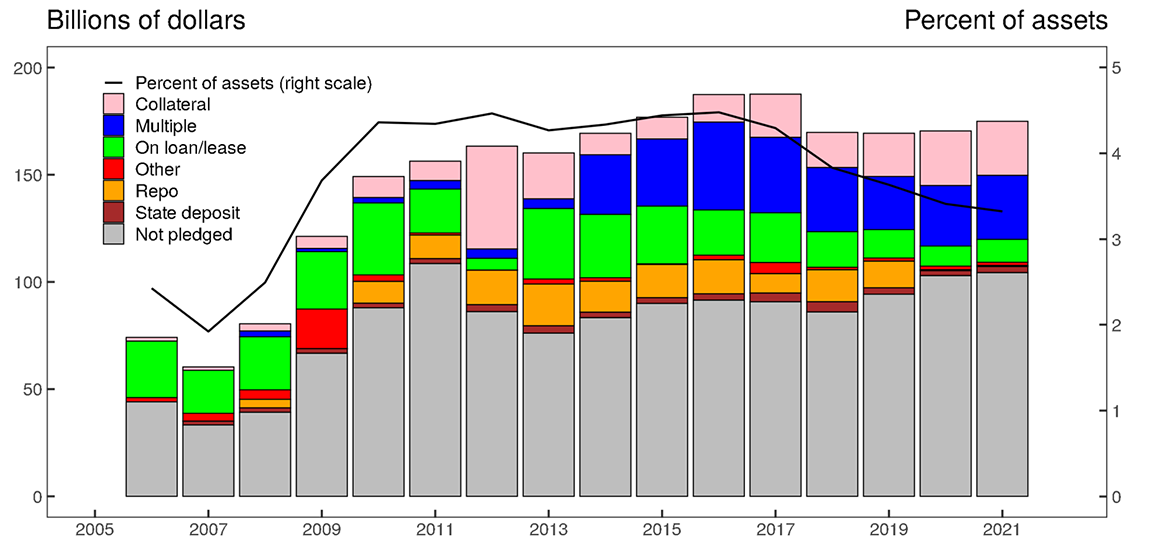
Note: The residual "other" category includes reverse repo. The order of categories in the legend is the same as in each annual bar. The residual "other" category does not appear in 2012 or 2015.
Source: Authors' calculations based on NAIC statutory filings
Our estimate of encumbered Treasury securities is rough for two reasons. First, statutory filings indicate only whether a particular Treasury security held by a life insurer is pledged, not how much of each Treasury is pledged. Second, the filings indicate only whether the holdings are actually on loan. Treasury securities that are made available to lend are similarly encumbered but are not flagged in annual filings. The first caveat means our estimate overstates the true extent of encumbrance, while the second means we have an underestimate. We don't know the relative importance of these caveats.
To be clear, our analysis shows that life insurers generally do not use Treasury securities to meet adverse cash flow shocks. Therefore, we are showing why it would be inappropriate to use life insurers' Treasury holdings to assess their cash flow management. The NAIC liquidity stress tests are an appropriate effort to assess cash flow management, and those tests do take account of Treasury encumbrance.
Figure 7 shows a breakdown of where Treasury securities are pledged. In the pre-GFC period, most encumbrance was due to securities lending (the green bars). In the post-GFC period, Treasury securities pledged in repo contracts rose, as well as Treasury securities pledged as collateral in derivative and replication contracts (the orange bars). In recent years, there has been growth in Treasury securities pledged to multiple different contract types (the brown bars).
Conclusion
One theme that emerges from our analysis is the opacity of sources of cash and information about cash flow management in life insurers' current regulatory filings. In previous work, we used cash flows to assess the size of the run risk associated with life insurers' nontraditional liabilities (Foley-Fisher, Narajabad, and Verani, 2020). In this note, we have shown that most of the variation in total net cash flows in both normal and crisis times comes from residual "other cash" categories and that life insurers provide limited information about the extent of asset encumbrance. In addition, some life insurers have developed new opaque lines of business (Foley-Fisher, Heinrich, and Verani, 2020). Opacity is a valuable characteristic in banking and shadow banking (Gorton, 2014). By extension, regulation and examination—such as the NAIC's liquidity stress tests—become vital for investor confidence.
Our analysis also reveals that life insurers are growing more dependent on FHLB funding. We quantified their borrowing from FHLBs during the GFC and pandemic. We showed that FHLB funding did not decline in the aftermath of these crises as financial markets stabilized. Recent state legal initiatives seek to lower the cost to insurers of borrowing from FHLBs even further.12 Meanwhile, some observers have raised concerns about the contribution of FHLBs to systemic risk (Narajabad and Gissler, 2017b).
References
Foley-Fisher, Nathan, Borghan Narajabad, and Stéphane Verani (2019). "Assessing the Size of the Risks Posed by Life Insurers' Nontraditional Liabilities," FEDS Notes. Washington: Board of Governors of the Federal Reserve System, May 21.
Foley-Fisher, Nathan, Borghan Narajabad, and Stéphane H. Verani (2020). "Self-fulfilling Runs: Evidence from the U.S. Life Insurance Industry," Journal of Political Economy, vol. 128 (9), pp. 3520–69.
Foley-Fisher, Nathan, Stefan Gissler, and Stéphane Verani (2019) "Over-the-Counter Market Liquidity and Securities Lending," Review of Economic Dynamics, vol. 33 (July), pp. 272–94.
Foley-Fisher, Nathan, Nathan Heinrich, and Stéphane Verani (2020) "Are U.S. Life Insurers the New Shadow Banks?," Available at SSRN: https://ssrn.com/abstract=3534847.Gissler, Stefan, and Borghan Narajabad (2017a). "The Increased Role of the Federal Home Loan Bank System in Funding Markets, Part 1: Background," FEDS Notes. Washington: Board of Governors of the Federal Reserve System, October 18.
Gissler, Stefan, and Borghan Narajabad (2017b). "The Increased Role of the Federal Home Loan Bank System in Funding Markets, Part 3: Implications for Financial Stability," FEDS Notes. Washington: Board of Governors of the Federal Reserve System, October 18.
Gorton, Gary (2014). "The Development of Opacity in U.S. Banking," Yale Journal on Regulation, vol. 31 (3), pp. 825–51.
Huber, Maximilian (2022). "Regulation-Induced Interest Rate Risk Exposure," mimeo.
Verani, Stéphane, and Pei Cheng Yu (2021). "What's Wrong with Annuity Markets?," Finance and Economics Discussion Series 2021-044. Washington: Board of Governors of the Federal Reserve System, July, .
Zawacki, Tim (2020). "Insurance Insight: FHLB Borrowings among US Life Insurers Surged Past $100B amid Liquidity Push," S&P Global, June 9, https://www.spglobal.com/marketintelligence/en/news-insights/latest-news-headlines/fhlb-borrowings-among-us-life-insurers-surged-past-100b-amid-liquidity-push-58961951.
1. We thank Celso Brunetti, Alejandro Drexler, Stefan Gissler, Ralf Meisenzahl, Borghan Narajabad, and Michael Palumbo for useful comments and insightful discussions. The views expressed in this paper are solely those of the authors and do not necessarily reflect the views of the Board of Governors of the Federal Reserve System or its staff. Return to text
2. For more information, see the Macroprudential (E) Working Group at https://content.naic.org/cmte_e_mwg.htm. Return to text
3. See Statement of Statutory Accounting Principles No. 2R for the definition of "net cash, cash equivalents, and short-term assets". Return to text
4. See https://www.federalreserve.gov/releases/h8/current/default.htm. Return to text
5. Another possibility is that the cash buffer helps insurers avoid selling illiquid assets to meet expected claims. Return to text
6. Commercial banks' cash holdings rose about 40 percent in the same quarter. Unlike life insurers, these banks received large inflows of deposits. Return to text
7. Further details about monthly cash flows are available on request. Return to text
8. In addition, some life insurers lobbied for greater access to the Federal Reserve's emergency lending facilities. See Kate Kelly, Jeanna Smialek, Alan Rappeport (2020), "Private Equity Firm Pushes for Broader Access to Fed Lending Program" New York Times, April 4, https://www.nytimes.com/2020/04/04/business/economy/apollo-federal-reserve-lending-talf.html. Return to text
9. The financing and miscellaneous component accounts for about 45 percent of the total variation. The investment component is responsible for approximately 35 percent of the variation. Detailed results available on request. Return to text
10. The three components together account for about 78 percent of the total variation. By itself, the residual component is responsible for approximately 40 percent of the variation. Detailed results available on request. Return to text
11. To the best of our knowledge, while variation margin is typically posted in cash, there is no requirement to post cash and a list of eligible collateral securities is provided by ISDA and the CFTC. Return to text
12. See William Rabb (2022), "Insurers Could Get Lower Rates on Liquidity with Bills in States" Insurance Journal February 1, https://www.insurancejournal.com/news/national/2022/02/01/651688.htm. Return to text
Foley-Fisher, Nathan, Nathan Heinrich, and Stéphane Verani (2022). "How Do U.S. Life Insurers Manage Liquidity in Times of Stress?," FEDS Notes. Washington: Board of Governors of the Federal Reserve System, August 23, 2022, https://doi.org/10.17016/2380-7172.3161.
Disclaimer: FEDS Notes are articles in which Board staff offer their own views and present analysis on a range of topics in economics and finance. These articles are shorter and less technically oriented than FEDS Working Papers and IFDP papers.