FEDS Notes
June 21, 2022
How Effective Were National, State, and Local Eviction Moratoria?
Adithya Raajkumar
Author's note: This version introduces a major correction regarding the identification of local eviction moratoria. The previous version incorrectly ascribed state-level eviction moratoria to municipalities within those states. This version corrects those assignments and also corroborates moratorium information from secondary sources with primary source documents.
Introduction
Evictions can have detrimental effects on tenants and their households, such as unemployment, loss of shelter, and/or food insecurity, which can often be especially severe since households that face eviction tend to be poorer and less job-secure (Desmond and Kimbro, 2015). Even when tenants are ultimately not evicted, eviction filings themselves can represent a burden for households (Banerjee and Ghatak, 2003; Leung, Hepburn, and Desmond, 2021). Finally, the mere threat of eviction can impose substantial costs on households (Garboden and Rosen, 2019). Beyond the household level, evictions can also have adverse effects on public health (Benfer et al., 2021; Jowers et al., 2021).
During the COVID-19 pandemic, many renters lost their primary source of income and were unable to afford their rent payments (Parrot and Zandi, 2021). To assist these tenants, Congress and the Centers for Disease Control and Prevention (CDC) implemented measures to prevent them from being evicted. In particular, the CARES Act prevented landlords of federally financed properties from filing eviction proceedings, and the CDC's order extended and strengthened the provisions of the CARES Act after it expired (McCarty and Perl, 2021). In addition, many states and municipalities enacted their own measures halting evictions, which were of varying duration (Figure 1).
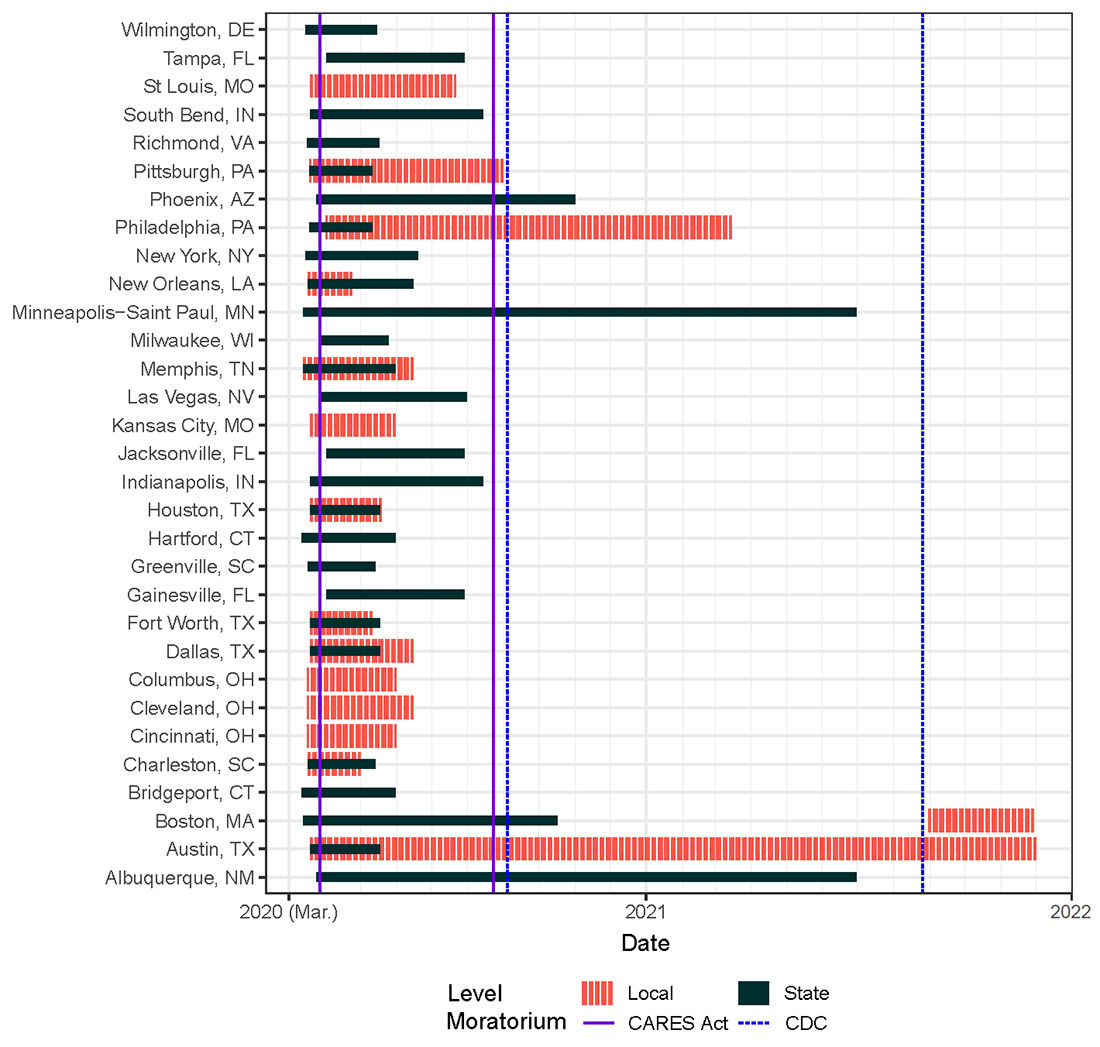
Note: The figure shows the periods in which eviction moratoria were in force across the 31 U.S cities and their respective states for which eviction filing data are publicly available (Phoenix, AZ, and Albuquerque, NM, did not enact a local moratorium). The red (black) bars indicate the time periods for which a municipal (state) eviction moratorium was in force. The purple lines denote the start (March 27th, 2020) and end (August 23rd, 2020) of the CARES Act moratorium. The blue lines denote the start (September 4th, 2020) and end (August 26th, 2021)1 of the CDC moratorium.
Sources: Princeton Eviction Lab and Congressional Research Service.
Although the strength and enforcement of these moratoria varied across jurisdictions, their staggered implementation and expiration provides an opportunity to study their effectiveness. For example, An, Gabriel, and Tzur-Ilan (2021) find that each additional week of a statewide eviction moratorium was associated with roughly 130 fewer eviction filings, and analysis by researchers at the Princeton Eviction Lab suggests that the CDC order alone may have prevented more than 1.5 million eviction filings nationwide during the 11 months it was in force (Rangel et al., 2021). However, there has been relatively little work assessing how municipal moratoria impacted eviction filings, and minimal, if any research comparing national, state, and local moratoria. Thus, in this note I assess the effectiveness of municipal eviction moratoria and compare the effectiveness of various national, state, and municipal moratoria in preventing eviction filings.
Eviction Filings in U.S. Cities
I gather data from the Princeton Eviction Lab's Eviction Tracking System on weekly eviction filings between December 2019 and January 2022 for 31 cities2 and additional data on state and local eviction moratoria from the lab's COVID-19 Housing Policy Scorecard. I also add information on the CARES Act and CDC moratoria from the Congressional Research Service. For some municipalities, the start and end dates of moratoria are not clear; for these I look directly at the underlying legislative or executive source documents, or local news articles if necessary. Figure 2 displays the rate of new filings per 100,000 renting households for three fixed groups of cities classified by the duration of their eviction moratoria: the first group ("short") let their moratoria expire very early in 2020, the second group ("long") extended their moratoria well into 2021, and the third group did not enact any local eviction moratoria. The figure also displays vertical lines denoting the coverage of the CARES Act moratorium and CDC order. While filings drop for all groups at the start of the pandemic (when all of them had eviction moratoria in place), they remain at relatively low levels for the "long" group, whereas they quickly begin to return to pre-pandemic levels for the "short" and "none" groups, increasing faster for the latter. This suggests that local moratoria played a role in preventing eviction filings for the cities in the first group. Moreover, national moratoria appear to impact eviction filings as well: for example, there is a decrease in filings when the CDC order is implemented (after the first blue line), and an increase when it expires (after the second blue line).
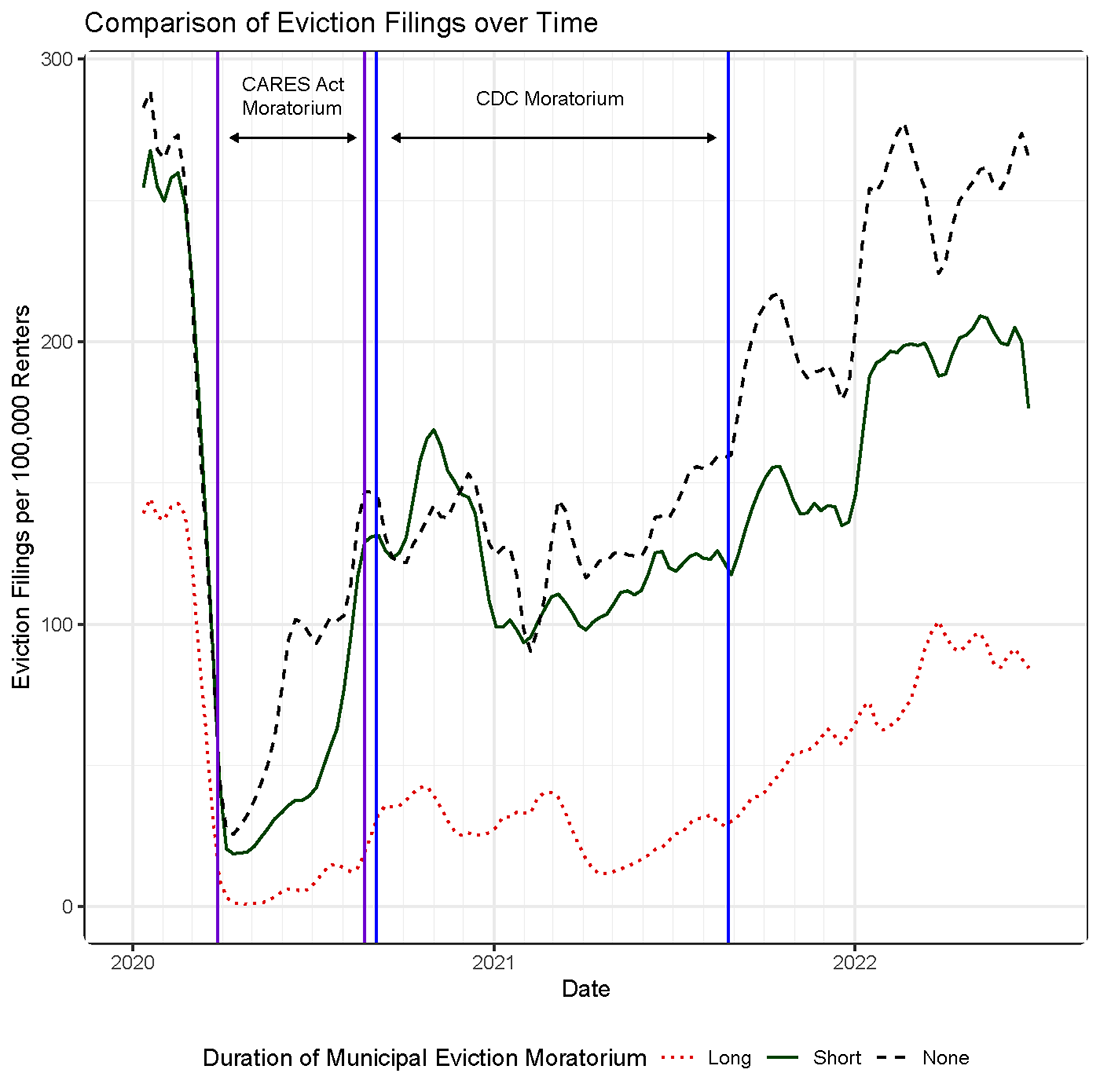
Note: The figure shows the rate of eviction filings (new filings per 100,000 renting households per week) for three groups of cities. The first group, colored red, consists of the following cities whose moratoria lasted until mid or late 2021: Austin, TX and Philadelphia, PA. The second group, in green, consists of all other cities in the sample that enacted an eviction moratorium (see Figure 1). The final group consists of those cities that did not enact any eviction moratorium at the municipal level. Series are smoothed via four-week moving averages. The purple lines denote the start (March 27th, 2020) and end (August 23rd, 2020) of the CARES Act moratorium. The blue lines denote the start (September 4th, 2020) and end (August 26, 2021) of the CDC moratorium.
Sources: Princeton Eviction Lab and Congressional Research Service.
However, while this figure is useful for understanding the evolution of filings over time, it does not take into account conditions in each city's particular rental policy landscape. For example, some cities may have weaker tenant protections, which both increases the rate of eviction filings and reduces the likelihood that these cities enact their own eviction moratoria. Thus, the effects of enacting moratoria based on comparisons such as in Figure 1 may be overstated.
To account for such confounders, I construct a measure of "baseline" eviction filings by calculating the historical average filings for each week of the year for each city (across the years 2015 to 2019). I then calculate the ratio of eviction filings in 2020 and beyond relative to this baseline. Figure 3 plots this ratio (totaled over the entire sample period) for the cities in our sample against the percent of the sample period for which each city had an eviction moratorium in effect.
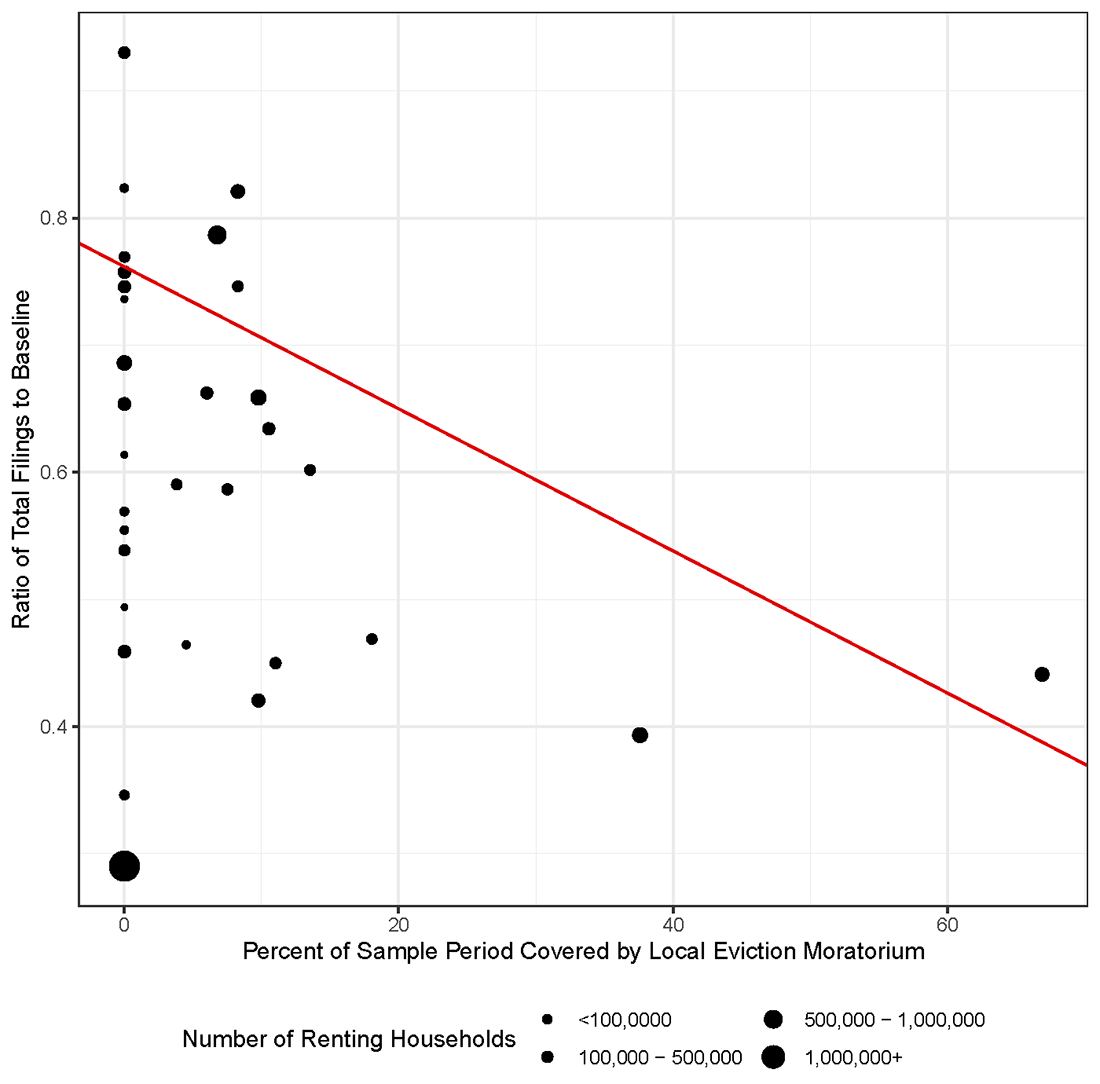
Note: The figure shows the ratio of total eviction filings over 2020 and 2021 to the historical baseline for cities in the sample plotted against the percent of the time period covered by an eviction moratorium in each city. Dots are sized according to the number of renting households in each city. Fitted line (red) uses number of renting households as weights.
Sources: Princeton Eviction Lab, Eviction Tracking System and U.S. Census Bureau.
The figure shows a clear negative association between moratorium length and the ratio of total filings to their pre-pandemic baselines. In other words, cities that maintained their eviction moratoria for longer saw greater reductions in eviction filings relative to pre-pandemic levels. Conversely, cities with shorter or no moratoria have eviction filing levels much closer to their pre-pandemic levels. Thus, even when controlling for historical eviction filing patterns, there is strong evidence that municipal eviction moratoria helped prevent eviction filings.
The Impact of Eviction Moratoria on Eviction Filings
For a more accurate assessment of the impact of various eviction moratoria on eviction filings, I regress outcomes on a series of indicators for municipal, state, and national-level eviction moratoria. Because conditions after a moratorium expires may not be identical to conditions before it is implemented3, I also include indicators for the expiration of moratoria. In addition, I include a dummy for the onset of the pandemic (i.e. date beyond March 15th, 2020) to better distinguish the effects of moratoria being in place from the effects of the pandemic itself. The regressions I estimate are thus of the basic form4:
(1) $$y_{it} = \alpha_i + \beta_1{LOCAL}_{it} + \theta_1{POSTLOCAL}_{it} + \beta_2{STATE}_{it} + \theta_2{POSTSTATE}_{it} + $$
$$\beta_2{CARES}_t + \theta_3{POSTCARES}_t + \beta_4{CDC}_t + \theta_4{POSTCDC}_t + X_{it}^{\prime}\gamma + {Year}_t + {Month}_t + \varepsilon_{it}$$.
For example, "LOCAL" equals one when a local moratorium is in force, and zero otherwise, whereas "POSTLOCAL" equals one only when a previous local moratorium has expired, and zero otherwise (including if no such moratorium was ever enacted). Thus, since all coefficients represent changes relative to the period before a moratorium was enacted, one can estimate the change in the outcome when moratoria are enacted from β1 … β4 in (1)5.
For eviction filings, I use two related outcomes: (1) new filings per week per 100,000 renting households, which allows us to estimate the (population-adjusted) marginal effect of extending a moratorium as opposed to letting it expire; and (2) filings per week as a percent of the pre-pandemic baseline (computed for each week of the year, averaged over 2015 to 2019), which reveals how filings evolved relative to the pre-pandemic average and is more effective than simply including historical eviction filings as a control in the regression.
Finally, as there are likely city-level characteristics that are correlated both with the likelihood of enacting protections and with landlords' eviction filing behavior, I add city-level fixed effects (represented as the $$\alpha_i$$ in (1)). Moreover, to control for time trends, I include year and month effects6. To control for other time-varying covariates that may affect both the enaction of eviction protections and the filing rate, I control for the unemployment rate, COVID-19 deaths, and social distancing as measured by the change in time spent at home relative to January 2020.
Table 1 below presents summary statistics across the entire panel (city, year, and week), except where mentioned.
Table 1: Summary Statistics
| Variable | 1st Quartile | Median | 3rd Quartile | Mean | Standard Deviation | Count |
|---|---|---|---|---|---|---|
| Average Weekly Filings per 100,000 Renting Households | 34.8 | 76.71 | 154.59 | 120.6 | 159.17 | 3,367 |
| Filings as a Percent of Baseline | 18.42 | 39.15 | 67.85 | 47.25 | 39.72 | 3,367 |
| Total Filings | 6,125 | 21,591 | 55,793 | 35,283 | 34,989 | 3,367 |
| Average Weekly Filings, Baseline | 151.26 | 202.9 | 254.54 | 250.8 | 216.75 | 3,367 |
| Number of Weeks Covered by a Local Moratorium (by city) | 0 | 0 | 11 | 9 | 19 | 3,367 |
| Number of Weeks Covered by a State Moratorium (by city) | 9 | 14 | 14 | 15 | 13 | 3,367 |
| Monthly Unemployment Rate7 | 5.2 | 8 | 11.6 | 8.85 | 4.37 | 803 |
| Average Weekly COVID-19 Deaths per 100,000 Residents | 0.04 | 0.76 | 2.49 | 2.71 | 7.18 | 3,280 |
| Percent Change in Time Spent at Home Relative to January 2020 | 5.86 | 8.86 | 12.23 | 9.66 | 5.3 | 2,940 |
| Number of Renting Households | 149,156 | 282,628 | 2,131,414 | 904,366 | 929,509 | 3,367 |
Notes: Statistics are weighted by the number of renting households in each city.
Sources: Princeton Eviction lab (filings and moratoria), Bureau of Labor Statistics (unemployment), Centers for Disease Control and Prevention (COVID-19 deaths), Google, LLC (time spent at home), Census Bureau (demographics), author’s calculations.
Table 2 presents results from estimating the regressions as previously described. The first two columns report outcomes in terms of filings per 100,000 renting households, and the latter two report filings as a percent of the pre-pandemic baseline.
Table 2: Regression Results
| Outcome: | Filings per 100,000 Renters | Filings as Percent of Baseline | |||
|---|---|---|---|---|---|
| Model: | No Controls | Controls | No Controls | Controls | |
| A. Municipal Ban | I. In Force | -33.12** | -34.92*** | -21.68*** | -22.58*** |
| (13.33) | (13.35) | (3.80) | (3.82) | ||
| II. Expired | -9.94 | -20.24 | -6.52* | -9.20** | |
| (13.12) | (13.18) | (3.74) | (3.77) | ||
| B. State Ban | I. In Force | -66.92*** | -72.73*** | -19.65*** | -19.94*** |
| (18.91) | (19.13) | (5.39) | (5.47) | ||
| II. Expired | -23.28*** | -25.95 | -1.08 | -1.40 | |
| (19.30) | (19.18) | (5.51) | (5.49) | ||
| C. CARES Act Moratorium (March 27th, 2020 – August 23rd, 2020) | I. In Force | -73.36*** | -25.73 | -19.63*** | -5.71 |
| (15.06) | (17.91) | (4.30) | (5.12) | ||
| II. Expired | -12.66 | 29.82 | 28.58*** | 40.63*** | |
| (19.66) | (21.17) | (5.61) | (6.05) | ||
| D. CDC Order (September 4th, 2020 – September 9th, 2021) | I. In Force | -54.64*** | -58.84*** | -18.64*** | -19.53*** |
| (20.37) | (20.24) | (5.81) | (5.79) | ||
| II. Expired | -73.45** | -74.32** | 1.90 | 2.27 | |
| (35.01) | (34.79) | (9.99) | (9.95) | ||
| Date beyond March 15, 2020 | -67.41*** | -44.26** | -43.85*** | -37.32*** | |
| (18.84) | (20.18) | (5.38) | (5.77) | ||
| Monthly Unemployment Rate | n.a. | -4.16*** | n.a. | -1.24*** | |
| (1.03) | (0.29) | ||||
| Change in Hours Spent at Home (Relative to January 2020) | n.a. | -1.77** | n.a. | -0.46* | |
| (0.84) | (0.24) | ||||
| New COVID-19 Deaths per 100,000 Residents | n.a. | 1.12*** | n.a. | 0.16* | |
| (0.32) | (0.09) | ||||
| N | 2,940 | 2,940 | 2,940 | 2,940 | |
| R2 | 0.17 | 0.18 | 0.36 | 0.37 | |
| F Statistic | 39.21*** (df = 21; 2889) | 36.72*** (df = 24; 2886) | 90.15*** (df = 21; 2889) | 81.00*** (df = 24; 2886) | |
Notes: ***Significant at the 1 percent level. **Significant at the 5 percent level. *Significant at the 10 percent level. All specifications are weighted by the number of renting households. Standard errors clustered by city.
Sources: Princeton Eviction Lab, Bureau of Labor Statistics, Centers for Disease Control and Prevention, Google, LLC, author’s calculations.
The first row (A-I) in Table 2 suggests that local eviction moratoria were highly effective, as all the coefficients are negative and statistically significant, indicating that eviction filings in both level and percentage terms were much lower in moratorium periods relative to before the pandemic. Conversely, filings are not significantly different from pre-pandemic levels once local moratoria expire, although there is a small persistent decline when they are measured as a percent of the baseline. This suggests that eviction filings increased again once moratoria expired, though perhaps without fully returning to pre-pandemic levels. Roughly speaking, moratoria may have prevented about 33 fewer filings per 100,000 per week, which is slightly lower than the estimates found by Rangel et. al (2021) for the CDC order (about 45). In percentage terms, they are associated with a little over 20 percent fewer filings relative to the baseline (columns 3 and 4). In aggregate, this amounts to about half a million total filings prevented across our entire sample.
State-level bans appear to be twice as effective as local moratoria (row B-I, columns 1 and 2) in level terms, but slightly less effective in percentage terms (columns 3 and 4). This suggests that state eviction moratoria were more effective as local moratoria in preventing eviction filings, but their effects may have been concentrated in areas with a higher baseline rate of eviction filings. As with local moratoria, they are not associated with significant differences in filings relative to the pre-pandemic period after expiration.
Finally, the CARES Act (row C) at first glance appears to be more effective than state or local moratoria, but the effect virtually disappears after including controls. In other words, the purposed effect is largely explained away by other time-varying factors in the same period, such as the unemployment rate and number of Covid-19 deaths. The smaller estimated effect may be because the Act applied only to federally financed (GSE-backed) rental properties, whereas local moratoria applied to a broader class of rental properties. Conversely, the CDC order (row D-I) has a much stronger effect, with a coefficient larger than that on local moratoria, even after including controls. This is likely because it had a much broader scope, even if its enforcement varied across jurisdictions. In percentage terms, the order, like with local and state moratoria, is associated with nearly a twenty percent reduction in eviction filings relative to the baseline. Although evictions filings are even lower in the period after it expires (row D-II, columns 1 and 2), this does not necessarily mean that the order was ineffective, especially as this pattern does not occur when adjusting for the baseline (D-II, columns 3 and 4). The estimated effect is about one-fifth greater than the estimates found by Rangel et al. (2021), who assume that evictions would have occurred at the pre-pandemic rate if it were not for the CDC order, and do not control for time-varying conditions such as the unemployment rate. However, it is more likely that in the absence of the CDC order, evictions would have occurred at an even higher rate relative to before the pandemic. In addition, Rangel et al. rely on extrapolation to infer eviction filings in out-of-sample areas, which may not be reliable.
Conclusion
In this note, I have shown that municipal, state, and national eviction moratoria are strongly associated with a reduction in eviction filings, both in terms of filings per week and filings as a percentage of the pre-pandemic baseline. I find a larger effect for state bans in terms of filings per week, although the impact is slightly smaller when expressed as a percentage of the baseline, potentially suggesting differences in the geographic concentration of effects. For the CARES Act, I find little effect after controlling for demographic and pandemic-related factors, whereas I consistently find a large effect for the CDC order. This is perhaps because the CARES Act was of shorter duration and narrower scope than the CDC order. Of all eviction moratoria, state-level bans appear to have been by far the most effective, being associated with nearly twice as many fewer eviction filings when in force compared to local moratoria. Further work could more accurately quantify the strength of various moratoria, for example by grading their provisions on a qualitative scale or exploiting differences in courts' willingness to enforce them, in order to explain why certain moratoria were more effective than others. Such work could also attempt to investigate the relationship between moratorium length and effect size or compare the impacts of national and local moratoria on secondary outcomes, such as rent growth or the supply of rental housing.
Works Cited
An, Xudong, Stuart A. Gabriel, and Nitzan Tzur-Ilan (2021). "More Than Shelter: The Effects of Rental Eviction Moratoria on Household Well-Being," unpublished paper, November, http://dx.doi.org/10.2139/ssrn.3801217.
Banerjee, Abhijit, and Maitreesh Ghatak (2003). "Eviction Threats and Investment Incentives," Discussion Paper No. DEDPS/39. London: Suntory and Toyota International Centres for Economics and Related Disciplines, June, https://sticerd.lse.ac.uk/dps/de/dedps39.pdf.
Benfer, Emily A., David Vlahov, Marissa Y. Long, Evan Walker-Wells, J.L. Pottenger Jr., Gregg Gonsalves, and Danya E. Keene (2021). "Eviction, Health Inequity, and the Spread of COVID-19: Housing Policy as a Primary Pandemic Mitigation Strategy," Journal of Urban Health, vol. 98 (February), pp. 1–12.
Callaway, Brantly, and Pedro H.C. Sant'Anna (2021). "Difference-in-Differences with Multiple Time Periods," Journal of Econometrics, vol. 225 (December), pp. 200–30.
Centers for Disease Control and Prevention (2020), "Temporary Halt in Residential Evictions to Prevent the Further Spread of COVID-19," agency order, Federal Register, vol. 85 (September 4), pp. 55292–97.
Desmond, Matthew, and Rachel Tolbert Kimbro (2015). "Eviction's Fallout: Housing, Hardship, and Health," Social Forces, vol. 94 (September), pp. 295–324.
Garboden, Philip M.E., and Eva Rosen (2019). "Serial Filing: How Landlords Use the Threat of Eviction," City & Community, vol. 18 (June), pp. 638–61.
Goodman-Bacon, Andrew (2021). "Difference-in-Differences with Variation in Treatment Timing," Journal of Econometrics, vol. 225 (December), pp. 254–77.
Jowers, Kay, Christopher Timmins, Nrupen Bhavsar, Qihui Hu, and Julia Marshall (2021). "Housing Precarity & the COVID-19 Pandemic: Impacts of Utility Disconnection and Eviction Moratoria on Infections and Deaths Across US Counties," NBER Working Paper Series 28394. Cambridge, Mass.: National Bureau of Economic Research, January, http://www.nber.org/papers/w28394.pdf.
Leung, Lillian, Peter Hepburn, Matthew Desmond (2021). "Serial Eviction Filing: Civil Courts, Property Management, and the Threat of Displacement," Social Forces, vol. 100 (September), pp. 316–44.
McCarty, Maggie, and Libby Perl (2021). "Federal Eviction Moratoriums in Response to the COVID-19 Pandemic," Congressional Research Service, March.
Parrot, Jim and Mark Zandi (2021). "Averting an Eviction Crisis", The Urban Institute, January.
Hepburn, Peter, Renee Louis, and Matthew Desmond. Eviction Tracking System: Version 1.0. Princeton: Princeton University, 2020. www.evictionlab.org.
Rangel, Jasmine and Jacob Haas, Emily Lemmerman, Joe Fish, and Peter Hepburn (2021). "Preliminary Analysis: Eleven Months of the CDC Moratorium". Princeton Eviction Lab (August).
1. This is the date on which the Supreme Court judgement in Alabama Association of Realtors, et al. v. Department of Health and Human Services, et al. (594 US ___, 2021) struck down the CDC's extension of the original order, which expired on July 31st, 2021. Return to text
2. While the dataset covers most major U.S. metro areas, it notably lacks coverage in California, the Midwest, and the Pacific Northwest. Return to text
3. Under idealized conditions, if the change from enactment and change from expiration were equal, it would be easy to attribute this effect to the moratorium. In general, a comparison to the "pre" period is preferable because it provides an answer to the question of how many eviction filings would have occurred in the absence of moratoria. However, in this scenario, because many cities and states enacted moratoria just as the pandemic hit, it is more difficult to differentiate the impact of the pandemic from the impact of moratoria being enacted. In that sense, comparing to the "post" period is useful because it shows how eviction filings changed after moratoria expired, where there is more temporal variation; however, it does not answer the same question. In general, I will follow convention and compare to "pre", pointing out differences to "post" where relevant. The use of additional controls and fixed effects should alleviate further concerns about the validity of comparing to "pre". Return to text
4. One can think of this as a staggered difference-in-differences specification where the treatment is non-absorbing (that is, where treated units do not necessarily remain treated), and where there are multiple treatments. Thus, the difference between this specification and a standard staggered difference-in-differences specification (such as detailed in Goodman-Bacon, 2021, or Callaway and Santa'Anna, 2021) is (1) an additional dummy for what I call "end of treatment for the treated," and (2) the inclusion of multiple pairs of treatment dummies, in this case the various municipal and national eviction moratoria, indexed 1 to 4. Return to text
5. Additionally, as the θ1 … θ4 represent the change in the outcome when moratoria expire relative to the pre-moratorium period, one can instead obtain the change relative to the period they were in force by subtracting the first set of coefficients, i.e. via θ1 – β1 … θ4 – β4. In other words, the βs capture how outcomes change from "pre" to "during", the θs capture how outcomes change from "pre" to "post", and the θ – β terms capture how outcomes change from "during" to "post". However, I will ultimately prefer β for assessing the effectiveness of eviction moratoria (see footnote 3 above). Return to text
6. That is, I choose to include year and month fixed effects separately, rather than year times month effects, which would make it difficult to identify the effect of the CARES Act and CDC order. The main disadvantage of doing so is that I can only assume that time effects are constant within year, changing discretely from year to year (another, smaller disadvantage is the assumption that the monthly effects are the same for each year). However, when estimating results using time-varying controls and year times month fixed effects, the coefficients are not very different from those obtained using time-varying controls and year plus month fixed effects. In particular, using full fixed effects and dropping the national indicators drops the coefficient on local moratoria by and on state moratoria by about 5 filings per 100,000 and about one percent of filings relative to the baseline, with an increase in R2 of one to two percent. Return to text
7. These data are monthly, so I assume that the unemployment rate for each week within a given month is the same as the overall rate for the month (i.e., constant interpolation). Return to text
Raajkumar, Adithya V. (2022). "How Effective Were National, State, and Local Eviction Moratoria?," FEDS Notes. Washington: Board of Governors of the Federal Reserve System, June 21, 2022, https://doi.org/10.17016/2380-7172.3128.
Disclaimer: FEDS Notes are articles in which Board staff offer their own views and present analysis on a range of topics in economics and finance. These articles are shorter and less technically oriented than FEDS Working Papers and IFDP papers.