FEDS Notes
December 21, 2018
How the Largest Bank Holding Companies Grew: Organic Growth or Acquisitions?
Robert Adams and John Driscoll1
- Introduction
The U.S. banking industry has experienced substantial growth over the past few decades, especially at the very largest institutions. The figure below plots real assets of the top four banking organizations and those of the remainder of the industry. From December 31, 1990 through December 31, 2016, industry consolidated assets rose from about $5.5 trillion to $19.5 trillion in real terms--an increase of 256 percent, or an average of slightly over 5.2 percent per year.2
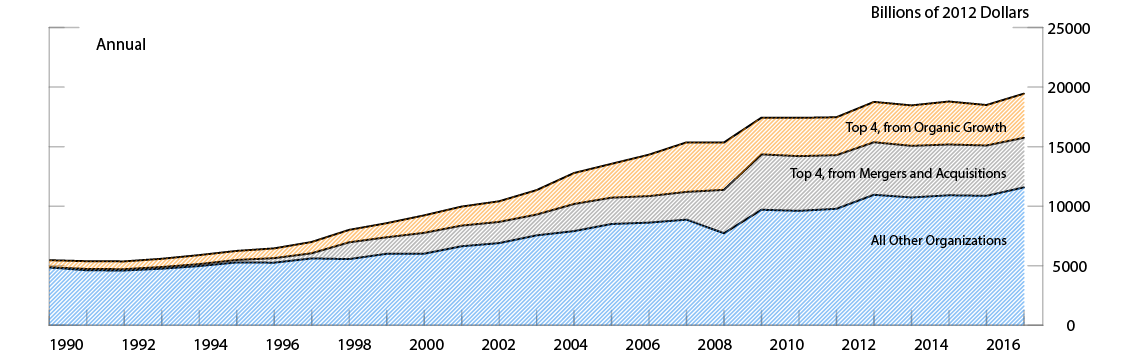
Source: Call Reports, FR Y-9C.
Real assets of the top four organizations grew from approximately $598.5 billion in 1990 to $7.9 trillion in 2016.3 Their share of industry assets increased from about 11 percent more than 40 percent over that period. The figure breaks out assets of organizations into those assets obtained through mergers and acquisitions and those from other sources (or "organic growth"). Clearly, mergers and acquisitions have played a significant role in the growth of these firms.
The concentration of assets into a few very large firms has led to concerns about industry competition and financial stability. While research on overall concentration in banking is extensive, little has been conducted on the sources of growth for largest banking organizations. In this note, we decompose growth into that related to mergers and acquisitions (M&A) and to all other sources.4 We find that M&A-related growth accounts for a substantial amount of growth of the largest four banking organizations over the period--more than half for all but one of them. Much of M&A-related growth occurred prior to, and especially during, the financial crisis.
In the remainder of this note, we discuss factors that have affected growth and consolidation; describe our data sources and methodology; and present results.
- Factors Affecting Growth and Consolidation
Over the past 25 years, the banking industry has experienced significant regulatory and technological changes. Major regulatory changes have occurred frequently and some have made growth through mergers and acquisitions easier or more profitable to undertake--for example, the Riegle-Neal Interstate Banking and Branching Efficiency Act (Riegle-Neal) and Gramm Leach Bliley Act (GLB). Riegle-Neal legalized interstate banking across the entire United States, while GLB allowed banks to enter non-banking activities (thus removing Glass Steagall restrictions).5 In contrast, other restrictions have made mergers and acquisitions more difficult. For example, Dodd-Frank added more restrictions to growth through mergers and acquisitions, primarily by including a financial stability standard to merger evaluation and restrictions on total labilities resulting from a merger.
While technological change and innovation in financial markets might have promoted growth through mergers and acquisitions, such changes could also contribute to organic growth. Greater use of computers and data might allow banks to provide services over greater distances. Data driven underwriting standards and the broad use of credit scoring might also allow banks to operate over broad areas without a branch presence. In some credit markets such as credit cards and mortgages, banks are able to originate loans on a national level. However, for many other financial products, banks may still rely on a branch network. In fact, most banks that provide retail products and services rely on branches.6 The largest organizations own large branch networks with each organization typically owning thousands of branches.7 Anenberg et al (2018) discuss why branches are still relevant in banking.8
There is an extensive literature on the extent and causes of consolidation in the banking industry. Jones and Critchfield (2005) provide an excellent summary of the research on bank industry consolidation through 2003. Kowlik et al (2014) extend the analysis on mergers through 2014. Rhoades (2000), Pillof (2004) and Adams (2012) describe mergers and acquisitions in the industry from 1980 through 2010.9 These papers note that most mergers occur between small institutions. While fewer in number, the largest transactions account for most merged assets. While the research has analyzed overall consolidation and merger activity, no one has yet documented systematically the role of mergers and acquisitions in the growth of the largest organizations.
- Data and Methodology
Our case study focuses on the four largest banking organizations by total assets in 2016: JP Morgan Chase, Bank of America, Wells Fargo, and Citigroup. At the end of 2016, these organizations are all at least twice the size of the fifth largest organization. They all engage in retail banking: deposit-taking from and loan making to customers at individual branches or online. But they also engage in other banking activities such as investment banking and wealth management. In order to draw comparisons, we also consider four large regional banking organizations: PNC, Regions, SunTrust, and US Bancorp--that compete mainly in retail banking. Our analysis of these institutions will show the extent to which M&A-related activity is differentially driving growth. We study these eight institutions over the period from December 31, 1990 to December 31, 2016.
We use annual data from the FR Y-9C bank holding company forms--the quarterly regulatory reports required of BHCs that are comparable to the Call Reports required of banks and thrifts. We use end of year total assets in each year for the top holding BHC.
To identify mergers and acquisitions or any other type of asset acquisition, we draw on several data sources.10 We use data from SNL Financial to track most mergers and acquisitions. We then supplement these data using the National Information Center transactions data and the 10Q announcements to capture significant portfolio acquisitions and other transactions. We include only transactions of unrelated institutions, omitting reorganizations--that is, transactions between two institutions under the same top holding company.
The process of identifying mergers and acquisitions is imperfect. Not all transactions are captured or information on some transactions is not available. For example, asset information on acquisitions of non-bank entities is often not available. Hence, our results should represent a lower bound on the importance of mergers and acquisitions.
We calculate total asset growth, and then break that growth down into the portion attributable to mergers and acquisitions ("M&A-related" growth) and the remainder ("organic" growth). To compute M&A-related growth, we sum acquired assets over the period and add it to the initial level of assets. Organic growth is then the difference between total growth and M&A-related growth. For greater ease in comparing growth rates computed over different time periods, we also convert growth into average annual rates.
In making a decomposition between organic growth and growth from mergers and acquisitions, we implicitly assume that organic growth in a given year is not affected by mergers and acquisitions in that year. We also assume that the total value of acquired assets did not change between filing data for the data and the actual merger date.11 However, some transactions during the financial crisis, such as the Wells Fargo acquisition of Wachovia or the JP Morgan acquisition of Bear Stearns, represent exceptions. Our estimates before the financial crisis will likely understate asset growth attributed to mergers and acquisitions. Growth attributed to mergers and acquisitions during the financial crisis may be overstated for this reason.
- Results
Table 1 shows real growth over the entire period from 1990 – 2016, broken down into M&A-related and organic growth, for the four largest banks and the four large regional banks.12 Total growth of the largest banking organization outstripped the 265 percent growth of the entire industry by a substantial margin, ranging from 395 percent for Citibank to 3,677 percent for Wells Fargo. Growth of the large regional banks also outstripped the industry average, but by a smaller margin, with increases ranging from 368 percent for Suntrust to 1,307 percent for USBank.
As shown in the third column, for both types of institutions, M&A-related growth accounted for a substantial portion of this large growth--more than half for all but one of the institutions. Two institutions--Bank of America and Regions Bank--decreased in size once the effects of M&A activity are accounted for. Organic growth is still greater than industry average total growth for most of the institutions.
Tables 2A-2C show how the decomposition between M&A-related and organic growth vary over the pre-crisis (1990-2006), crisis (2007-2011) and post-crisis (2012-2016) periods. Because the time periods differ, it may be easier to make comparisons by examining the average annual growth rates, presented in the last three columns of each table. Pre-crisis, both M&A-related and organic growth contributed substantially to the double-digit overall annualized growth rates. During the crisis, organic growth was negative for most institutions, with organic growth rates ranging from -13 to 4 percent per year. Post-crisis, there has been little M&A-related growth and even more sluggish organic growth, resulting in total growth ranging from -2 to +6 percent per year.
To further illustrate the role of mergers and acquisitions in banking consolidation, consider the following hypothetical example. Restrict the real asset growth of these four largest banking organizations to that of real GDP, 91 percent, over the time period, while leaving total real industry assets in 2016 at the same level. In 1990, these four large banking organizations accounted for $598.5 billion in real total assets. Restricting their growth through 2016 results in real total assets of $1,143 billion for the top 4 as opposed to actual $7,874 billion in real total assets.13 Thus, the share of total assets would have fallen from about 11 percent to 6 percent.14 Note if we assume the largest banks grew at the same rate as the entire industry (256 percent), then their share of total assets would have been unchanged at about 11 percent. Finally, if we remove the assets of the top 4 organizations from the total industry assets, these residual assets grew by 138 percent.
Several factors explain the relatively smaller role of organic growth during this period. First, obtaining additional deposits or depositor relationships through improved pricing and services is difficult.15 Depositors are reluctant to change banks because of switching costs and potentially strong preferences for specific branch locations.16 Second, some retail products such as small business lending and services traditionally rely on relationships between bankers and customers. Finally, despite technology changes, branches continue to be a vital platform to deliver banking services. While the number of branches has increased dramatically over the past 25 years peaking at almost 99,000, mergers and acquisitions represent a straight forward, potentially easier method of expanding into new markets.17
One question that arises is why the industry evolved in this manner. Historically, the main legal hurdle for mergers and acquisitions has been antitrust enforcement by bank regulators and the Department of Justice's Antitrust Division. The national deposit cap only became an issue for the largest organizations during the past decade. The focus of antitrust enforcement was on local markets rather than on national concentration. Antitrust enforcement resulted in fairly stable with Herfindahl-Hirschmann Index (HHI) concentration measures climbing slightly from an average of 1,468 in metropolitan statistical areas and 3,788 in rural counties in 1990 to 1712 and 3,798, respectively in 2016.18
- Conclusion
Large banking organizations have grown substantially since 1990, raising concerns about both industry competition and financial stability. While much of this growth is attributable to "organic" factors, mergers and acquisitions have been a sizable determinant in the growth of the four largest banking organizations and the larger regional banking organizations. Understanding the distinction between these two types of growth may be helpful in shaping regulatory approaches towards these large organizations. Much of the impact of mergers and acquisitions occurred before and during the recent financial crisis. Since the crisis, there has been little M&A-related activity among the institutions we study. It is not yet clear whether that development is due to regulatory or other changes, and whether the causes of large banking organization growth will shift to largely being organic or if they will return to their pre-crisis patterns.
- References
Adams, Robert M. (2012) "Consolidation and merger Activity in the United States Banking Industry from 2000 through 2010" Finance and Economics Discussion Series 2012-51. Board of Governors of the Federal Reserve System (U.S.).
Adams, Robert M., Avery, Robert B., Borzekowski, Ron (2007) "The Value of Location in Bank Competition: Examining the Effect of Wal-Mart Branches," Proceedings of the 43rd Annual Conference on Bank Structure and Competition: The Mixing of Banking and Commerce.
Anenberg, Elliot, Chang, Andrew C., Grundl, Serafin, Moore, Kevin B., and Windle, Richard (2018) "The Branch Puzzle: Why Are There Still Bank Branches?" Federal Reserve Note forthcoming.
DeYoung, Robert, Evanoff, Douglas D., and Molyneux, Philip (2009) "Mergers and Acquisitions of Financial Institutions: A Review of the Post-2000 Literature," Journal of Financial Services Research, v. 36, pp. 87-110.
Hannan, Timothy H., and Robert M. Adams (2011). "Consumer Switching Costs and Firm Pricing: Evidence from Bank Pricing of Deposit Accounts," Journal of Industrial Economics, vol. 59, no. 2, pp. 296-320.
Jones, Kenneth D. and Critchfield, Tim (2005) "Consolidation in the U.S. Banking Industry: Is the "Long Strange Trip" About to End?" FDIC Banking Review Volume 17, No. 4.
Kiser, Elizabeth K. (2002). "Household Switching Behavior at Depository Institutions: Evidence from Survey Data," Antitrust Bulletin, vol. 47, no. 4, pp. 619-640.
Kowalik, Michael, Davig, Troy, Morris, Charles S., and Regehr, Kristen (2015) "Bank Consolidation and Merger Activity Following the Crisis" Federal reserve bank of Kansas City Economic Review First Quarter 2015.
Pilloff , Steven J. (2004) "Bank Merger Activity in the United States, 1994-2003" Federal Reserve Board Staff Study 176
Rhoades, Stephen A. (2000) "Bank Mergers and Banking Structure in the United States, 1980-98," Federal Reserve Board Staff Study 174
Table 1: Growth from 1990 to 2016
| Bank Name | Period Growth (percent) | Average Annual Growth (percent per year) | ||||
|---|---|---|---|---|---|---|
| Total | Organic | M&A-Related | Total | Organic | M&A-Related | |
| Bank of America | 1,910 | -225 | 2,134 | 12 | -1 | 13 |
| Citi | 395 | 217 | 178 | 6 | 5 | 4 |
| JPMorgan | 1,945 | 773 | 1,172 | 12 | 9 | 10 |
| Wells Fargo | 3,677 | 1,563 | 2,114 | 15 | 11 | 13 |
| PNC | 381 | 74 | 307 | 6 | 2 | 6 |
| Regions | 1,088 | -17 | 1,105 | 10 | -1 | 10 |
| Suntrust | 268 | 124 | 144 | 5 | 3 | 3 |
| USBank | 1,307 | 617 | 690 | 11 | 8 | 8 |
Table 2A: Growth from 1990 to 2006
| Bank Name | Period Growth (percent) | Average Annual Growth (percent per year) | ||||
|---|---|---|---|---|---|---|
| Total | Organic | M&A-Related | Total | Organic | M&A-Related | |
| Bank of America | 1,479 | 691 | 788 | 19 | 14 | 15 |
| Citi | 512 | 334 | 178 | 12 | 10 | 7 |
| JPMorgan | 1,204 | 345 | 859 | 17 | 10 | 15 |
| Wells Fargo | 1,008 | 592 | 416 | 16 | 13 | 11 |
| PNC | 57 | 32 | 25 | 3 | 2 | 1 |
| Regions | 1,487 | 382 | 1,105 | 19 | 10 | 17 |
| Suntrust | 284 | 144 | 140 | 9 | 6 | 6 |
| USBank | 713 | 168 | 544 | 14 | 6 | 12 |
Table 2B: Growth from 2007 to 2011
| Bank Name | Period Growth (percent) | Average Annual Growth (percent per year) | ||||
|---|---|---|---|---|---|---|
| Total | Organic | M&A-Related | Total | Organic | M&A-Related | |
| Bank of America | 34 | -51 | 85 | 6 | -13 | 13 |
| Citi | -9 | -9 | 0 | -2 | -2 | 0 |
| JPMorgan | 54 | 30 | 24 | 9 | 5 | 4 |
| Wells Fargo | 150 | -3 | 153 | 20 | -1 | 20 |
| PNC | 145 | -13 | 157 | 20 | -3 | 21 |
| Regions | -19 | -19 | 0 | -4 | -4 | 0 |
| Suntrust | -11 | -12 | 1 | -2 | -2 | 0 |
| USBank | 42 | 24 | 18 | 7 | 4 | 3 |
Table 2C: Growth from 2012 to 2016
| Bank Name | Period Growth (percent) | Average Annual Growth (percent per year) | ||||
|---|---|---|---|---|---|---|
| Total | Organic | M&A-Related | Total | Organic | M&A-Related | |
| Bank of America | -5 | -5 | 0 | -1 | -1 | 0 |
| Citi | -11 | -11 | 0 | -2 | -2 | 0 |
| JPMorgan | 2 | 2 | 0 | 0 | 0 | 0 |
| Wells Fargo | 36 | 36 | 0 | 6 | 6 | 0 |
| PNC | 25 | 16 | 9 | 5 | 3 | 2 |
| Regions | -8 | -8 | 0 | -2 | -2 | 0 |
| Suntrust | 8 | 8 | 0 | 1 | 1 | 0 |
| USBank | 22 | 22 | 0 | 4 | 4 | 0 |
1. Board of Governors of the Federal Reserve System. The views in this document do not necessarily reflect those of the Federal Reserve System, its Board of Governors, or its staff. We would like to thank Rachael Beer and Lucas Nathe for excellent research assistance Return to text
2. Industry consolidated assets includes bank holding companies and independent commercial banks. Real GDP grew 91 percent over the same time period. Return to text
3. The top four organizations are JP Morgan, Bank of America, Citigroup, and Wells Fargo. Return to text
4. Although we focus on the very largest organizations, consolidation has occurred across the range of bank sizes. Return to text
5. Riegle-Neal also includes a 10 percent national deposit cap and a statewide deposit cap of 30 percent (that can be raised or lowered by the individual states). Return to text
6. USAA is one example of a bank that relies less on branches. Only a few, very small, internet-only banks exist. Return to text
7. Only Citigroup owned fewer than 1,000 branches with 758 branches in 2016. Return to text
8. Anenberg et al (2018) only consider branches of insured commercial banks. Return to text
9. Because banking organization structures are complex, identifying bank mergers can be complicated. Return to text
10. Tracking institutions over time can be complicated due to changes in organizational structure or name. We designate the largest banking organization to be the predecessor one. For example, the predecessor of Wells Fargo is NorWest, since it was the largest organization, when they merged. Return to text
11. This assumption is more problematic during the financial crisis, when asset values decreased considerably over short periods of time. Return to text
12. Nominal growth rates show the same trends, but are significantly larger. Return to text
13. The results are not qualitatively different if we use the top 4 institutions in 1990 as a starting point. Return to text
14. The number of banks would almost certainly be at its current level, because most mergers occur between small banks. Return to text
15. While national concentration has increased dramatically over the past two decades, average local market concentration has remained virtually unchanged. Return to text
16. The economics literature has identified switching costs in banking. See Kiser (2002) and Hannan and Adams (2011). Return to text
17. Total branches include commercial banks and thrifts. Return to text
18. HHI calculations include thrift deposits weighted at 50 percent. Return to text
Adams, Robert, and John Driscoll (2018). "How the Largest Bank Holding Companies Grew: Organic Growth or Acquisitions?," FEDS Notes. Washington: Board of Governors of the Federal Reserve System, December 21, 2018, https://doi.org/10.17016/2380-7172.2282.
Disclaimer: FEDS Notes are articles in which Board staff offer their own views and present analysis on a range of topics in economics and finance. These articles are shorter and less technically oriented than FEDS Working Papers and IFDP papers.