FEDS Notes
July 07, 2022
Income Declines During COVID-19
Jeff Larrimore, Jacob Mortenson, and David Splinter*
The COVID-19 pandemic caused regressive income declines, but also led to progressive policy responses. Using administrative U.S. tax data, which are a near-universal panel dataset that can track income changes over time, we consider the distribution of annual income declines during the COVID-19 pandemic relative to the Great Recession. We then show how the unprecedented policy response to the pandemic, through enhanced unemployment insurance benefits and stimulus checks, affected the distribution of these declines.
When considering only market income sources, the COVID-19 recession was far more regressive in its effects than the Great Recession. Working-age adults in the bottom quintile of the prior-year income distribution were 17 percent more likely to experience a large (10 percent) real annual income decline in 2020 than they were in 2009. Conversely, among the top quintile, large income declines were 11 percent less frequent in 2020 than during the Great Recession.
The COVID-19 public policy response, however, was larger and far more progressive than during the Great Recession. Unemployed workers received a supplemental $600 per week of unemployment insurance benefits. Total unemployment benefits are well captured in administrative data, whereas more than half were underreported in the Current Population Survey during the pandemic (Larrimore, Mortenson, and Splinter 2022). Most adults also received stimulus checks of $1,800 and an additional $1,100 per qualifying child. The flat benefit structure means that both supplemental unemployment benefits and stimulus checks reflected a larger share of income for low-income adults. Given the progressive nature of these programs, when considering income after taxes and transfers, large income declines among the bottom of the distribution were not only less frequent than during the Great Recession but were also less frequent than during the 2019 expansion year.
I. Data and Methods
This paper primarily uses IRS annual tax return data from Form 1040. Because not everyone files a tax return, we supplement these data with information return data that are provided to the IRS by employers and other third parties. The combined population in these data include approximately all non-institutionalized adults in the United States. Incomes captured on information returns include wages and salaries, self-employment income, interest and dividends, unemployment insurance, Social Security benefits, and retirement distributions (excluding rollovers).
We draw a five percent sample of all individuals found on a tax return or information return based on the last three digits of masked Taxpayer Identification Numbers. From this representative sample, we create two-year panels. To focus on people with a connection to the labor market, we restrict our sample to individuals of working age—between ages 25 to 59 in year t—and who had positive income after taxes and transfers in year t–1.
Our data include all tax filings processed by the IRS as of December 20, 2021. Although some 2020 tax returns will later be added due to late filings, these records are nearly complete, and we capture essentially all late-filing adults as non-filers based on their information returns.
A. Income Definitions
We consider income both before and after the effects of public policy. First, we define market income as total income from private sources on tax returns plus income observable on information returns—wages and salaries; self-employment and business income; as well as interest and dividends—but exclude realized capital gains, alimony payments, half of self-employment taxes (to make comparable to wages), non-Roth retirement account rollovers, and reported transfers (Social Security benefits, disability insurance, and unemployment insurance). Non-filer incomes, as well as the treatment of their self-employment earnings, are based on information returns following Larrimore, Mortenson, and Splinter (2021).
The second income definition is income after taxes and transfers, which begins with market income, removes federal tax liability from individual income tax returns (but not state or payroll taxes), and adds refundable tax credits (the earned income and refundable child credits), reported transfers, and stimulus checks (including economic income payments and amounts claimed on tax returns). We do not, however, include forgiven Payroll Protection Program (PPP) loans since this forgiveness is not taxable income and does not appear on tax returns. While this measure is narrower than national income or Haig-Simons measures and excludes non-taxable cash and in-kind transfers, it reflects the effects of major public programs enacted in response to the pandemic, such as enhanced unemployment benefits and stimulus checks.1
To convert tax-unit incomes to adult-level incomes, for married couples with jointly filed tax returns, we equally split income between spouses.2 This helps control for income changes due to marriage or divorce. All incomes are bottom-coded at zero and are adjusted to 2020 dollars using the chained CPI. Income centiles are defined based on prior-year incomes after taxes and transfers among working-age adults.
II. Results
In 2020, 33 percent of working-age adults with prior-year income were in tax units experiencing a real market income annual decline of at least 10 percent. This matches the frequency of large market income declines during the Great Recession—in 2009, 33 percent of working-age adults experienced a similar income decline.
In every year, there is substantial income volatility which results in a large share of adults having large income increases or decreases. However, recessions show more market income decreases than non-recession years. For example, the 33 percent of working-age adults with at least a 10 percent decline in 2020 far exceeds the 26 percent who experienced this magnitude of a decline in 2019.3
A. Distribution of Market Income Declines
The COVID-19 recession and the Great Recession caused large market income declines among different groups. This can be observed in Figure 1, which shows the share of working-age adults with a large (10 percent) income decline based on their centile in the prior-year income distribution.
Figure 1. Share of working-age adults in tax units with at least a 10 percent decline in real market income (by prior-year income)
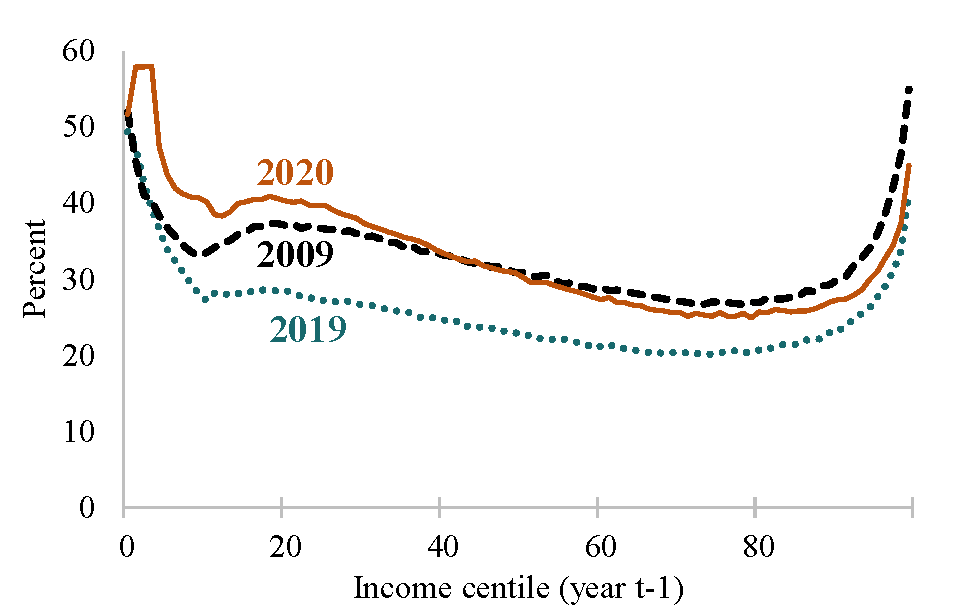
Notes: Among adults aged 25 to 59. Market income is non-transfer income reported in tax data, where joint married filer incomes are split equally. Income centiles defined based on income after taxes and transfers in year t–1.
Source: Authors' calculations using IRS data.
Relative to 2009, market income declines were more prevalent in 2020 at the bottom of the income distribution. Among the bottom quintile, 44 percent of working-age adults experienced a large income decline in 2020. Hence, large declines for low-income adults were 17 percent (7 percentage points) more common than in 2009 during the Great Recession. Conversely, among the top quintile of the distribution, large market income declines were 11 percent (4 percentage points) less common during the COVID-19 recession than during the Great Recession. This is consistent with observations from survey data that job losses during the pandemic were most prevalent in low-wage occupations and among workers with less education (Adams-Prassl et al. 2020, Cortes and Forsythe 2020).
Looking at the overall distribution of real income changes, as compared to only large declines, similarly highlights the dis-equalizing effects of the pandemic. Most working-age adults in the bottom quintile of the distribution had market income declines, with a median annual income change in 2020 of –2.7 percent. For those in the middle and top quintiles, the median changes were 1.5 and 0.8 percent.
Previous research using tax data similarly observed that individual-level labor earnings declines were unusually concentrated among the bottom of the earnings distribution in 2020 (Larrimore, Mortenson, and Splinter 2022). This paper extends that analysis. The disproportionate declines in the bottom of the distribution found previously are also true when broadening the income measure from just labor earnings to all market income—including self-employment and business income—and when aggregating spouses' incomes. The share with large declines, however, is flatter over most of the distribution when considering equal-split tax-unit market income changes rather than individual earnings.
B. Effects of Public Policy Responses
Many working-age adults who experienced large market income declines received public financial support that offset these losses. This support came from progressive taxes and stimulus checks. The largest and most targeted of these support programs was unemployment insurance (UI), which was enhanced in response to the COVID-19 pandemic. IRS data show that total UI benefits in 2020 were about $550 billion, which was over three times the amount of annual UI benefits distributed at the depth of the Great Recession.4
Public policies markedly reduced the overall frequency of large income declines during the pandemic. When considering income after taxes and transfers, which incorporates the effects of public policies, only 17 percent of working-age adults experienced a large income decline in 2020. This is 16 percentage points below the share who experienced a large decline in market income. During the Great Recession, policy changes were far less effective, as the 28 percent of working-age adults experiencing large declines in income after taxes and transfers was just 5 percentage points below the share who experienced large market income declines.
The regressive nature of the pandemic on market incomes was also offset by public policies. Figure 2 replicates the analysis from Figure 1, but to capture the effects of public policies, it changes from market income to income after taxes and transfers. While large market income declines were more common at the bottom of the distribution in 2020 than in either 2009 or 2019, large income declines after taxes and transfers were less common through nearly all the distribution in 2020. Only those in the top 10 percent were more likely to have large income declines after taxes and transfers than in 2019. Hence, for those in the bottom 90 percent of the distribution, large income declines after taxes and transfers during the COVID-19 recession were less frequent than during the expansion year of 2019.
Figure 2. Share of working-age adults in tax units with at least a 10 percent decline in Real income after taxes and transfers (by prior-year income)
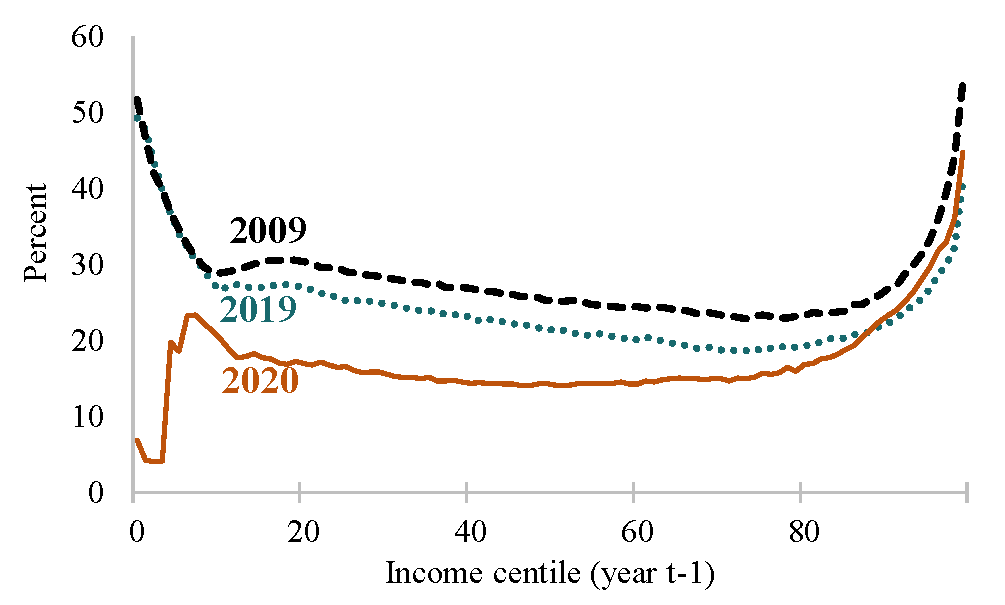
Notes: Among adults aged 25 to 59. Income after taxes and transfers is market income plus UI, stimulus checks, other reported transfers, and refundable credits and less net individual income taxes, where joint married filer incomes are split equally. Income centiles defined based on income after taxes and transfers in year t–1.
Source: Authors' calculations using IRS data.
The increase in redistribution from the tax and transfer system can also be seen in median income changes by quintile. Public policies meaningfully increased income growth across the distribution. After accounting for public policies, median income growth in 2020 exceeded that in 2019 throughout the distribution and did so by more for low-income adults (Table 1). For the bottom quintile, the median change in market income was –2.7 percent in 2020, while the median change after taxes and transfers was positive 90.2 percent. This is also consistent with the observation by Greig, Deadman, and Sonthalia (2021) that because of the public policy responses, the percent increase in checking account balances in 2020 was the largest for low-income families. Since these are temporary policies, however, these large after tax and transfer income increases should dissipate.
Table 1. Real Median Income Change Among Working-Age Adults, by Quintile
| Quintile | Market Income | After Tax and Transfers | ||||
|---|---|---|---|---|---|---|
| 2009 | 2019 | 2020 | 2009 | 2019 | 2020 | |
| Bottom | 2.4 | 10.1 | -2.7 | 6.3 | 3.3 | 90.2 |
| Second | -0.3 | 4.1 | 0.4 | 2.6 | 3.3 | 19.1 |
| Middle | 0 | 2.6 | 1.5 | 1.1 | 2.2 | 11.5 |
| Fourth | 0.2 | 1.8 | 1.6 | 0.9 | 1.6 | 7.3 |
| Top | -1.5 | 0.9 | 0.8 | -0.8 | 0.8 | 2.5 |
Notes: Among adults aged 25 to 59. Quintiles defined based on income after taxes and transfers in the prior year
Source: Authors’ calculations using IRS data.
Which public policies targeting individuals most contributed to the substantial stabilization of incomes for the bottom of the distribution in 2020? We explore this by adding single components to the income definition and observing the incremental stabilization effects. We do so for three aspects of income after taxes and transfers: (1) tax and transfer provisions except unemployment insurance and stimulus checks, (2) unemployment insurance benefits, and (3) stimulus checks.
Table 2 shows that public policies reduced the share of working-age adults with large income declines by 16 percentage points, from 33 percent for market income to 17 percent for income after taxes and transfers. Tax and transfer programs other than UI and stimulus checks explain little of this decrease (5 percent). Unemployment insurance benefits explain over half (58 percent) and stimulus checks explain the remaining 37 percent of the stabilization effect.
Table 2. Share of Working-age Adults in Tax Units with at least a 10 Percent Real Income Decline in 2020
| All working-age adults | Among the bottom quintile | Among the top quintile | |
|---|---|---|---|
| Market income | 33.4 | 44 | 29.1 |
| Taxes and transfers except UI and stimulus | 32.6 | 42.8 | 28.5 |
| Unemployment Ins. (UI) | 23.2 | 30 | 26.3 |
| Stimulus checks (after taxes and transfers) | 17.2 | 16.4 | 24.6 |
Notes: Among adults aged 25 to 59. Considering stimulus checks before unemployment insurance has a negligible effect
Source: Authors’ calculations using IRS data.
Among the bottom quintile, the share with large declines fell much more—by 28 percentage points (from 44 to 16 percent). Unemployment insurance benefits and stimulus checks each explain about half of the bottom-quintile decrease in large income declines.5
III. Summary
The COVID-19 recession caused regressive annual market income changes among working-age adults. Progressive taxes and transfers, especially from expanded unemployment insurance benefits and stimulus checks, dramatically offset these declines. Public policies made large declines in incomes less common than during either the Great Recession or 2019, an expansionary year. This effect was strongest among those with low incomes, but public policy stabilized incomes over the entire distribution.
Disclaimer and Acknowledgements
Larrimore is with the Board of Governors of the Federal Reserve System, although the views expressed in this article are the authors' alone and do not indicate concurrence by other members of the Federal Reserve System staff or the Board of Governors. Mortenson and Splinter are with the Joint Committee on Taxation and this paper embodies work undertaken for the Committee, but as members of both parties and both houses of Congress comprise the Joint Committee on Taxation, this work should not be construed to represent the position of any member of the Committee.
References
Adams-Prassl, Abi, Teodora Boneva, Marta Golin, and Christopher Rauh. 2020. "Inequality in the Impact of the Coronavirus Shock: Evidence from Real Time Surveys." Journal of Public Economics 189, Article 104245.
Cortes, Guido Matias, and Eliza C. Forsythe. 2020. "The Heterogeneous Labor Market Impacts of the COVID-19 Pandemic." Upjohn Institute Working Paper 20-327.
Greig, Fiona, Erica Deadman, and Tanya Sonthalia. 2021. "Household Cash Balance Pulse: Family Edition." JPMorgan Chase Institute. https://www.jpmorganchase.com/institute/research/household-cash-balance-pulse-families
Larrimore, Jeff, Jacob Mortenson, and David Splinter. 2021. "Household Incomes in Tax Data: Using Addresses to Move from Tax-Unit to Household Income Distributions." Journal of Human Resources 56 (2): 600–31.
Larrimore, Jeff, Jacob Mortenson, and David Splinter. 2022. "Earnings Shocks and Stabilization During COVID-19." Journal of Public Economics 206: 104597.
Splinter, David. Forthcoming. "Income Mobility and Inequality: Adult-Level Measures from the U.S. Tax Data since 1979." Review of Income and Wealth. https://doi.org/10.1111/roiw.12501
Piketty, Thomas, Emmanuel Saez, and Gabriel Zucman. 2018. "Distributional National Accounts: Methods and Estimates for the United States." Quarterly Journal of Economics 133 (2): 553–609.
* Larrimore is with the Board of Governors of the Federal Reserve System, although the views expressed in this article are the authors' alone and do not indicate concurrence by other members of the Federal Reserve System staff or the Board of Governors. Mortenson and Splinter are with the Joint Committee on Taxation and this paper embodies work undertaken for the Committee, but as members of both parties and both houses of Congress comprise the Joint Committee on Taxation, this work should not be construed to represent the position of any member of the Committee. Return to text
1. We use the term income after taxes and transfers for convenience but recognize that due to data limitations our measure only includes transfers and federal income taxes that appear on IRS tax forms. Return to text
2. Size-adjusting using an equal split is used by Piketty, Saez, and Zucman (2018) and Splinter (forthcoming). Relative to other common approaches, such as dividing by the square-root of household size, the equal-split approach is less susceptible to substantial income changes purely due to shifts in marital status when spouses have similar individual-level earnings. Non-filers are treated as living in single-person tax units. Declines in individual-level earnings during the COVID-19 pandemic are studied in Larrimore, Mortenson, and Splinter (2022). Return to text
3. We focus on 2009 as the Great Recession year with the most pronounced income declines and 2019 as the most recent non-recession year prior to COVID-19. For income changes after taxes and transfers in 2009, we exclude the 2008 stimulus checks and the 2009 Making Work Pay tax credits. Since the 2008 stimulus checks were larger than the credit, doing so prevents people from appearing as having larger declines from the expiration of stimulus checks. Return to text
4. This increase reflects both the increase in the size of payments and expanded UI eligibility. The Pandemic Unemployment Assistance (PUA) program introduced unemployment benefits for self-employed workers (e.g., gig workers) with no traditional wage earnings. Among working-age adults, 19 percent of UI recipients in 2020, who received 23 percent of total UI payments, had no 2020 W-2 wage earnings. Return to text
5. Larrimore, Mortenson, and Splinter (2022) estimate that 42 percent of workers with a large annual wage earnings decline in 2020 received UI benefits, and these recipients had a median replacement rate of 105 percent. During the Great Recession, replacement rates peaked in 2010 at only 64 percent. Return to text
Larrimore, Jeff, Jacob Mortenson, and David Splinter (2022). "Income Declines During COVID-19," FEDS Notes. Washington: Board of Governors of the Federal Reserve System, July 7, 2022, https://doi.org/10.17016/2380-7172.3063.
Disclaimer: FEDS Notes are articles in which Board staff offer their own views and present analysis on a range of topics in economics and finance. These articles are shorter and less technically oriented than FEDS Working Papers and IFDP papers.