FEDS Notes
April 08, 2026
India and the Global Economy
Omar Farrag and Patrice Robitaille
1. Introduction
With a population of 1.4 billion, India is the world's most populous country. It is also now the world's fastest growing economy and is currently the 5th largest economy measured at current exchange rates, poised to overtake Japan and Germany in coming years (Figure 1).2 Yet its share in the world economy is nowhere near its 20 percent share of the world's population. Even though India has surpassed China in population, its share of global GDP is only 3 percent, compared to 17 percent for China, and India's share in global merchandise trade is even less (Figure 2). India's government aims to reach high-income status by 2047, the 100th anniversary of its independence.3
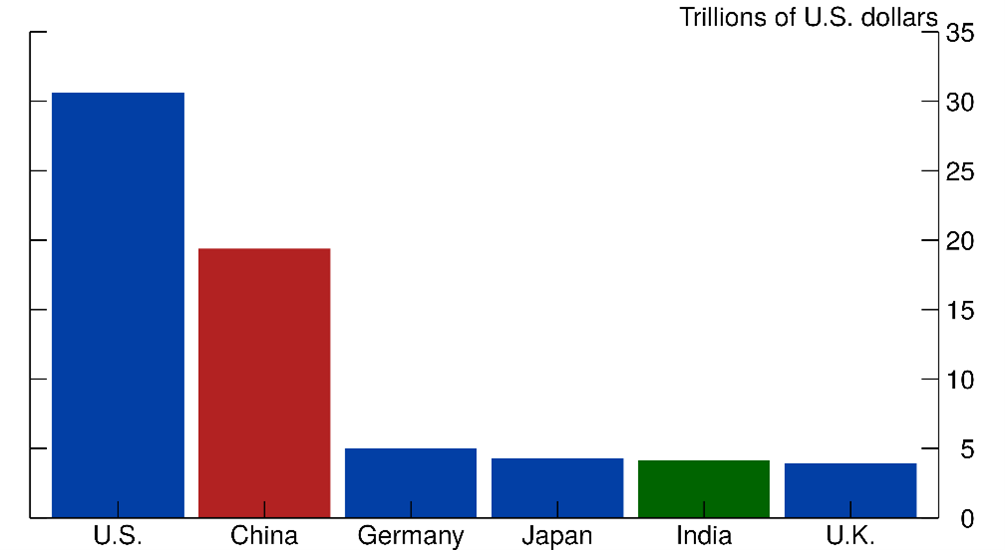
Notes: Throughout this note, GDP for India is based on the fiscal year through March, so 2025 for India refers to the fiscal year through March 2026.
Source: IMF October 2025 World Economic Outlook (WEO), via Haver Analytics.
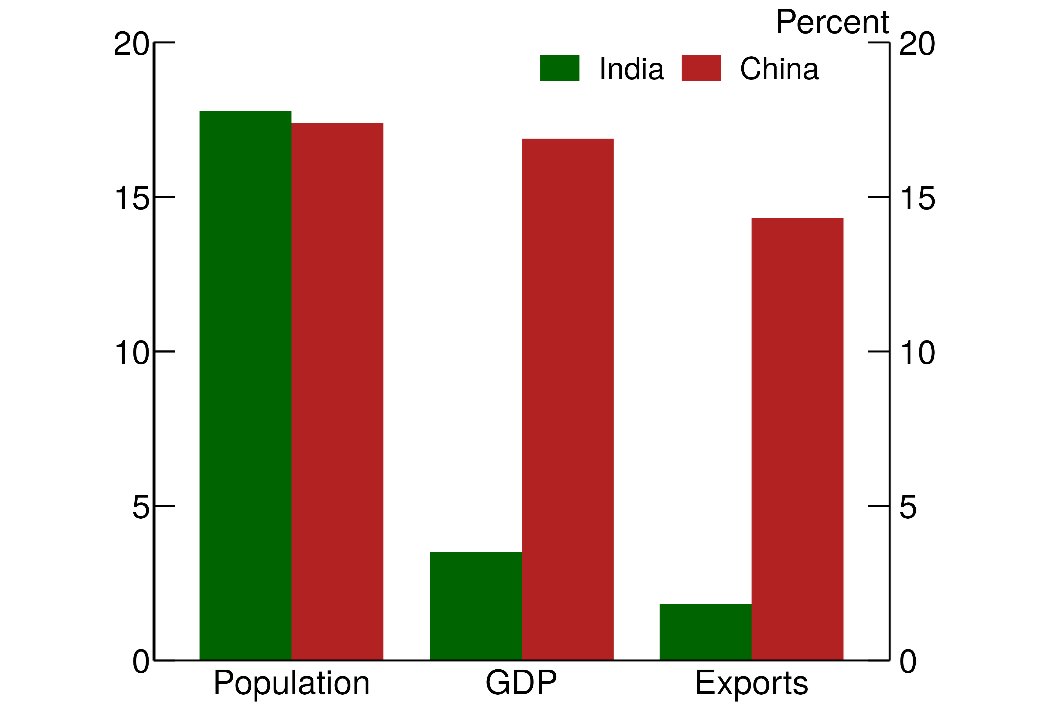
Note: Exports of goods. GDP converted to U.S. dollars at market exchange rates. The key identifies bars in order from left to right.
Source: World Development Indicators (WDI) and IMF Direction of Trade, via Haver Analytics.
India's economic trajectory has differed markedly from that of earlier high-growth Asian economies. While China, Japan, and Korea grew rapidly by pursuing a manufacturing export-led growth strategy, India's growth has been driven disproportionately by services. As a result, India's integration into global manufacturing supply chains has been limited, even as the country has become a major exporter of information technology, business services, and other professional services.
In this note, I review the factors that could promote a larger role for India in the global economy and highlight challenges the country faces in realizing that potential. I first discuss India's growth experience and the policy choices that have shaped India's development path and document the country's relatively limited integration into global manufacturing alongside its rapid expansion in tradable services. I then tackle two key questions about India's economic outlook that these patterns raise: First, can India become more competitive in global manufacturing and follow, at least in part, the export-led development model that powered growth in other Asian economies? Second, in an era of rapid technological change—particularly the rise of generative artificial intelligence (AI)—can export-oriented services continue to serve as a major engine of India's economic growth?
2. India's Growth Experience
Catch-up growth and favorable demographics
India has become, by some distance, the world's fastest growing major economy. As shown by the green bars in Figure 3, excluding the pandemic period, real GDP growth has averaged roughly 6-1/2 to 7-1/2 percent since the early 1990s, well above most other emerging market economies.4 By contrast, China's growth has slowed markedly over the past 15 years to now be well below India's.
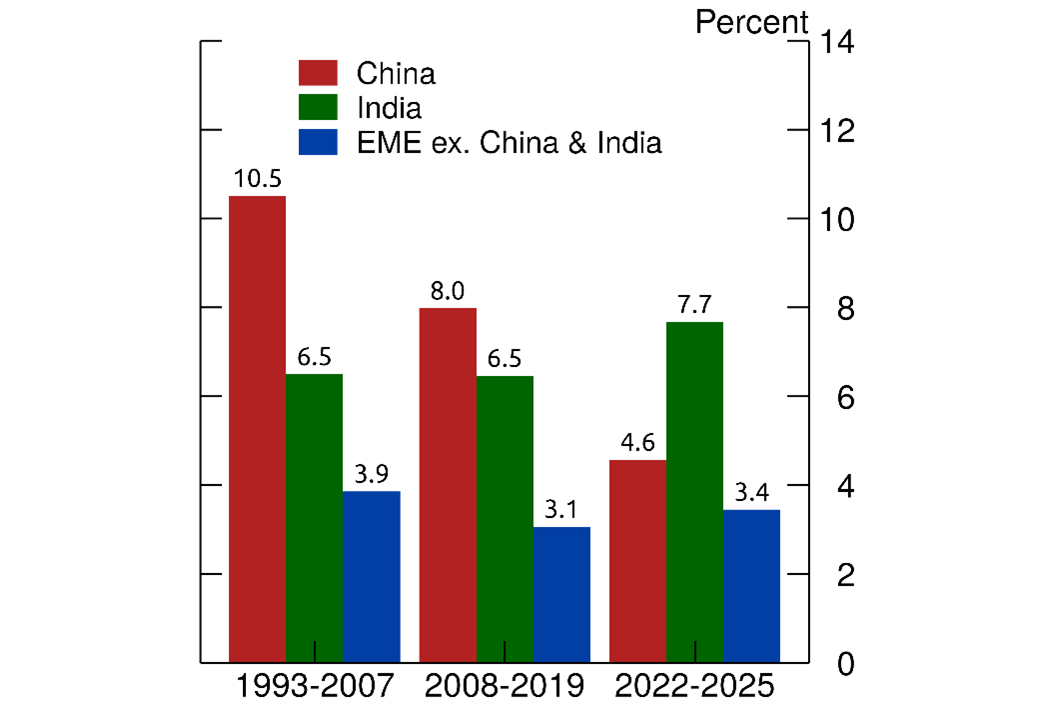
Notes: Except for India's real GDP growth for 2025, data are from the October 2025 WEO. India's real GDP growth for 2025 is for fiscal year through March 2026 and is from the first advance release estimate (2026). EME excluding China and India is aggregate real GDP growth for 14 major EMEs, weighted by their average shares of nominal GDP in U.S. dollars over the period. The EMEs are Argentina, Brazil, Chile, Colombia, Indonesia, Malaysia, Mexico, Peru,Philippines, Poland, South Africa, Thailand, Turkey, and Vietnam. The key identifies bars in order from left to right.
Source: WEO, via Haver Analytics.
It is likely that India will continue to grow relatively rapidly. India's relatively low income level suggests considerable scope for catch-up growth, reflecting the idea of economic convergence whereby less-developed countries grow faster. GDP per capita in India is approximately $2,800, about one-fifth of China's level and roughly 4 percent of U.S. per-capita income (Figure 4). Moreover, India faces relatively favorable demographics. According to United Nations projections, India's working-age population is expected to rise for several more decades, whereas China's is projected to decline rapidly (Figure 5). In 50 years, India's working-age population is projected to be more than twice as large as China's.
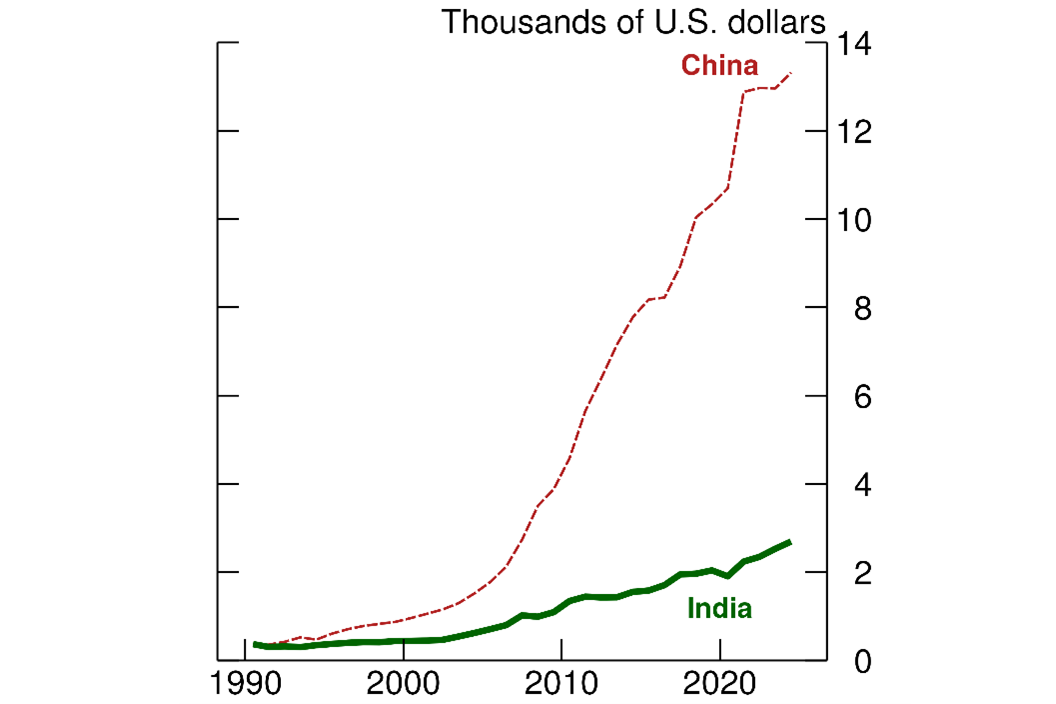
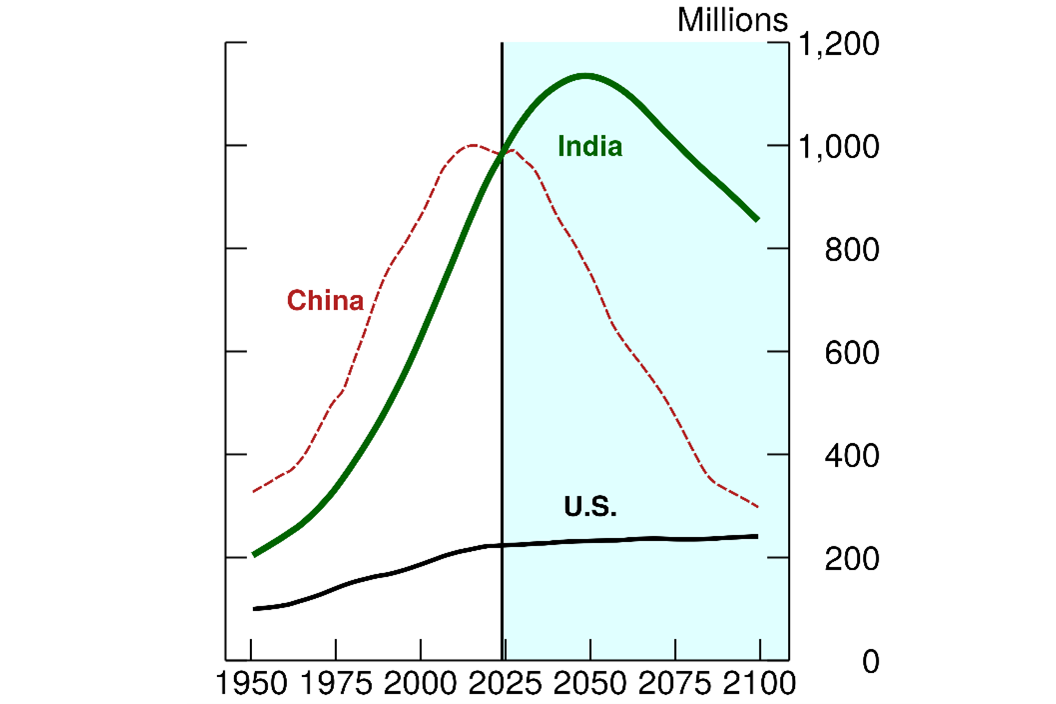
Note: population ages 15 to 64.
Source: United Nations Population Projections, medium fertility assumption, July 2024, via Haver Analytics. Forecast begins in 2024.
India's relatively young population also means that India will not be facing, at least for some time, the social and fiscal pressures associated with population aging other countries have been confronting. However, India's low female labor force participation rate has limited the extent to which the country could fully benefit from its demographic advantages. Increasing women's participation in the workforce would likely boost economic growth and improve overall welfare.5
Structural Transformation and Manufacturing
Like many rapidly developing countries, India's workforce has gradually shifted out of the low-productivity agricultural sector (green line in Figure 6). But this process has been slower than in other economies with comparable levels of development and had stalled following the pandemic. Moreover, relatively few of India's large mass of unskilled workers have been absorbed by the manufacturing sector (red line in Figure 6).6
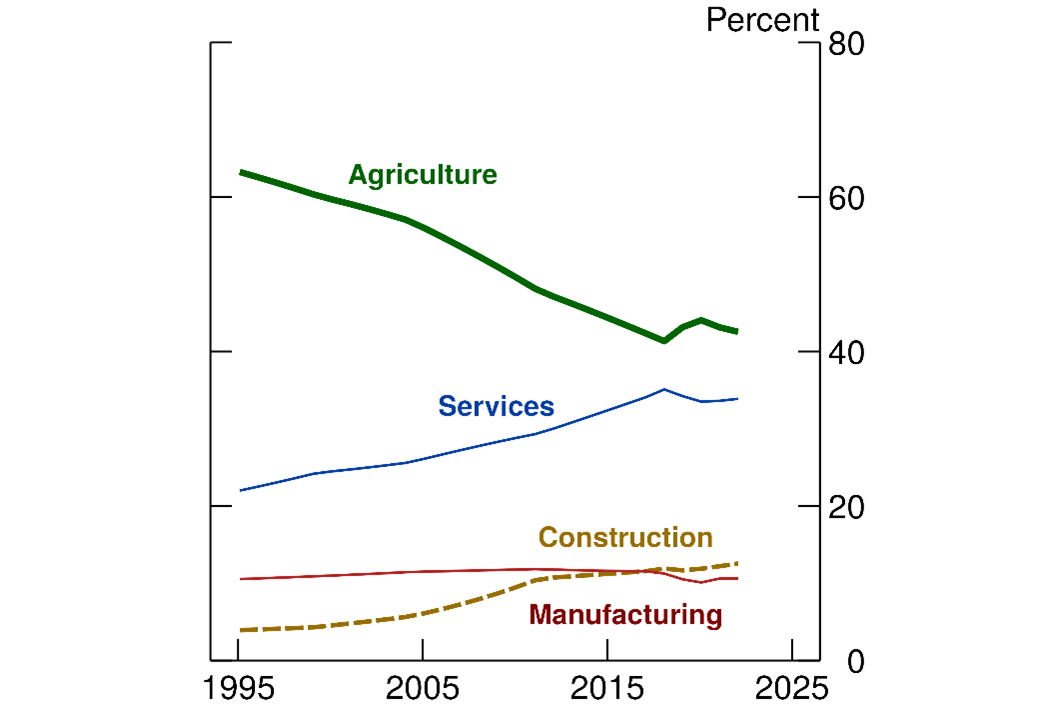
Notes: Data extend to 2022.
Source: Reserve Bank of India's KLEMS database, accessed via Haver Analytics.
The reallocation of workers from agriculture to export-oriented manufacturing firms has been an important driver of productivity growth in countries such as China and other Asian economies that experienced so-called 'growth miracles.' As seen in Figure 7, towards the end of their growth miracle phase, manufacturing accounted for a quarter to a third of GDP in China, Japan, Korea, and Taiwan—well over India's share.
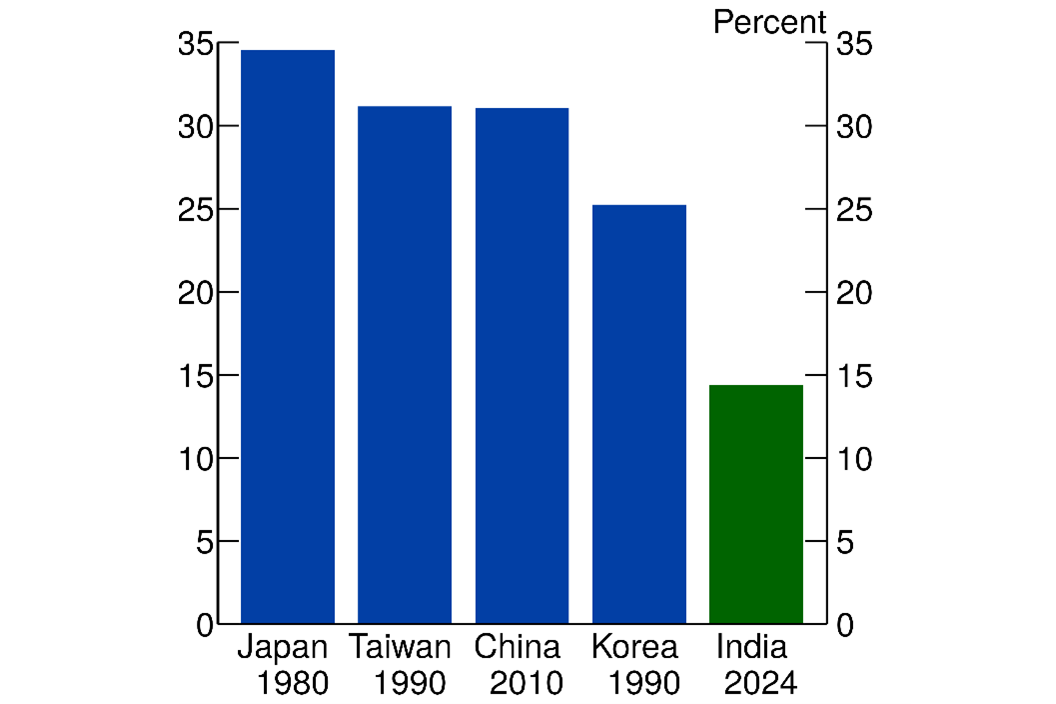
Notes: Manufacturing's share of GDP in current prices. For India, Japan, and Taiwan, manufacturing's share of gross value added at current prices.
Source: National statistical agencies and WDI via Haver Analytics.
By contrast, as seen by the blue portions of the bars in Figure 8, India's growth has been driven largely by services, including its booming business providing financial, professional, and IT services to global companies. Manufacturing (the red portions) has been a minor contribution to growth. India's limited degree of integration in global manufacturing but rapid growth in services raise the two questions I highlighted earlier, which the remainder of this note focuses on.
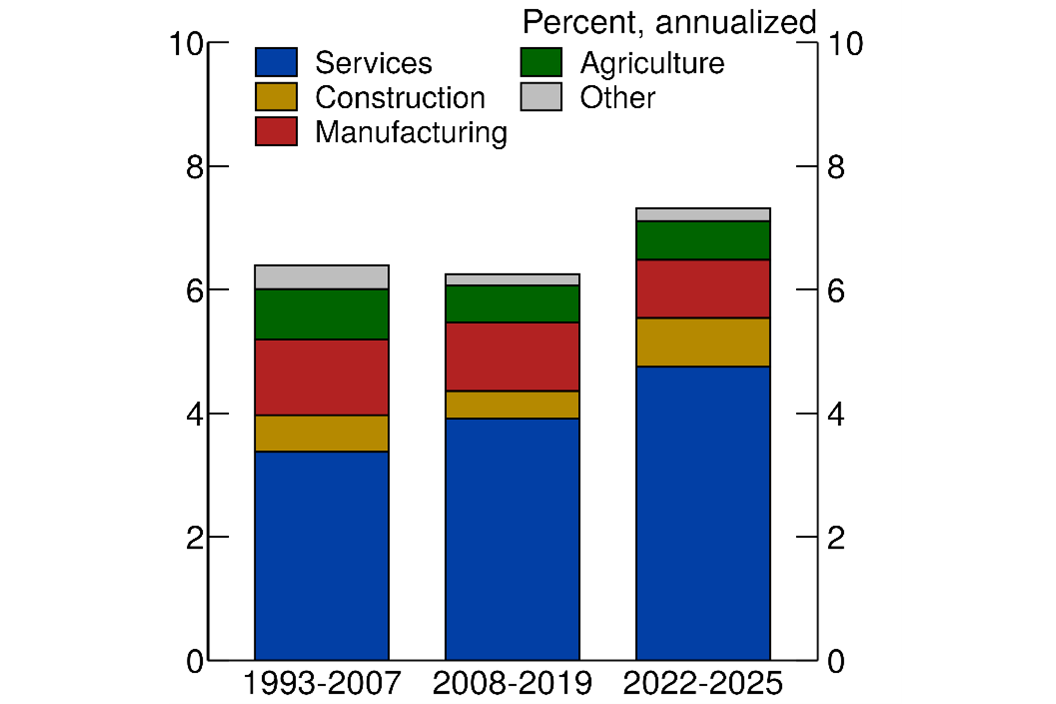
Note: 2025 data is from the first advance release estimate (Government of India 2026). 'Other' is mining/quarrying and utility services. The key identifies bars in order from bottom to top.
Source: Central Statistics Office, via Haver Analytics.
3. Can India become competitive in global manufacturing?
A long-standing obstacle to manufacturing exports-led growth is India's high trade barriers, which has hurt its ability to benefit from globalization. To be sure, India undertook economic reforms in the 1990s, ending decades of economic isolation, cutting tariffs and non-tariff trade barriers and lowering restrictions to foreign direct investment. India's average tariff rate, which stood at 125 percent on the eve of its balance of payments crisis in 1991, was slashed to 40 percent in the mid-1990s (Srinivasan, 2001; Singh, 2017). As seen by the black line in Figure 9, India's average tariff rate subsequently declined to 13 percent in 2010. But the average tariff rate subsequently moved up somewhat and remains among the highest in emerging market economies. India's tariffs on agricultural products (the gold line) are particularly high, as India has sought to protect agricultural workers and promote food self-sufficiency.
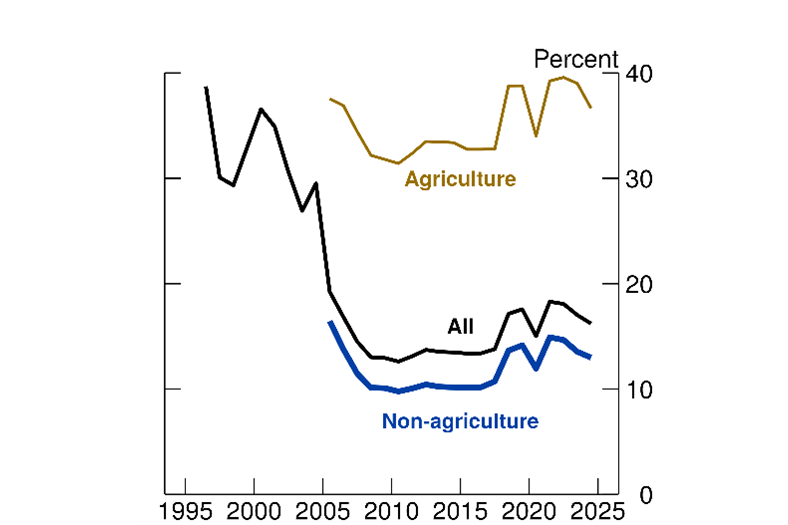
Notes: Most favored nation simple average tariff rate. Data through 2024. Sectoral breakdown into agriculture and industry ('non-agriculture') begins in 2005. Missing data in 2006 and 2011 are interpolated.
Source: WDI and World Trade Organization via Haver Analytics.
India also opted out of the world's largest free trade agreement, the Regional Comprehensive Economic Partnership, in 2019, largely to protect its agriculture and industry from competition from China (Schott, 2020). But this step further undermined its ability to gain a foothold in the global supply chain. India was not a major beneficiary of shift in global supply chains following U.S. imposition of tariffs on China in 2017-18 based on data through 2022 (Hoang and Lewis 2024; Freund et al. 2025;).
More recently, though, as seen in Figure 10, India appears to be fast displacing China as a supplier of smartphones to the U.S. As has been the case in countries that have seen an increased share of U.S. imports, India's imports from China have also risen. But a deliberate policy choice by India—its moves to reduce tariffs on smartphone components—may have also made it more attractive to produce smartphones in India.7 India has also been attempting to promote exports in other areas of electronics, semiconductors, and other sectors with the help of fiscal subsidies (IMF 2025b).
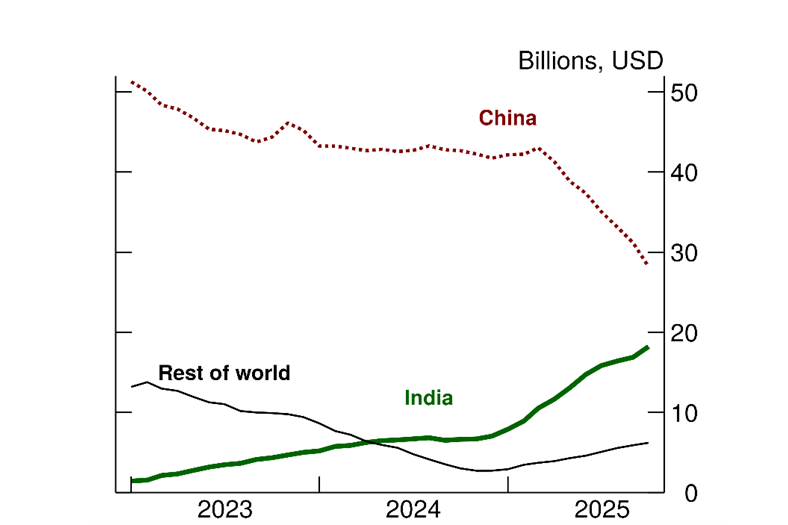
Notes: HS code 851713. Data are 12-mo. moving sums through October 2025.
Source: UN Comtrade.
To achieve broader success, India needs to improve the cost of doing business. India is a difficult place to do business, with a complex and unpredictable regulatory environment, restrictive labor laws, and underdeveloped infrastructure. Consequently, as seen in Figure 11, net inward FDI, since its peak before the global financial crisis, has declined and has been very low. India's struggle to attract foreign investment in manufacturing has limited an important channel for technology transfer.8 It has also made it difficult for India to benefit from its potentially large internal market.
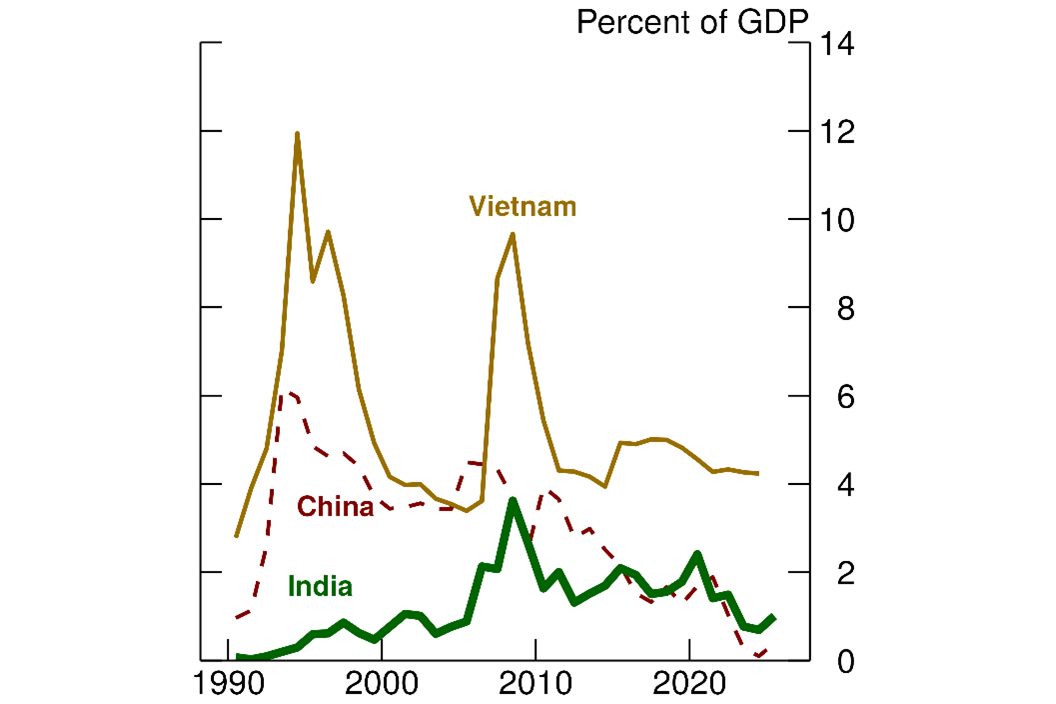
Notes: Inward FDI is gross FDI minus repatriation of dividends and capital. Data are annual and extend through 2024 for Vietnam and 2025 for China and India.
Source: National statistical agencies and WDI via Haver Analytics.
The Modi government, which has been in office since 2014, has taken some steps to address these issues. India introduced an inflation targeting framework in 2016 that has succeeded at bringing inflation down. The 2017 General Services Tax (GST) reform greatly simplified India's tax system and reduced trade costs.9 Under the leadership of the Reserve Bank of India (the country's central bank), banks, which were saddled with bad loans in the 2010s, were also cleaned up. India has been investing heavily in its digital public infrastructure, which has transformed payments and improved access to the financial system. And India has been making major investments in railways, roads, and other physical infrastructure. Moreover, some state and local governments, particularly in India's more prosperous south, have strived to provide a more welcoming business environment, a strategy that appears to be bearing fruit.
4. Can export-oriented services continue to fuel India's overall growth?
India's challenging business environment impinges particularly heavily on its manufacturing sector. By contrast, India has excelled as a provider of global services. Service exports exceeded 10 percent of GDP last year and accounted for almost half of India's total exports (Figure 12). India has been particularly successful not only as the 'back office of the world,' but also in other areas, including semiconductor chip design. But trade in services has not fueled India's development the way manufacturing has done for other countries.
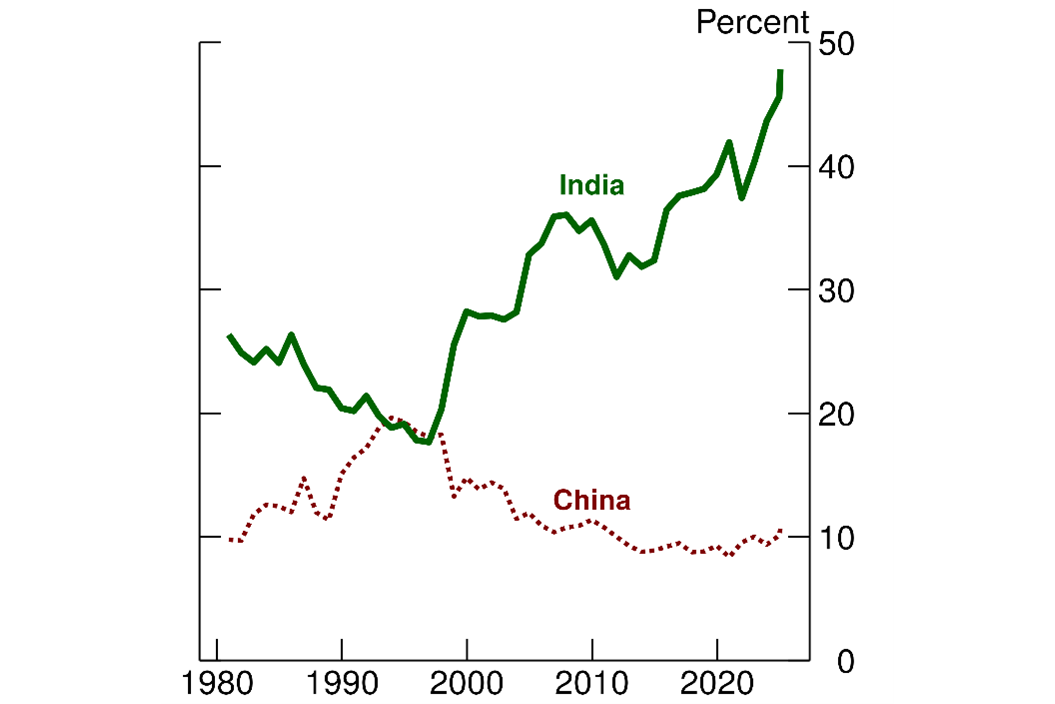
Furthermore, the rise of Generative AI could disrupt India's service outsourcing model. Since early 2025, equity returns of India's 6 largest outsourcing firms, the blue line in Figure 13, have underperformed India's benchmark stock market index, the red line, in part reflecting investor concerns about whether India's global service providers will adapt.10 On the other hand, AI could also increase demand for India's huge pool of STEM workers. India is second only to China in producing STEM graduates (Figure 14).11 And, as in China, this pool of talent can also serve as a domestic engine of growth.
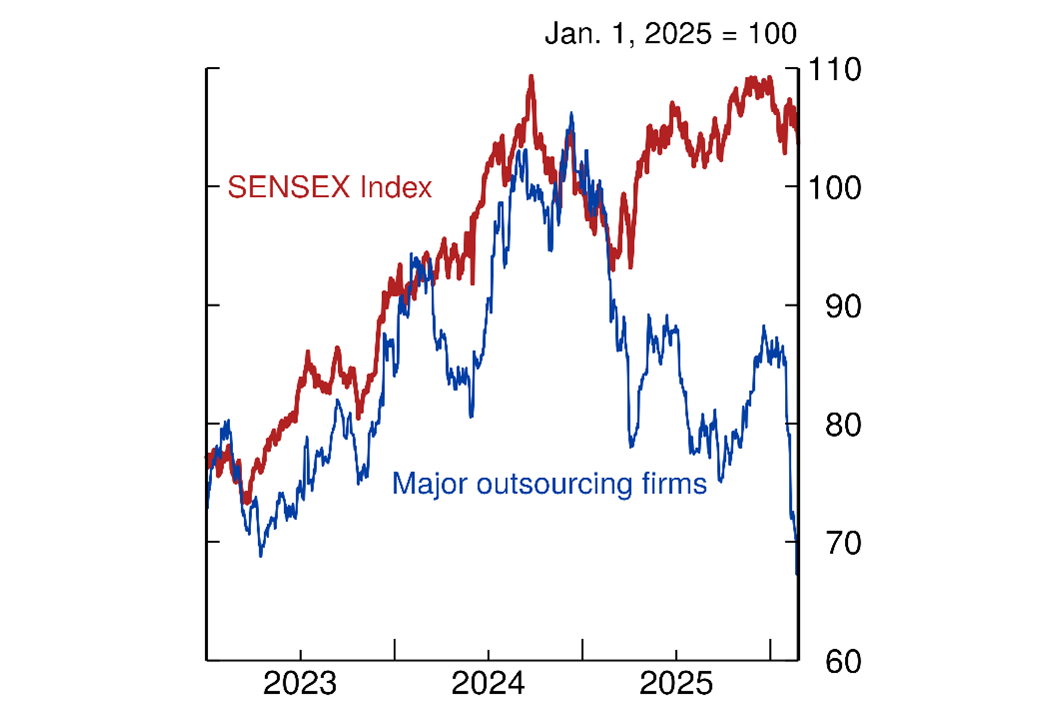
Notes: Data are daily. 'Major outsourcing firms' is a composite index of the 6 largest outsourcing firms operating in India: Cognizant, HCLTech, Infosys, Tata Consultancy Services, Tech Mahindra, and Wipro. Underlying stock prices are in rupees, with Cognizant converted from US dollars into rupees.
Source: Bloomberg Finance, LP. Data run through February 27, 2026.
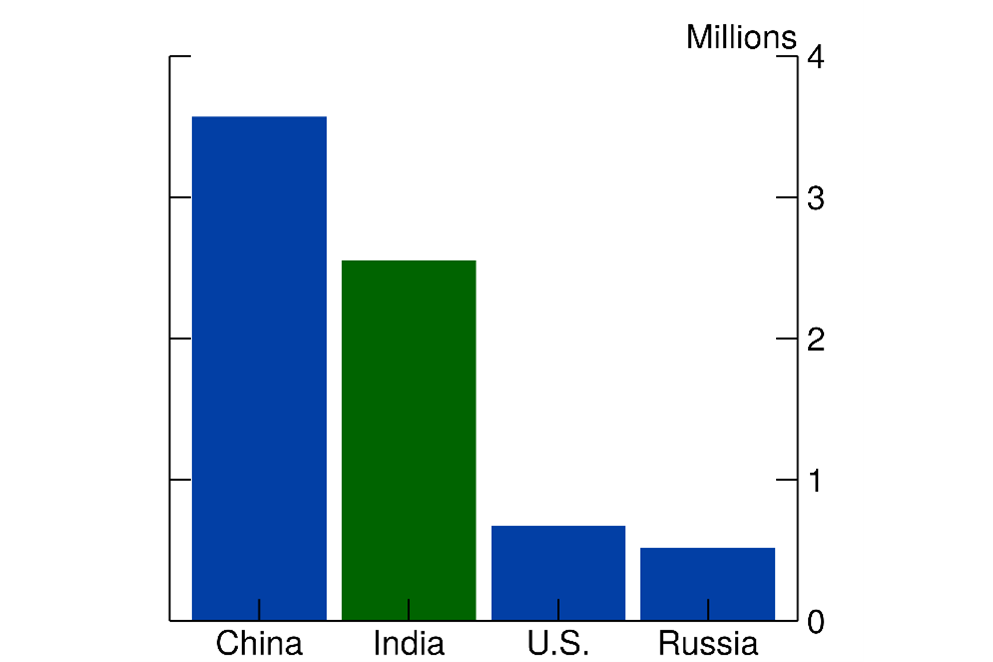
Note: Bachelor's degree or equivalent and above. Data are for 2020 and for China, India, and Russia are taken from Oliss et al (2023), who cite as data sources the statistical yearbooks of these countries. For the United States, we drew on the 2020 U.S. data from the OECD (OECD 2025), counting as STEM fields categories F05 (Natural sciences, mathematics and statistics), F06 Information and Communication Technologies (ICTs), and F07 (Engineering, manufacturing and construction).
Source: Oliss et al. (2023), which used the statistical yearbooks of China, India, and Russia. For the U.S., we updated the authors' estimate using OECD's estimates for US STEM graduates in 2020, counting as STEM graduates those in the Natural sciences/mathematics/statistics, ICTs, and Engineering/manufacturing/construction fields.
More generally, unlike manufacturing firms, India's globally competitive service providers require high-skill workers. It seems unlikely, therefore, that a tradable services-driven growth model can absorb India's largely unskilled workforce in the way that manufacturing-led growth has done for other countries.
5. Conclusion
India aspires to become a high-income country by 2047. To reach that goal, India's growth would need to step up markedly from its already-high pace. This will be a challenge. Not only are the domestic hurdles high but the external environment has shifted, and it will be harder for other countries to follow in the footsteps of China, especially one as large as India. Even if only partially successful, however, what is likely is that India, given its size, will consolidate its place among the very largest economies. As China's growth did before it, India's growth could therefore have significant implications for the rest of the world, both economic and geopolitical.
India could become a bigger consumer of commodities. India may also take more of the export markets that China has vacated. And, not least, India's growth could open a potentially large, new consumer market. Geopolitically, India, as the world's largest democracy, has often been seen as a counterweight to China. But India's government has also emphasized that it prefers to preserve policy independence ('strategic autonomy'). India's rise therefore could lead to an increasingly multipolar world, creating both opportunities and instability as the country balances strategic autonomy with global engagement.
References
Acharya, S. (2025) 'India axes import tax on some smartphone parts in boost to Apple, Xiaomi,' Reuters, 1 February.
Bloomberg Finance, LP. Bloomberg Terminals (Open, Anywhere, and Disaster Recovery Licenses), January 4, 2023 to February 27, 2026.
The Economist (2024). 'The mystery of India's female labour-force participation rate.' 21 November.
Freund, C., Mattoo, A., Mulabdic, A., and Ruta, M. (2024). Is US trade policy reshaping global supply chains? Journal of International Economics, 152, 104011.
Government of India, Ministry of Education (2020, 2021). All India Survey on Higher Education 2019-20, 2020-21).
Government of India, Ministry of Statistics and Programme Implementation (2026). First Advance Estimates of Gross Domestic Product, 2025-26. Press Note 7 January.
Hoang, T., and Lewis, G. (2024), 'As the U.S. is Derisking from China, Other Foreign U.S. Suppliers Are Relying More on Chinese Imports,' FEDS note, 2 August.
International Monetary Fund (2023). 2023 Article IV Consultation, India. IMF Country Report No. 23/426, December.
--- (2025a). 2024 Article IV Consultation, India. IMF Country Report No. 25/54, February.
--- (2025b). 2024 Article IV Consultation, India. IMF Country Report No. 25/314, November.
Kumar, M. (2022). 'Modi says India aims to become developed nation in 25 years.' Reuters, 15 August.
Oliss, B., McFaul, C., and J. C. Riddick (2023). 'The Global Distribution of Stem Graduates: Which Countries Lead the Way?', Center for Security and Emerging Technology, 27 November.
OECD (2025), "Number of enrolled students, graduates and new entrants by field of education," OECD Education Statistics (database), https://data-explorer.oecd.org/ (Accessed March 10, 2026).
Rajan, R. and Lamba, R. (2023). Breaking the Mould: Reimagining India's Economic Future. Penguin Random House India Private Limited.
Schott, J. J. (2020). 'Has India's Trade Negotiating Strategy Hit a Dead End?' In A Wary Partnership: Future of US-India Economic Relations. PIIE Briefing, 20(2), 70-84.
Shah, A., and D. Pandya (2026). 'India gives 20-year tax holiday to foreign firms using local data centres,' Reuters. 1 February.
Singh, H. V. (2017). Trade policy reform in India since 1991. Brookings India Working Paper 02, March.
Srinivasan, T. N. (2001). India's reform of external sector policies and future multilateral trade negotiations. Yale University Economic Growth Center Discussion Paper. No. 830.
Srivastava, S. Phartiyal, S., and Bhatia, R. (2025). ' India Plans Near $3 Billion Aid, Tariff Cuts for Electronics,' Bloomberg, 6 January.
Van Leemput, E. (2021). A passage to India: Quantifying internal and external barriers to trade. Journal of International Economics, 131, 103473.
Van Leemput, E. and E. A. Wiencek (2017). 'The Effect of the GST on Indian Growth,' IFDP Notes. Washington: Board of Governors of the Federal Reserve System, 24 March.
World Bank (2025). India - Country Economic Memorandum: Becoming a High-Income Economy in a Generation.
World Bank, World Development Indicators.
1. Patrice Robitaille is with the Board of Governors of the Federal Reserve System. The views expressed in this note are my own, and do not represent the views of the Board of Governors of the Federal Reserve, nor any other person associated with the Federal Reserve System. I thank several colleagues, especially Shaghil Ahmed, Florencia Airaudo, Michele Dathan, Jasper Hoek, and Eva Van Leemput, for very helpful comments, and Claudia Carr and Michele Dathan for help with the stock price data. Return to text
2. Throughout this note, I measure GDP at market exchange rates rather than a Purchasing Power Parity exchange rates because I focus on India's role in the global economy. Return to text
3. This goal was first articulated in 2022 (Kumar 2022). Keep in mind that raising India's to high income country status by 2047 would put India's GDP per capita at about the level of where Chile and Romania are today, indicating still much room for further catch-up growth. As of 2024, GDP per capita for Chile and Romania, both classified as high-income countries by the World Bank, stood at $16,700 and $20,000, respectively. World Bank methodology and data. Return to text
4. This note was in the final stages when India released its benchmark revision to its national accounts. Incorporating the changes would make no major difference to our narrative. The revision raises India's average real GDP average growth to 6.8 percent over 1993-2007 period and again to 6.8 percent over the 2008-2019 period. For the 2022-25 period, average growth is revised down to 7.3 percent, reflecting the 2-percentage point downward revision to growth in 2023—fiscal year 2023-2024—from 9.2 to 7.2 percent. Return to text
5. The Economist (2024), IMF (2023, 2025a). Unemployment rates for women also tend to be higher than for men, particularly for the more highly educated. According to the World Bank's WDI, the unemployment rates for both men and women with at least some tertiary education have been trending down since 2020, but in 2024 for women (20.9 percent) was well above that for men (11.0 percent). Return to text
6. The data in Figure 6 are from the Reserve Bank of India's KLEMS database, which goes through 2022. This is the most recent year for which employment data for the manufacturing sector is available. In more recent data, the agricultural sector still accounted for 43 percent of total employment in 2024 (World Bank Development Indicators, retrieved February 20, 2026). Return to text
7. India's imports from China grew about 10 and 14 percent in 2024 and 2025, respectively, well-exceeding growth in India's total imports. In February 2025, Indian authorities reduced tariffs on imported intermediate goods (Srivastava, Phartiyal, and Bhatia 2025). More broadly, according to the IMF (2025b), the average tariff rate on industrial products has declined to 10.7 percent from 13.5 percent in 2023. Return to text
8. India's government recently proposed a tax holiday until 2027 for foreign companies that use data centers built in India to provide global services. One factor reportedly holding back construction of data centers was the fear that the government would impose taxes on future income (Shah and Pandya 2026). Return to text
9. Van Leemput and Weincek (2017) employ the framework of Van Leemput (2021) to study the potential long-term effects on welfare and GDP of a fall in internal barriers to trade from the GST reform. They found non-trivial positive effects on welfare and GDP. The GST was simplified in the fall of 2025, but that tax reform also amounted to fiscal stimulus, as it was designed as a tax cut to cushion the effects of the U.S. government's 50 percent tariff. Though the simpler tax structure could broaden the tax base by reducing tax evasion (IMF 2025b). Return to text
10. Outsourcing firms in the rest of the world, not shown, have also seen price declines, especially since early February 2026. Return to text
11. The 2.6 million STEM graduates for India in Figure 14 from Oliss et al (2023) align with our estimates from the All-India Survey on Higher Education 2019-20 and 2020-21 (2.3 and 2.6 million; Government of India 2020, 2021). A caveat about these figures is that the quality of many of India's higher education institutions is widely seen as low (Rajan and Lamba 2023). Return to text
Farrag, Omar, and Patrice Robitaille (2026). "India and the Global Economy," FEDS Notes. Washington: Board of Governors of the Federal Reserve System, April 08, 2026, https://doi.org/10.17016/2380-7172.4033.
Disclaimer: FEDS Notes are articles in which Board staff offer their own views and present analysis on a range of topics in economics and finance. These articles are shorter and less technically oriented than FEDS Working Papers and IFDP papers.