


FEDS Notes
October 09, 2026
Informal Support Networks in the Survey of Consumer Finances
Aditya Aladangady, Jesse Bricker, Andrew C. Chang, Sarena Goodman, and Gina Li, with assistance from Jack Duncan1
Informal support networks, the interpersonal connections through which families provide or receive financial and practical assistance, constitute a critical but often invisible component of the U.S. economy. These networks can serve many of the same functions as wealth: shaping key economic decisions around saving, spending, and labor supply and providing an important buffer against adverse shocks (McGarry, 2016; Bergeot et al., 2025). However, the nature and scale of informal networks across the full distribution of U.S. families—including their interaction with traditional measures of economic well-being, such as income and wealth—remain largely unquantified in national statistics. This measurement gap limits our understanding of household decision-making and aggregate economic stability.
To narrow this gap, this note provides a first look at how families share two key resources—money and time—among their friends and relatives, primary sources of informal support for many families. The analysis is based on new questions that we, along with other members of the Federal Reserve staff, added to the 2025 Survey of Consumer Finances (SCF).2 The SCF is a detailed cross-sectional survey of U.S. families' finances that is the leading resource for measuring family balance sheets and conducting distributional wealth analysis. The new questions focus on resources with the most direct implications for families' material well-being, probing their provision and receipt of monetary and caregiving support through friends or relatives, as well as whether they would be relied upon by friends or relatives in the event of an emergency.3 These questions allow us to construct a fuller picture of the resources that families can draw upon to meet their budget needs; however, they capture only a portion of families' informal networks, as other sources or forms of assistance—such as assistance through community organizations or non-financial emergency help like moving in with a friend or a family member—are not directly observed in our data. We refer to the types of informal support networks we analyze as informal financial/caregiving (F/CG) networks.
Our analysis reveals that informal F/CG networks are far-reaching and that failing to account for them may present a misleading picture of U.S. families' underlying resources and capacity to absorb adverse shocks. Specifically, 85.4 percent of families are part of an informal F/CG network, with 44.2 percent of families actively providing or receiving monetary or time support, and 79.7 percent of families expecting they could either be relied on for or obtain monetary support in an emergency.4 The share of families actively receiving or providing money or time does not vary much with family wealth, though there is evidence of more reciprocity—with families both giving and receiving support—among lower-wealth families and of increasing net provision of support as wealth rises.
Nonetheless, because wealthier families are more likely to be relied on or able to rely on others for funds in an emergency, overall participation in an informal F/CG network rises with wealth. About 60 percent of low-wealth families maintain emergency financial connections with friends or relatives versus more than 90 percent of high-wealth families.5 This pattern suggests that inequality in families' resource constraints and their ability to weather financial hardship is larger than balance sheet measures alone indicate.
Finally, we identify a particularly high-risk population obscured in traditional balance sheet statistics: the 5.5 percent of families who both have low financial wealth and lack an informal F/CG network. This group is disproportionately comprised of traditionally disadvantaged populations—that is, low-income families, renters, families without a college degree, young families, and Black or Hispanic families— suggesting that reduced access to informal support networks may reinforce underlying economic fragility. Ultimately, our findings shed light on the possibility that informal support beyond conventional measures of economic well-being may alter characterizations of inequality and the financial risks that families face.
Analysis
To capture the multidimensional nature of informal support networks, we leverage questions in the 2025 SCF that measure time, monetary, and emergency support.6 To measure transfers of time, respondents are asked whether their family regularly provided or received unpaid caregiving—including childcare, eldercare, and other support—to or from individuals outside their immediate family during the past year. For monetary transfers, respondents are asked whether their family provided or received direct financial support during the preceding calendar year (excluding alimony and child support) to or from relatives or friends living elsewhere, including, for example, direct expense payments, tuition, real estate downpayments, and substantial gifts. For emergency support, after questions about covering income shortfalls, respondents are asked whether they, or their spouse or partner, could obtain at least $3,000 from friends or relatives during an emergency (which earlier SCFs also asked), and whether friends or relatives might rely on them for financial assistance during an emergency.
We construct indicator variables for participation in an informal F/CG network, types of engagement (time, monetary, or emergency), and roles (provision or receipt) from these question sets, abstracting from their slightly different reference periods and framing. In particular, we classify a family in the "informal F/CG network" group if the respondent answers affirmatively to any of the time, monetary, or emergency support questions. Conversely, families that answer negatively across all three categories are classified in the "no informal F/CG network" group. Note that families classified as "no informal F/CG network" may still have social ties and relationships that fall outside the scope of our data. They may also have people and communities they support or who support them in ways we do not observe, such as through non-financial emergency assistance. Thus, being classified in the "no informal F/CG network" group does not necessarily indicate that the family has no informal support network at all—rather, families in this group lack certain key supports that likely leaves them more vulnerable to adverse shocks.
As shown in Figure 1, informal F/CG networks are quite common, with 85.4 percent of families connected to one. Such families likely have some divergence between their balance sheets and the resources they can draw upon to meet their budget needs. The vast majority of families—79.7 percent—can provide or receive resources within their network in an emergency. And while less common, a considerable share, 44.2 percent, provided or received either money or time during the past year. Monetary support and time support are about equally common at around 28 percent. These rates reveal two clear findings about informal F/CG network participation. First, for roughly 40 percent of families, participation is limited to emergency situations. Two, among the more than 85 percent of families belonging to an informal F/CG network, over half routinely give or receive support, demonstrating that active resource-sharing is quite prevalent. All this said, Figure 1 also indicates that 14.6 percent of families—about one in seven—are not part of an informal F/CG network, such that their budget constraints are likely well-captured by their balance sheets alone.
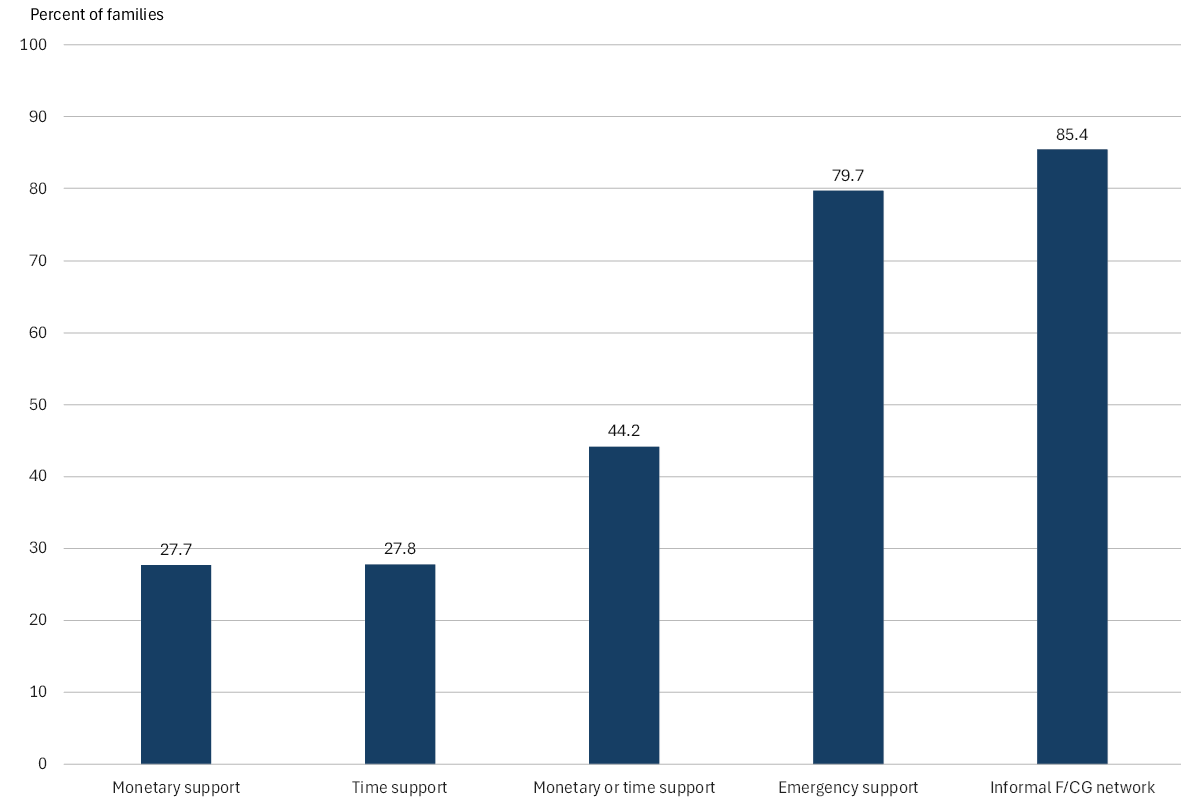
Note: From left to right, bars display the percent of families that: actively provided or received monetary support (monetary support), actively provided or received time support (time support), actively provided or received monetary or time support (monetary or time support), could be relied on to give or could receive emergency financial support (emergency support), and is in any of these groups (informal F/CG network).
Source: Board of Governors of the Federal Reserve System (2026).
Figure 2 decomposes participation in informal F/CG networks for the wealth distribution, showing how balance sheet resources and these networks interact.7 Active support via money or time through informal F/CG networks (purple bars) fluctuates narrowly between 40 and 49 percent of families in each wealth decile without a clear distributional pattern. That said, participation is notably elevated in the bottom decile, particularly relative to other lower-wealth groups, consistent with active informal F/CG support playing a prominent role where balance sheets are thinnest. In contrast, participation in an emergency network (black bars)—which is more prevalent in general—is more common among higher wealth families.8 Roughly 60 percent of families in each of the bottom two wealth deciles are relied on or can rely on others for funds in an emergency. However, this share steps up notably to 74 percent in the next two deciles, climbing more gradually from there to more than 90 percent of families in each of the top two deciles.9
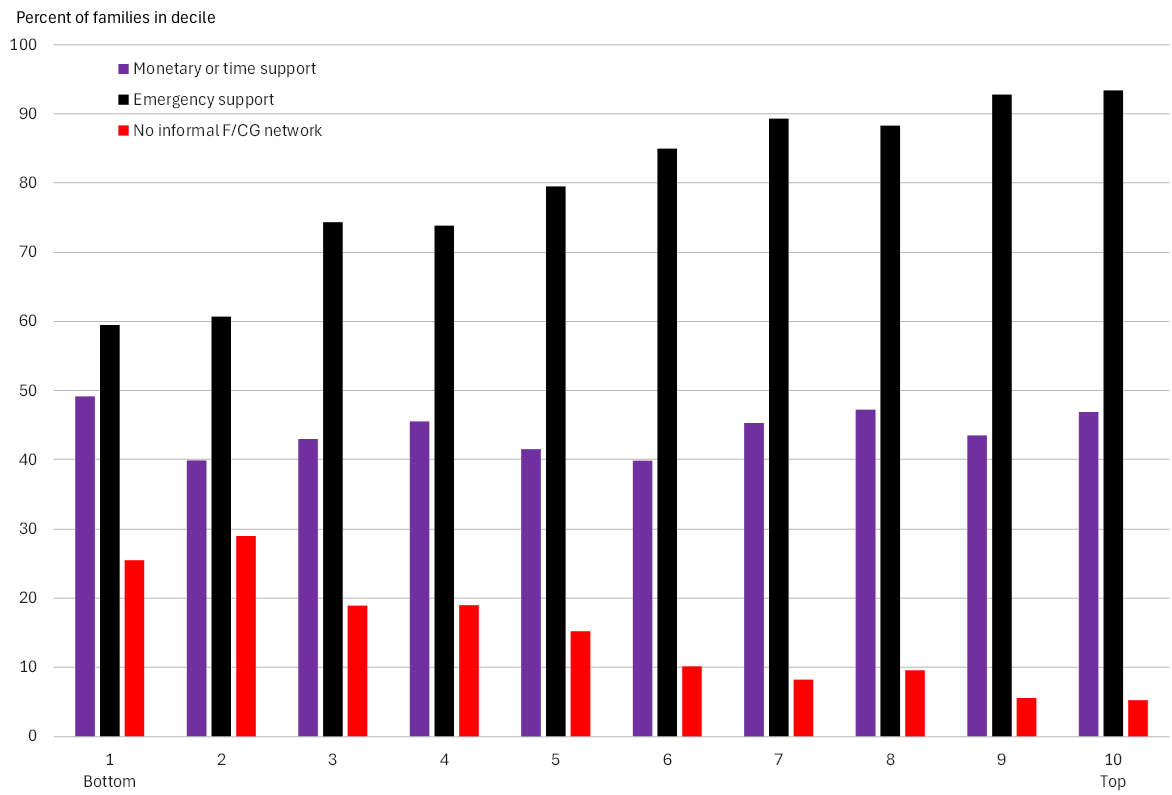
Note: Bars display the percent of families within each wealth decile that actively provided or received support (purple bars), could be relied on to give or could receive emergency financial support (black bars), or are not part of an informal F/CG network (red bars). Families that are not part of an informal F/CG network respond negatively to all informal network questions in the survey. The legend from top to bottom identifies bars within each wealth decile from left to right.
Source: Board of Governors of the Federal Reserve System (2026).
Consequently, a key finding is that families that are not part of an informal F/CG network are more concentrated at the bottom of the wealth distribution (red bars). Over one-quarter of families in the bottom two deciles are not part of such a network, compared with about 5 percent in the top two deciles, with this divergence driven by the steep drop-off in emergency networks among low-wealth families. Thus, while participation in an informal F/CG network via monetary or time support is on the higher end of its range among families in the lowest wealth decile, this same wealth group is also more likely not to be in an informal F/CG network at all, demonstrating that routine support alone provides an incomplete picture of the extent of a family's network.
The fact that wealthier families are more likely to participate in an informal F/CG network—and in a manner that is particularly obscured on traditional balance sheets because support is contingent on an emergency—highlights two key contributions of this analysis. First, regarding economic inequality, the increase in network participation with wealth indicates that higher-wealth families are more likely to have effective financial resources beyond what balance sheet metrics alone would indicate. In contrast, emergency connectivity drops off precisely where financial reserves are the lowest. This pattern suggests that relying on wealth alone to measure families' financial well-being may understate overall economic inequality in terms of the broader resource constraints shaping household decision-making.10
Second, regarding risk, this drop-off identifies a group of families in a uniquely precarious position that traditional economic statistics obscure: those with low wealth and without an informal F/CG network. Exclusive reliance on balance sheet measures might categorize all families below a certain wealth threshold as uniformly unable to handle adverse shocks, whereas accounting for informal F/CG networks allows further differentiation. Specifically, these networks can buffer an economic shock for a low-wealth family, whereas low-wealth families without such a network have no buffer and may be, for example, more likely to default on debt obligations, forgo essential medical care, or face severe material hardship. For the purposes of this analysis, families in the bottom two deciles of the wealth distribution that are not part of an informal F/CG network constitute the "high risk" group. Under this definition, reflecting the large share of families in the lowest wealth groups who are not part of informal F/CG networks, slightly more than 1 in every 20 U.S. families are high risk.
Table 1 compares the characteristics of three groups of families: those that are part of an informal F/CG network; those that are not; and those that are high risk (a low-wealth subset of families that are not part of an informal F/CG network).11 To interpret the table, note that the figures within each panel sum to 100 percent down the columns; thus, the panel for "percentile of usual income" under "informal F/CG network" describes the distribution of families within informal F/CG networks (as opposed to the proportion of each income group that is part of an informal F/CG network). Consider a few illustrative baseline results. Relative to families overall, families in an informal F/CG network tend to have higher income, with only 16.8 percent belonging to the bottom income quintile; by contrast, 38.5 percent of families not in an informal F/CG network belong to this quintile. Examining geographic distribution, families in an informal F/CG network are more concentrated in higher-density urban areas than families not in an informal F/CG network. However, once the low-wealth restriction is applied, this pattern fully reverses: high-risk families are even more concentrated in urban areas than families in an informal F/CG network.
Table 1. Characteristics of Families Based on their Participation in an Informal Financial/Caregiving (F/CG) Support Network and Wealth
| Family characteristic | Informal F/CG network | No informal F/CG network | High risk |
|---|---|---|---|
| Percent of families in group | |||
| All families | 85.4 | 14.6 | 5.5 |
| Percentile of usual income | |||
| Less than 20 | 16.8 | 38.5 | 62.7 |
| 20-39.9 | 19.0 | 26.1 | 29.1 |
| 40-59.9 | 20.4 | 17.9 | 7.4 |
| 60-79.9 | 21.6 | 10.8 | 0.5 |
| 80-89.9 | 11.2 | 3.1 | 0.3 |
| 90-100 | 11.1 | 3.6 | 0.0 |
| Age of reference person (years) | |||
| Less than 35 | 19.6 | 19.3 | 31.6 |
| 35-44 | 17.2 | 17.8 | 17.2 |
| 45-54 | 16.5 | 14.2 | 14.0 |
| 55-64 | 17.3 | 16.6 | 16.9 |
| 65-74 | 16.4 | 16.1 | 11.3 |
| 75 or more | 13.0 | 16.0 | 9.0 |
| Education of reference person | |||
| No high school diploma | 7.2 | 16.2 | 22.5 |
| High school diploma | 22.1 | 37.9 | 36.5 |
| Some college | 26.4 | 24.0 | 24.8 |
| College degree | 44.4 | 21.9 | 16.1 |
| Race or ethnicity of respondent | |||
| White non-Hispanic | 62.0 | 52.9 | 38.2 |
| Black or African American non-Hispanic | 13.1 | 18.1 | 27.5 |
| Hispanic or Latino | 11.0 | 16.5 | 19.4 |
| Asian | 4.3 | 2.8 | 1.1 |
| Other (non-Asian) or multiple race | 9.6 | 9.6 | 13.9 |
| Housing status | |||
| Owner | 68.0 | 51.2 | 6.7 |
| Renter or other | 32.0 | 48.8 | 93.3 |
| Urbanicity | |||
| Metropolitan statistical area (MSA) | 88.0 | 83.7 | 92.4 |
| Non-MSA | 12.0 | 16.3 | 7.6 |
| Percentile of net worth | |||
| Less than 25 | 21.8 | 43.5 | 100.0 |
| 25-49.9 | 24.1 | 30.1 | 0.0 |
| 50-74.9 | 26.5 | 16.3 | 0.0 |
| 75-89.9 | 16.4 | 6.5 | 0.0 |
| 90-100 | 11.1 | 3.6 | 0.0 |
Note: Table rows follow classifications from Aladangady et al. (2026), which describes the construction of these subgroups. Families that are part of an informal F/CG network ("informal F/CG network") respond affirmatively to at least one informal network question in the survey; families that are not part of an informal F/CG network ("no informal F/CG network") respond negatively to all of them. High risk families are the subset of the latter group in the bottom two deciles of the wealth distribution.
Source: Board of Governors of the Federal Reserve System (2026).
Across these groups, a striking pattern emerges: families that are more vulnerable to economic shocks, according to our classifications, are also more likely to appear fragile along other key dimensions. Relative to families in an informal F/CG network, families not in such a network are disproportionately lower-wealth families (43.5 percent belong to the bottom wealth quartile versus 21.8 percent), lower-income (as noted above, 38.5 percent belong to the bottom income quintile versus 16.8 percent), and less-educated (54.1 percent hold a high school diploma or less versus 29.3 percent).
The profile skews even more sharply disadvantaged among the high-risk group. While the dramatically lower asset levels of this third group follow by construction, high-risk families are much more heavily low-income (62.7 percent in the bottom income quintile), renters (93.3 percent), and non-college-educated (59.0 percent hold a high school diploma or less). Furthermore, this group consists of a disproportionately large share of young families as well as Black and Hispanic families: 31.6 percent are under age 35 (versus 19.3 percent for all families that are not part of an informal F/CG network), and 27.5 percent and 19.4 percent are Black and Hispanic, respectively (versus 18.1 percent and 16.5 percent). Altogether, these patterns demonstrate that vulnerability to economic shocks stemming from lack of an informal F/CG network concentrates heavily within traditionally disadvantaged subpopulations, potentially reinforcing their financial fragility.
Figure 3 plots the modes of informal support across wealth deciles, conditional on a family actively providing or receiving support (the leftmost group in Figure 2). By focusing on active participants, this decomposition illustrates the distinct roles families play within their networks and how different types of resources flow across the wealth distribution. Notably, because the share of families who are actively providing or receiving support is relatively flat across the wealth distribution, the variations between wealth groups in Figure 3 are largely interpretable as differences in the nature of network engagement.
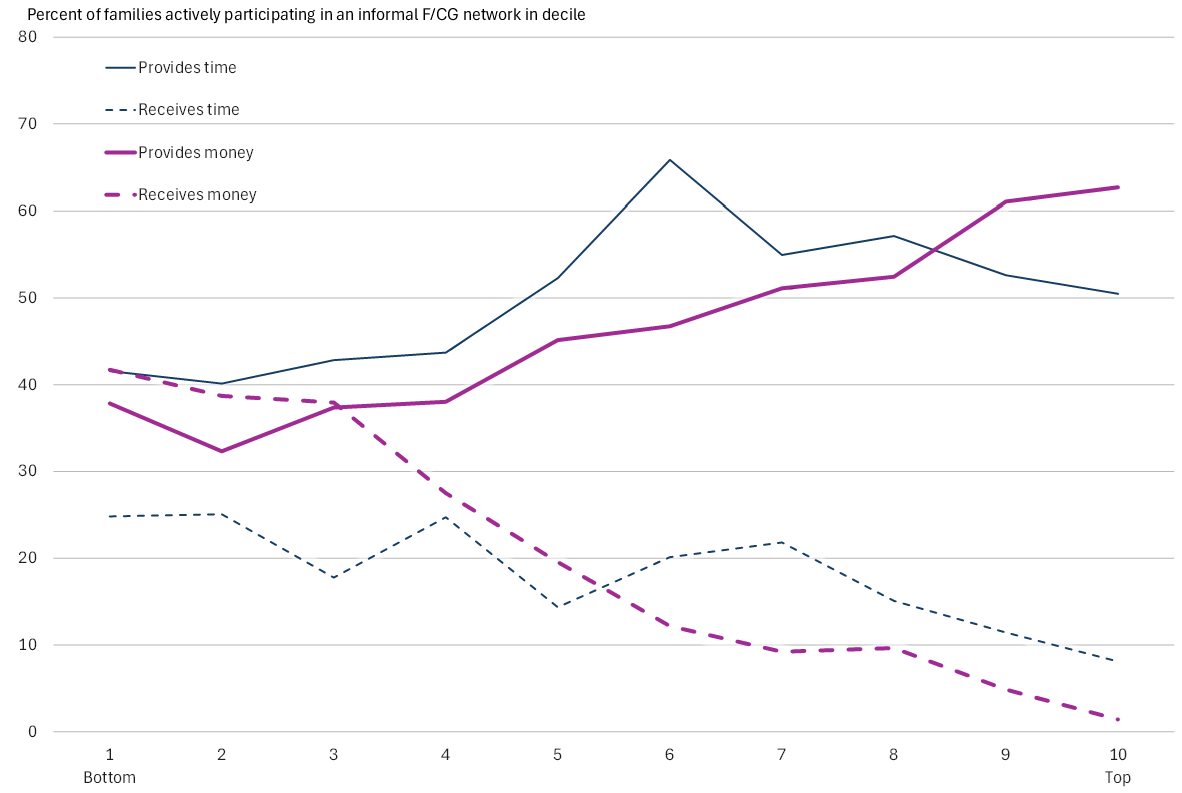
Note: Figure displays the percent of families that actively provided or received informal F/CG support within each wealth decile, separately showing the percent that provided time support, received time support, provided monetary support, and received monetary support. Solid lines indicate provision, and dashed lines indicate receipt. Thin blue lines indicate time support, and thick pink lines indicate monetary support.
Source: Board of Governors of the Federal Reserve System (2026).
Across almost the entire distribution, a larger share of families provide resources through their networks than receive them (solid lines versus dashed lines).12 However, this gap between aggregate rates of provision and receipt is relatively narrow at lower wealth levels and becomes substantially wider as wealth increases, consistent with greater reciprocity at lower wealth levels (defined as the same families both giving and receiving resources) and very little at higher wealth levels.13 Indeed, the share of active participants that both give and receive resources falls over the wealth distribution, from 23.1 percent in the bottom decile to 3.6 percent in the top decile (not shown).
With respect to monetary support (thick pink lines), a scissor pattern emerges across the distribution. Among active participants in the bottom few wealth deciles, around 40 percent receive informal financial support. The share then plunges, plateaus at low levels in the upper segments, and virtually vanishes at the top, where only 1.4 percent of such families receive money. Conversely, providing monetary support rises continuously with wealth, from 37.8 percent in the bottom decile to 62.7 percent in the top. Notably, the share providing and receiving money in the bottom few deciles is remarkably similar, consistent with financial reciprocity among resource-constrained families.14 The opposite is true for those toward the top, where more families are providing monetary support.
With respect to time-based support (thin blue lines), overall differences across wealth groups are not as pronounced as they are for monetary support, though wealthier families again lean more toward providing help and lower-wealth families toward receiving it. As such, the gap between giving and receiving time still grows over the wealth distribution but less dramatically. In particular, the share of families receiving time support trends slightly downward across most of the distribution—moving from 25 percent to 15 percent, on balance—before tapering to around 10 percent in the top two deciles. Time provision moves from about 40 percent to 50 percent, on balance, but in contrast to the roughly linear trends by wealth in the other three series, it exhibits a pronounced inverted U-shape, surging to over 65 percent across the middle-wealth deciles. Similar to monetary exchange, the shares providing and receiving time are consistent with more reciprocity at lower wealth levels and net provision at higher wealth levels, but the gap between giving and receiving time is narrower across the distribution, in line with higher overall reciprocity in time transfers.15
Altogether, these patterns illustrate how families occupy distinct roles in informal F/CG networks depending on their wealth. While aggregate rates of giving and receiving are roughly equal for lower-wealth families, higher-wealth families are overwhelmingly net providers, driven in part by a steady decline in individual household reciprocity. Networks become increasingly one-sided in the middle of the wealth distribution where time provision peaks, with money becoming the dominant mode of support at the highest wealth levels.
References
Aladangady, Aditya, Jesse Bricker, Andrew C. Chang, Sarena Goodman, and Gina Li (2026a). "Heterogeneity in the Marginal Propensity to Consume Among U.S. Households," FEDS Notes. Washington: Board of Governors of the Federal Reserve System, October 9.
Aladangady, Aditya, Jesse Bricker, Andrew C. Chang, Sarena Goodman, and Gina Li (2026b). "Measuring Spending in the Survey of Consumer Finances," FEDS Notes. Washington: Board of Governors of the Federal Reserve System, October 9.
Aladangady, Aditya, Jesse Bricker, Andrew C. Chang, Sarena Goodman, Gina Li, Kevin B. Moore, Sarah Reber, Alice Henriques Volz, and Richard A. Windle (2026). Changes in U.S. Family Finances from 2022 to 2025: Evidence from the Survey of Consumer Finances. Washington: Board of Governors of the Federal Reserve System, October, https://doi.org/10.17016/8799.1.
Bergeot, Julien, Marie Blaise, Sandrine Juin, and Hélène Le Forner. "Informal Caregiving Within the Household and Family." Handbook of Labor, Human Resources and Population Economics (2025): 1-37.
Board of Governors of the Federal Reserve System. Division of Research and Statistics, Microeconomic Surveys (2026). "Survey of Consumer Finances.".
Chetty, Raj, Matthew O. Jackson, Theresa Kuchler, Johannes Stroebel, Nathaniel Hendren, Robert B. Fluegge, Sara Gong, Federico Gonzalez, Armelle Grondin, Matthew Jacob, Drew Johnston, Martin Koenen, Eduardo Laguna-Muggenburg, Florian Mudekereza, Tom Rutter, Nicolaj Thor, Wilbur Townsend, Ruby Zhang, Mike Bailey, Pablo Barberá, Monica Bhole, and Nils Wernerfelt. "Social capital I: measurement and associations with economic mobility." Nature 608, no. 7921 (2022): 108-121. https://doi.org/10.1038/s41586-022-04996-4.
McGarry, Kathleen. "Dynamic aspects of family transfers." Journal of Public Economics 137 (2016): 1-13.
Ross, Michael, and Fiore Sicoly. "Egocentric biases in availability and attribution." Journal of Personality and Social Psychology 37, no. 3 (1979): 322.
Appendix: 2025 SCF Questions on Informal Support Networks
Section A questions:
Many individuals and families give caregiving help to friends and family members or receive it from them. Such help is an important component of overall economic well-being. The next questions ask about this type of help.
Over the past year, did you (or your family living here) regularly *receive* help or caregiving (including childcare, eldercare, and other support) from individuals outside of your immediate family that (you/your family) did not pay for?
Over the past year, did you (or your family living here) regularly *provide* help or caregiving (including childcare, eldercare, and other support) to individuals outside of your immediate family that (you/your family) did not get paid for?
Section T questions:
During 2024, did you (or any of your family living here) *provide* any (other) financial support for relatives or friends who do not live here? Please do not include alimony or child support.
INCLUDE TUITION PAYMENTS, DOWNPAYMENTS FOR REAL ESTATE PURCHASES, SUBSTANTIAL GIFTS, AND EXPENSES THAT WERE PAID DIRECTLY ON SOMEONE ELSE'S BEHALF.
During 2024, did you (or someone in your family living here) *receive* any financial support from relatives or friends who do not live here? Please do not include alimony or child support.
INCLUDE TUITION PAYMENTS, DOWNPAYMENTS FOR REAL ESTATE PURCHASES, SUBSTANTIAL GIFTS, AND EXPENSES THAT WERE PAID DIRECTLY ON THEIR BEHALF.
Section J questions:
Do you have any close friends or relatives who may rely on you for financial assistance in the event of an emergency?
In an emergency could you (or your {husband/wife/partner}) get financial assistance of $3,000 or more from any friends or relatives who do not live with you?
1. Division of Research and Statistics, Board of Governors of the Federal Reserve System. This research represents the views of the authors and does not indicate concurrence either by other members of the Board's staff or by the Board of Governors. Aladangady: [email protected], ORCID 0009-0003-8366-3511. Bricker: [email protected], ORCID 0000-0002-0404-2561. Chang: [email protected], ORCID 0000-0002-9769-789X. Goodman: [email protected]. Li: [email protected], ORCID 0000-0001-9492-0841. We thank Burcu Duygan-Bump, Elizabeth K. Kiser, Kevin B. Moore, Karen M. Pence, and Alice Henriques Volz for helpful comments. Return to text
2. See Board of Governors of the Federal Reserve System (2026) to download the data. The 2025 SCF also includes new questions on families' total spending over the past 12 months and their hypothetical rates of spending, saving, and paying down debt if the family were to unexpectedly receive income. These other new questions are analyzed for the first time in Aladangady et al. (2026a, 2026b). Return to text
3. A version of the question on the informal provision of monetary support has been asked previously, as was a question on the ability to obtain $3,000 from an informal network during an emergency that helps define membership of an emergency network in this note. This analysis focuses on active transfers of time and money, setting aside inheritances and other modes of support observed in our data, including housing, for separate study. Return to text
4. The SCF data used in this note are derived from the final internal version of the survey information. Return to text
5. These figures refer to the bottom two deciles of the wealth distribution and the top two deciles, respectively. Return to text
6. See appendix for question language. Return to text
7. Our analysis uses the "net worth" definition of wealth in the SCF, described by Aladangady et al. (2026). Return to text
8. Participation in an emergency network is derived from questions about whether the family has any close friends or relatives who would rely on them financially during an emergency (with no specific magnitude given), and whether the family can obtain $3,000 from friends or relatives in an emergency. Examining these responses separately yields similar distributional patterns, suggesting that the positive relationship between emergency support and wealth is not exclusively driven by higher wealth families acting as emergency backstops. In fact, across all wealth deciles, the share of families able to obtain $3,000 equals or exceeds the share relied upon by others and increases more sharply with wealth. That said, if lower-wealth families can access amounts below the $3,000 threshold, our measure would somewhat understate emergency connectivity in lower wealth deciles, contributing to this steeper slope. Return to text
9. This pattern is consistent with recent evidence on socioeconomic homophily in social networks (Chetty et al., 2022), as lower-wealth families are less likely to have liquidity available to share on an emergency basis. Return to text
10. Importantly, this relationship reflects the extensive margin of network participation; continuous measures that allow differential intensity could generate a different distributional picture and implication for inequality. Return to text
11. The table uses the same classifications as Aladangady et al. (2026), which also describes their construction. In particular, a family's location in the income distribution is based on its usual income (or the income a family expects to receive in a normal year), which helps assure its position in the distribution does not reflect transitory factors. Return to text
12. This persistent imbalance implies either systematic reporting bias towards recalling the family's contributions (that is, an egocentric bias, see Ross and Sicoly, 1979) or a many-to-one flow structure, wherein it is common for multiple network members to provide resources to a single recipient family. Return to text
13. Another dimension of reciprocity, which we cannot observe in our data, involves transfers between households in the same wealth group. Return to text
14. Among families that either provide or receive monetary support, the share that do both falls over the wealth distribution. One possible explanation is that lower-wealth families engage in real-time, two-way monetary exchange to smooth temporary liquidity shocks within the year. Return to text
15. Among families that either provide or receive time support, the share that do both similarly falls over the wealth distribution. In all but two wealth deciles (the first and the fourth), the share of time-transferring families that both provide and receive time is larger than the share of monetary-transferring families that both provide and receive monetary support. Interestingly, the aggregate share of families providing time in the bottom few deciles is comparable to the aggregate shares of families providing and receiving monetary support, suggesting reciprocity across both dimensions in this segment. Return to text
Aladangady, Aditya, Jesse Bricker, Andrew C. Chang, Sarena Goodman, and Gina Li (2026). "Informal Support Networks in the Survey of Consumer Finances," FEDS Notes. Washington: Board of Governors of the Federal Reserve System, October 09, 2026, https://doi.org/10.17016/2380-7172.4195.
Disclaimer: FEDS Notes are articles in which Board staff offer their own views and present analysis on a range of topics in economics and finance. These articles are shorter and less technically oriented than FEDS Working Papers and IFDP papers.