FEDS Notes
March 03, 2025
Insights from MMF Portfolio Allocations amid Balance Sheet Normalization
Erik Bostrom1
I. Introduction
In June of 2022, the Federal Reserve (Fed) began to reduce its securities holdings and decrease the size of its balance sheet, a process known as balance sheet runoff. The decline in the Fed's assets mechanically results in a decline in Fed liabilities, and on net since June 2022, most of the decline in securities holdings has been associated with a decline in use of the Fed's overnight reverse repurchase (ON RRP) facility, a facility in which eligible counterparties are able to enter into an overnight reverse repo agreement with the Fed, earning the ON RRP rate on funds held at the facility. While daily take-up at the ON RRP facility remained elevated above $2 trillion between the start of balance sheet runoff in June 2022 through May 2023, starting in June 2023, take-up at the ON RRP facility began to decline sizably, with lower ON RRP take-up driven primarily by money market mutual funds (MMFs) reallocating cash out of the facility.2
As designed, the ON RRP facility has been effective in supporting the implementation of monetary policy by helping to ensure the effective federal funds rate remains within the Fed's target range. However, some outside observers have at times expressed concern that MMFs have a bias toward keeping funds in the facility and might be reticent to redirect ON RRP investments into the private market when higher rates emerged. To understand how MMFs have viewed the ON RRP facility, this note seeks to measure MMFs' rate sensitivities for portfolio reallocation between the facility and private investments. Specifically, the analysis in this note measures the daily rates that MMFs earn on private repo transactions and analyzes MMF flows between the ON RRP facility and private repo. While this analysis does not measure reallocation of ON RRP investments into other assets, such as Treasury bills, MMF flows between the ON RRP and private repo are the most comparable in terms of contract type and maturity. Therefore, looking at the relationship between the two assets is most useful to understand MMFs' incentives to participate in the facility.
Utilizing a novel mapping of repo counterparties and daily transaction-level repo microdata, this note examines the rate spreads that ON RRP-eligible MMFs require in overnight private repo to reallocate out of the ON RRP facility.3 The findings suggest that since June 2022, MMFs have been willing to switch into private repo when they can earn a spread of 0 to 3 basis points above the ON RRP offering rate, with most reallocation occurring with private repo rates at the ON RRP offering rate. The results also show a smaller volume of reallocation to private repo at rates below the ON RRP rate, consistent with MMFs maintaining balances and relationships with dealers in anticipation of higher future spreads. Taken together, the microdata does not suggest that MMFs have required a meaningfully large spread to leave the ON RRP facility.
II. Background
Between June 2022 and May 2023, ON RRP take-up remained above $2 trillion, peaking at a monthly average of $2.3 trillion in daily take-up in April 2023. During that period, Treasury bill supply (a key alternative investment for MMFs) was low and rates on private Tri-Party repo transactions, as measured by the Tri-Party General Collateral Rate (TGCR), were generally below the ON RRP rate (see Figure 1).
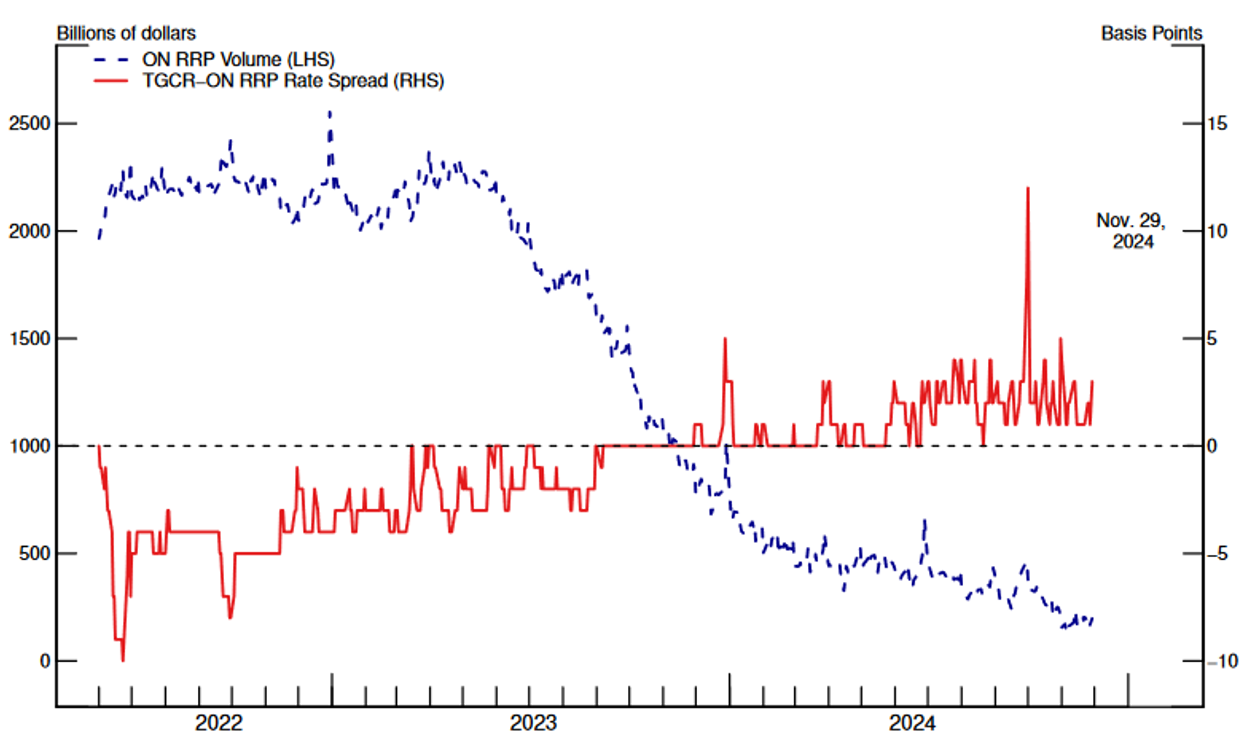
Note: The dashed horizontal line indicates where the TGCR−ON RRP rate spread equals zero.
Source: FRBNY, author's calculations.
Since April 2023, however, take-up in the facility has fallen dramatically, primarily driven by MMFs, which, since then, have comprised over 95 percent of the decline in ON RRP take-up. According to Federal Reserve Bank of New York (FRBNY) data, by November 2024 month-end, ON RRP facility take-up had fallen to $198 billion, as MMFs reduced participation in the ON RRP by roughly $2 trillion. Over the same horizon, Securities and Exchange Commission (SEC) N-MFP filings show that these MMFs had allocated about $1.8 trillion and $900 billion into Treasury securities and private Treasury-collateralized repo, respectively.4 Specifically, between April 2023 and November 2024 month-ends, MMFs' holdings of Treasury bills, overnight Treasury repo, and term Treasury repo increased by roughly $1.7 trillion, $600 billion, and $300 billion, respectively (see Figure 2).5 While most ON RRP reallocation went into Treasury bills, this note focuses specifically on changes in overnight Treasury repo, which is the closest private market equivalent to the ON RRP based on contract type, tenor, and underlying collateral.
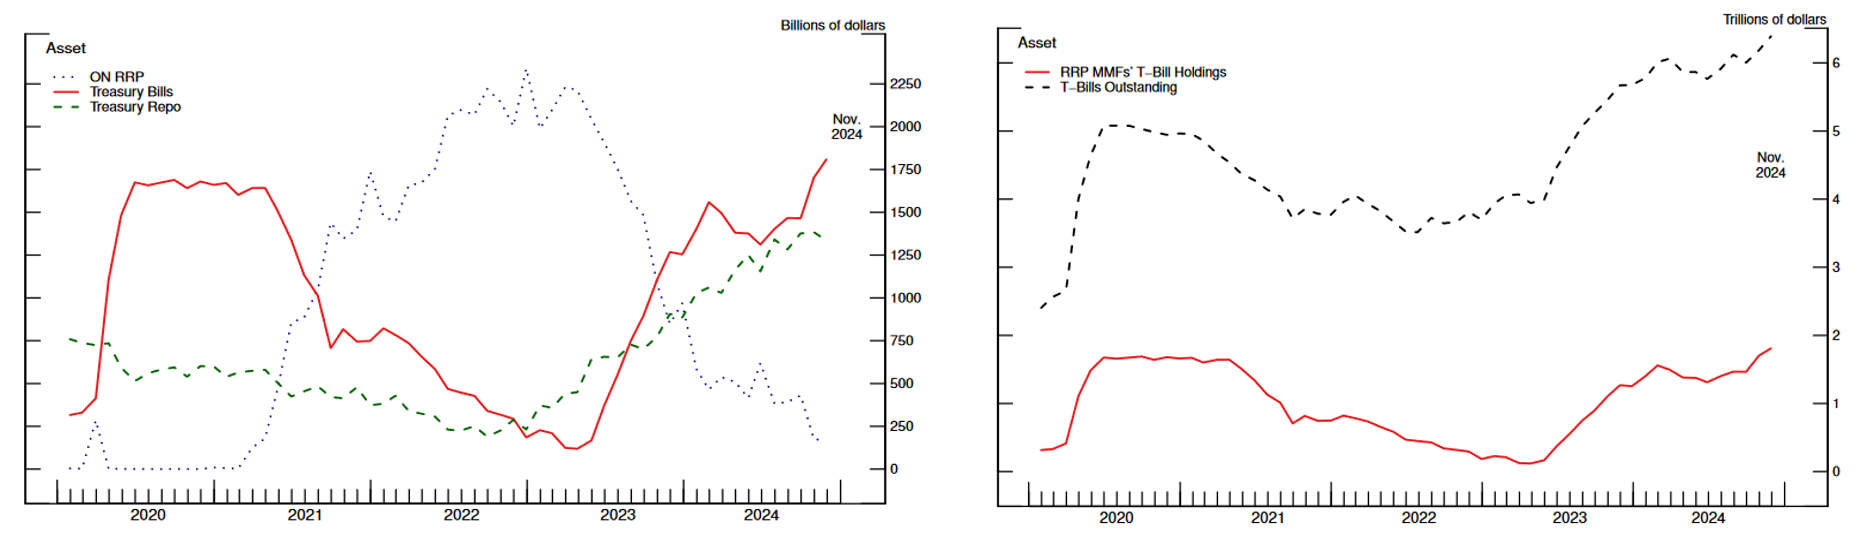
Left Chart: Figure 2a. Monthly Holdings for RRP-Eligible MMFs.
Source: SEC N-MFP filings, author's calculations.
Right Chart: Figure 2b. Monthly Treasury Bills Outstanding and Bill Holdings for RRP-Eligible MMFs.
Source: SEC N-MFP filings, FRBNY, Treasury Department, author's calculations.
Amid declining ON RRP take-up, private market repo rates were also increasing gradually, with the TGCR increasing from 2 basis points below the ON RRP offering rate, on average, in May 2023 to 2 basis points above the ON RRP offering rate, on average, in November 2024. The coinciding increases in private repo rate spreads could have suggested that some MMFs might have required increasingly attractive private rates to continually shift ON RRP funds out of the facility.6 However, the analysis in this note below shows that MMFs have not required meaningfully higher rate spreads to reallocate into private repo.7
III. Data and Methodology
To track the extent of substitution between the ON RRP and private repo, this note uses confidential data from the Bank of New York Mellon (BNYM) and the Office of Financial Research (OFR) to measure repo investments in the ON RRP facility, Tri-Party, and FICC-DvP segments.8 From this data, one can observe MMFs' private repo transactions and ON RRP facility usage on any given day since the start of balance sheet runoff.9 To measure MMFs' reallocation volumes and rates associated with those volumes, this note uses the following methodology:
1. Identification
I identify flows between the ON RRP and private overnight repo by tracking all days when a MMF's private repo holdings increased and ON RRP holdings decreased, or vice versa. If private repo increases and ON RRP take-up decreases, the positive flow into private repo is calculated as the minimum between the increase in private repo and the decrease from the ON RRP. In contrast, if ON RRP take-up increases and private repo holdings decrease, the negative flow out of private repo is calculated as the minimum between the decrease in private repo and the inflow into the ON RRP (see equation below).10
$$\Delta$$ Volume = MIN[abs($$\Delta$$ private repo), abs($$\Delta$$ ON RRP)]*Direction of Private Repo Flows
2. Determining Rate Spreads
To determine the rate spreads that MMFs reallocated funds into/out of the ON RRP facility at, I look at each MMF's transaction-level data for repo lending on a counterparty-by-counterparty basis. For each transaction, the data used provides the MMF, the borrowing counterparty, and the associated rate.11 Private repo volumes are then aggregated to show each MMF's daily volume at each rate spread to the ON RRP offering rate.12 When there are positive flows into private repo, as determined in Step 1, I identify the MMF-spreads pairings that experienced increases in net flows, and distribute the increase in private repo proportionally to those pairings based on their magnitude of their net flow. Alternatively, when there are negative flows out of private repo, as determined in Step 1, I identify the MMF-spreads pairings that experienced decreases in net flows and distribute the decrease in private repo proportionally to those pairings based on their magnitude of their net flow.
Once all changes in volumes (determined in Step 1) are distributed across the rate spreads, the flows by rate spread are then summed each day to determine the total volume of reallocation by rate spread.
[Example]
[Step 1]
For an illustrative example, assume a MMF has increased its private repo holdings by $6 billion and has decreased its holdings at the ON RRP by $3 billion. In that case, the reallocated volume into private repo from the ON RRP is identified to be $3 billion and is limited by the decline in ON RRP take-up.
$$\Delta$$ Volume = MIN[abs($$\Delta$$ private repo), abs($$\Delta$$ ON RRP)]*Direction of Private Repo
= MIN[abs($6 billion), abs(-$3 billion)]*(positive directional change) = $3 billion
[Step 2]
Assuming this MMF trades at three different rate spreads above the ON RRP offering rate (1, 2, and 3 basis points), in this example we observe the following daily changes:
- $$\Delta$$ Volume at Rate Spread +1 bps: -$7 billion
- $$\Delta$$ Volume at Rate Spread +2 bps: $5 billion
- $$\Delta$$ Volume at Rate Spread +3 bps: $8 billion
Since the change in private repo volume from the ON RRP, as identified in Step 1, is positive $3 billion, we would subset to just trading combinations (2) and (3) above and distribute the $3 billion proportionally as follows:
(2) Flow from ON RRP to private repo at +2 bps
= Step 1 $$\Delta$$ Volume * [$$\Delta$$ Volume at 2 bps /$$\Delta$$ Total Positive Volume]
= $3 billion*[$5 billion/($5 billion + $8 billion)]= $1.15 billion
(3) Flow from ON RRP to private repo at +3 bps
= Step 1 $$\Delta$$ Volume * [$$\Delta$$ Volume at 3 bps /$$\Delta$$ Total Positive Volume]
= $3 billion*[$8 billion/($5 billion + $8 billion)]= $1.85 billion
Aggregating these daily flows, we end up estimating that this MMF moved $3 billion from the ON RRP into private repo, consisting of $1.15 billion at +2 bps and $1.85 billion at +3 bps, respectively.
While assumptions are necessary to attribute the aggregated fund flow into different rates, the results appear to be robust to the specific procedure used here. Specifically, to make sure that this methodology does not accidentally obscure instances where MMF-borrower pairs might be moving existing private repo volumes around rate spreads, rather than from ON RRP facility, I also considered a modified methodology to additionally adjust for MMF-borrower net changes in private repo. Adding this additional step, however, resulted in little to no change in the overall results.
IV. Portfolio Reallocations and Rate Spreads
Figure 3 shows the cumulative direct substitution from MMFs' ON RRP investments to overnight private repo using the methodology from Section III. Since the start of balance sheet runoff, I identify about $750 billion of ON RRP take-up that has been reallocated to private repo, generally in-line with total increases in private repo as reported by month-end SEC filings for the same funds (the red circles in Figure 3).13
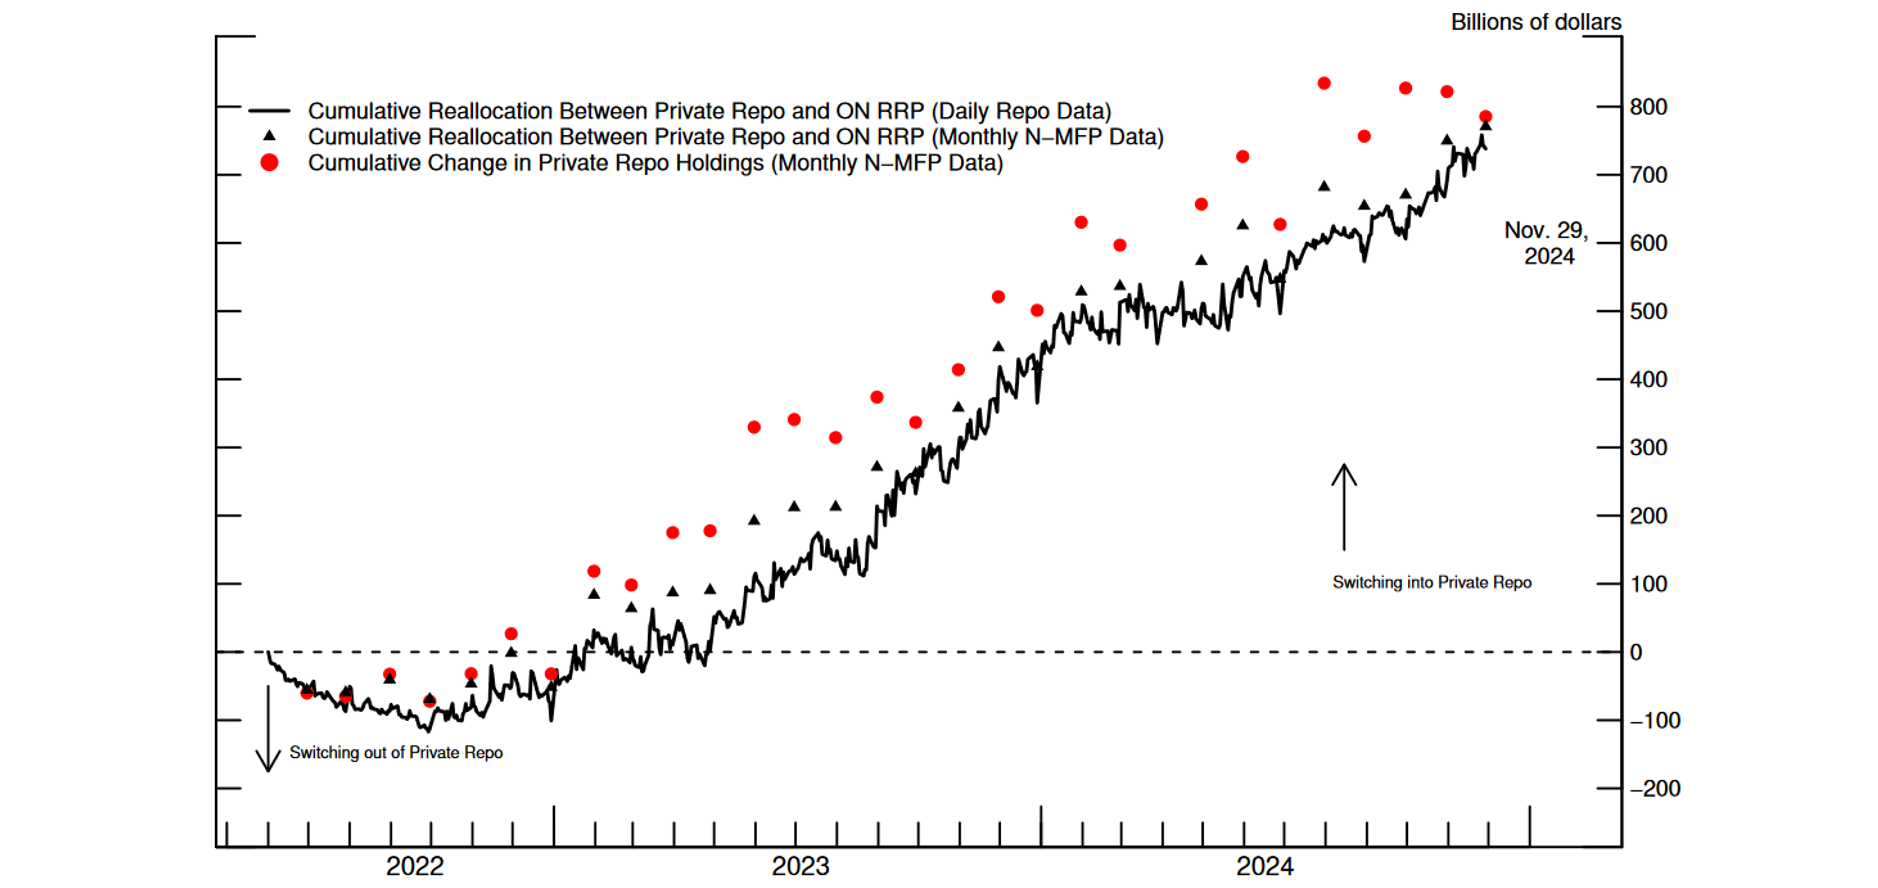
Notes: Reallocation between private repo and ON RRP applies the reallocation methodology described in Step 1 of this note. We apply this method daily to the confidential repo data (black line) and monthly to the public month−end N−MFP data (black triangles). The change in private repo holdings from the monthly N−MFP data (red dots) shows overall changes in private repo holdings, regardless if from the ON RRP, other assets, or changes in assets under management.
Source: FRBNY, OFR, Bank of New York Mellon, SEC N-MFP filings, author's calculations.
When looking at rate spreads, MMFs, on net, reallocated most volume into private repo at spreads of zero to 3 basis points above the ON RRP rate, with the most volume at a zero spread (see Figure 4). This is true both across funds and within each fund, as reallocations into private repo for most funds was most concentrated at the ON RRP offering rate when considering each individual fund's weighted median rate of reallocation. A somewhat surprising result is that a small amount of reallocation into private repo has also occurred at negative rate spreads.14 Ordinarily, the ON RRP offering rate should serve as a floor under private repo rates, with investors preferring to receive the highest rate available. However, trading at negative rate spreads may be explained by the desire by MMFs to maintain counterparty relationships, which tend to matter particularly in the Tri-Party segment of the repo market.15
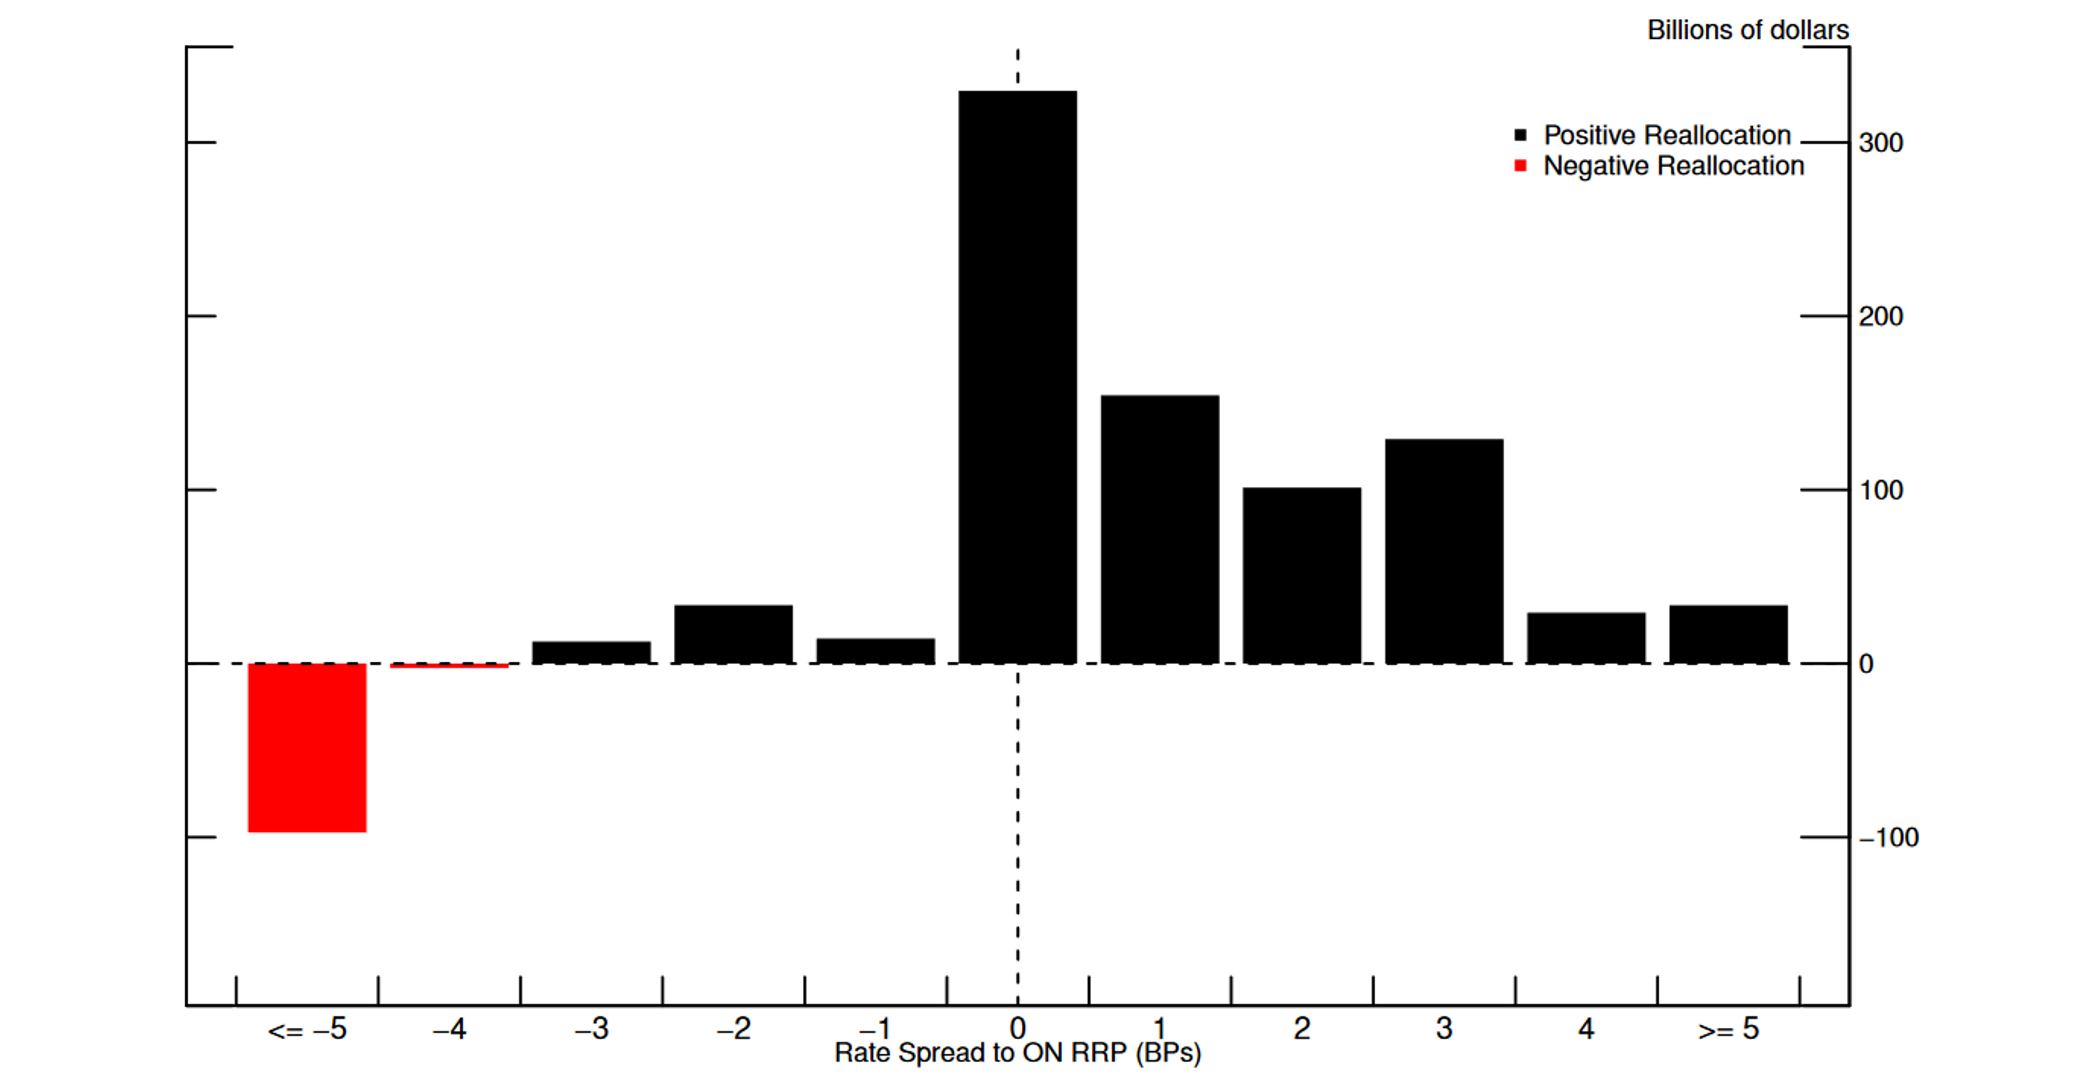
Note: Net reallocations start in June 2022 and end in November 2024.
Source: FRBNY, OFR, Bank of New York Mellon, author's calculations.
Since September 2023, an increasing share of direct substitutions have been observed at spreads 1 to 3 basis points above the ON RRP rate. These reallocations, however, have coincided with periods of elevated repo market rates and by funds that had also switched out of the ON RRP when offered rates were lower.16 This suggests that MMFs were not necessarily changing their preferences about the spread required to move out of the ON RRP facility, but instead were simply reallocating at prevailing market rates (see Figure 5).
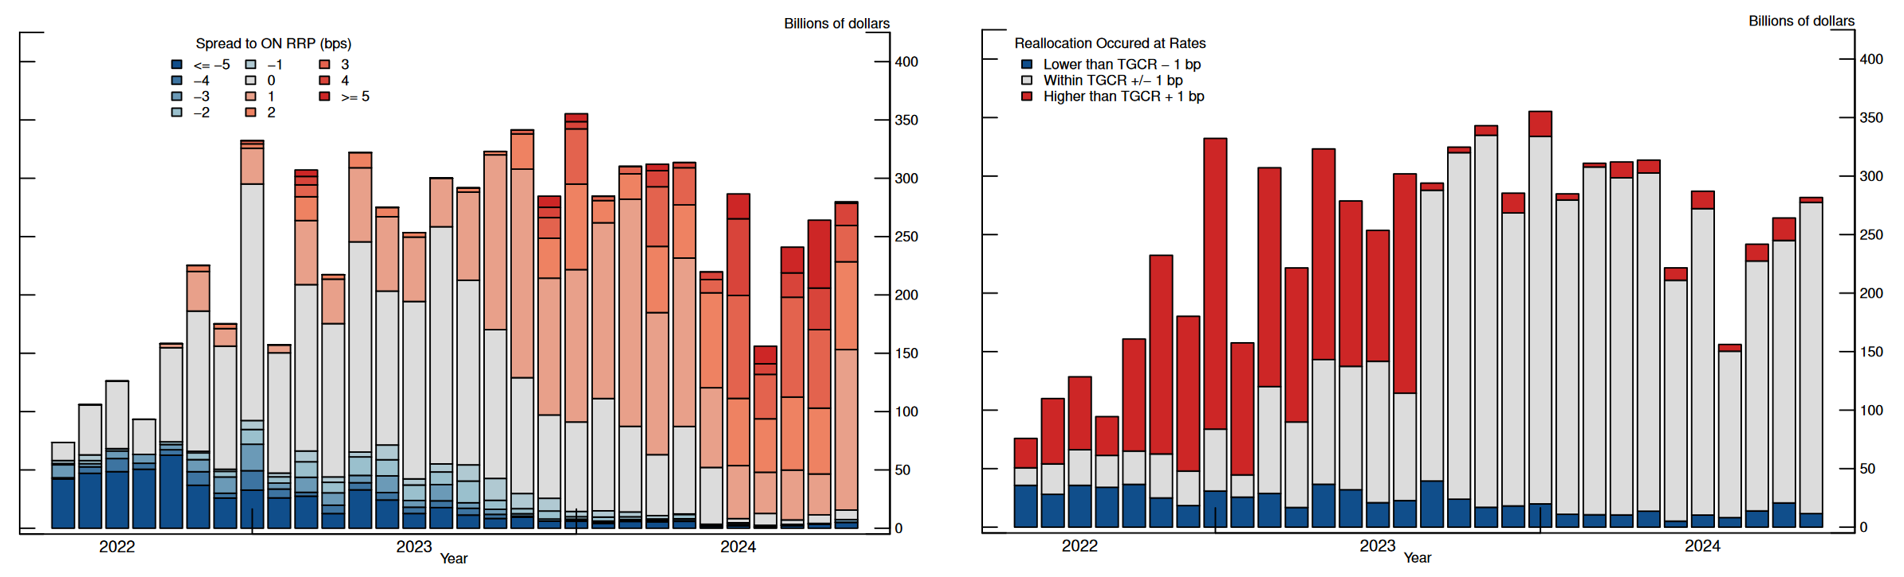
Left Chart: Figure 5a. Positive Reallocations into Private Repo by Rate Spread to ON RRP.
Note: Reallocation amounts displayed are the monthly totals into private repo and do not reflect flows out of private repo. For data confidentiality purposes, month−rate spread pairings were removed if the calculated data pairing did not contain 5 distinct, parent−levels borrowers and 5 distinct, parent−level lenders. The removed amount accounted for less than 1 percent of the positive reallocation amount into private repo. Key identifies in order from bottom to top.
Source: FRBNY, OFR, Bank of New York Mellon, author's calculations.
Right Chart: Figure 5b. Positive Reallocations into Private Repo Relative to TGCR.
Note: Reallocation amounts displayed are the monthly totals into private repo and do not reflect flows out of private repo. Key identifies in order from bottom to top.
Source: FRBNY, OFR, Bank of New York Mellon, author's calculations.
V. Conclusion
To determine how MMFs view outside options relative to the ON RRP facility, this note looks at the historical relationship between MMFs' ON RRP usage and private repo alternatives. The analysis in this note suggests that MMFs have been willing to reallocate funds out of the ON RRP even at relatively modest rate spreads, indicating that remaining balances should keep declining at current or higher rate spreads. However, the continuation of ON RRP decline could also depend on exogenous, rate-insensitive factors, such as private market repo capacity, MMF volume limits with existing counterparties, or MMF preferences to keep flexible balances in the ON RRP until term options emerge. Overall, this note suggests that ON RRP outflows are likely to continue if market rate spreads to the ON RRP offering rate increase further over time.
References
Sriya Anbil, and Zeynep Senyuz (2022). How Has Monetary and Regulatory Policy Affected Trading Relationships in the U.S. Repo Market? International Journal of Central Banking, 18 (4 October), 1-52.
Hempel, Samuel J., Calvin Isley, R. Jay Kahn, and Patrick E. McCabe (2023). "Money Market Fund Repo and the ON RRP Facility," FEDS Notes. Washington: Board of Governors of the Federal Reserve System, December 15, 2023.
Appendix
To construct an estimate of daily MMF repo portfolios, I created a new mapping of trading accounts across the Tri-Party and FICC-DvP platforms, linking RRP-eligible MMFs to their respective accounts at the ON RRP facility. Tri-Party, FICC, and ON RRP transaction-level data were obtained from the Bank of New York Mellon (BNYM) and the Office of Financial Research (OFR). Tri-Party and ON RRP data was collected under supervisory authority by FRBNY, while FICC-DvP data was obtained under a data sharing agreement.
Specifically, I map all lending and borrowing accounts across the Tri-Party and FICC platforms, providing each account, as applicable, with a Legal Entity Identifier (LEI), Securities and Exchange Commission (SEC) Series ID, Private Fund Identifier (PFID), RSSD ID, and SEC Central Index Key (CIK). I then assign each account a specific entity type (MMF, other domestic fund, domestic broker-dealer, foreign broker-dealer, retirement fund, hedge fund, domestic bank, etc.) and link the account to its respective legal parent entity. Lastly, I provide each trading entity a date range for entity type classification, RRP-eligibility, and parent. From these items, I create a dataset limited to transactions by MMFs with borrower pairs for the date ranges they are RRP-eligible and added checks to remove any transactions conducted with an affiliated counterparty under the same parent entity.
To map each trading account to their various identifiers, I developed a process using manual name identification alongside automated transaction matching for account validation. For FICC accounts, OFR provides LEIs directly, requiring only matching of additional ID information and date ranges using data from the SEC, FRBNY, and the National Information Center (NIC).
Tri-Party data, conversely, requires a more intricate matching and validation process for accounts, as account names in the system do not contain legal identifiers and many entities trade under multiple, non-uniform account names. After manually sorting accounts, I rely on other datasets that provide snapshots of logged Tri-Party transactions along with legal identifiers. For mutual funds (including MMFs) I use the SEC's Form N-MFP and Form N-PORT filings which provide month-end and quarterly snapshots, respectively, of mutual fund holdings and often contain Tri-Party transactions. Additionally, any sponsored GC transactions on the Tri-Party platform can be matched to additional OFR-provided data which contains LEIs, as sponsored GC is conducted via FICC but executed on the Tri-Party platform.
For Tri-Party borrowing accounts, I additionally correct for cash borrower account names in the transaction-level data that do not distinguish between entities within the same Bank Holding Company (BHC). To do this, I link transaction trading accounts to another supervisory BNYM Tri-Party dataset provided to FRBNY that contains collateral allocation information alongside detailed cash borrower names. The information for these detailed cash borrower names were manually added and then additionally verified for dealers using confidential collateral position data from the Federal Reserve's FR 2004 collection.
From the mappings of the Tri-Party and FICC-DvP trading accounts, the tables below provide the scope of distinct trading entities and their trading volumes across the segments:
Table 1: Number of Repo Trading Entities by Counterparty Type since June 2022
| Counterparty Type | FICC-DvP | Tri-Party | ||
|---|---|---|---|---|
| Cash Borrower | Cash Lender | Cash Borrower | Cash Lender | |
| Domestic Dealer | 36 | 37 | 34 | 6 |
| Foreign Dealer | 29 | 28 | 28 | 12 |
| Domestic Bank | 17 | 12 | 30 | 59 |
| Foreign Bank | 39 | 35 | 20 | 29 |
| Domestic Government | 18 | 21 | 0 | 138 |
| Foreign Government | 7 | 5 | 0 | 7 |
| Hedge Fund | 163 | 228 | 0 | 12 |
| Money Market Fund | * | 149 | 0 | 203 |
| Other US-based Fund | 49 | 1151 | 0 | 274 |
| Offshore Fund | 9 | 159 | 0 | 51 |
| Retirement Entity | 9 | * | 0 | 69 |
| Other* | 28 | 68 | 11 | 321 |
Note: Entities that trade solely with affiliated entities or the Federal Reserve are excluded. Data shows the number of unique legal counterparties. For FICC data confidentiality purposes, cells marked with a star indicate data points when there were fewer than five distinct parent-level entities for the counterparties included in a given category. When fewer than five parent-level entities were present, data was aggregated within the "Other" category. The "Other" category for Tri-Party also includes omnibus accounts which can operate on behalf of multiple funds within the same fund family. Data ends in November 2024.
Source: BNYM, OFR, author's calculations.
Table 2: Percent of Overnight Repo Volume by Counterparty Type since June 2022
| Counterparty Type | FICC-DvP | Tri-Party | ||
|---|---|---|---|---|
| Cash Borrower | Cash Lender | Cash Borrower | Cash Lender | |
| Domestic Dealer | 25% | 28% | 33% | 0% |
| Foreign Dealer | 16% | 12% | 16% | 0% |
| Domestic Bank | 19% | 20% | 1% | 0% |
| Foreign Bank | 18% | 15% | 47% | 0% |
| Domestic Government | 0% | 2% | 0% | 4% |
| Foreign Government | 3% | 0% | 0% | 0% |
| Hedge Fund | 16% | 3% | 0% | 0% |
| Money Market Fund | * | 15% | 0% | 48% |
| Other US-based Fund | 0% | 3% | 0% | 3% |
| Offshore Fund | 0% | 2% | 0% | 13% |
| Retirement Entity | 0% | * | 0% | 2% |
| Other* | 2% | 2% | 3% | 29% |
Note: Overnight repo volumes are limited to treasury-collateralized trades. Trades between affiliates and with the Federal Reserve are excluded. For FICC data confidentiality purposes, cells marked with a star indicate data points when there were fewer than five distinct parent-level entities for the counterparties included in a given category. When fewer than five parent-level entities were present, data was aggregated within the "Other" category. The "Other" category for Tri-Party also includes omnibus accounts which can operate on behalf of multiple funds within the same fund family. Data ends in November 2024. Percentages may not sum to 100 due to rounding.
Source: BNYM, OFR, author's calculations.
1. I thank David Bowman, Sebastian Infante, Joshua Louria, and Zeynep Senyuz for helpful comments and suggestions and Abhik Bhatt and Laura Boyle for research assistance. The views expressed in this note are solely those of the author and should not be interpreted as reflecting the views of the Board of Governors of the Federal Reserve System or of anyone else associated with the Federal Reserve System. Return to text
2. RRP-eligible MMFs have accounted for nearly all of the decline in the ON RRP facility since its peak. Return to text
3. MMFs in the text, henceforth, refer to RRP-eligible MMFs. For a list of RRP-eligible MMFs, and the dates of each fund's eligibility, please see https://www.newyorkfed.org/markets/rrp_counterparties. Return to text
4. Total increases listed here do not sum to decreases in ON RRP holdings as MMFs have other investment opportunities and can be impacted by changes in assets under management (AUM). However, changes in ON RRP, private repo, and Treasury bills have accounted for the vast majority of all changes in MMF holdings since April 2023. Return to text
5. Switching ON RRP holdings into Treasury bills, conversely, requires MMFs to consider a number of other factors, including their rate expectations as well as regulatory and risk-management factors. Most importantly, from a feasibility standpoint for this analysis, almost all of MMFs' repo transactions can be observed daily on a detailed basis, while MMFs' Treasury bill holdings can only be observed on month-ends. Return to text
6. TGCR, rather than the Secured Overnight Financing Rate (SOFR), is often a more representative rate for MMFs as SOFR is generally higher due to it including a broader range of market participants who borrow and lend at higher market rates. Return to text
7. Private repo, henceforth, will refer to overnight, Treasury-collateralized transactions in the FICC-DvP and Tri-Party repo segments, excluding trades with the Federal Reserve and affiliated entities. Return to text
8. The Tri-Party repo dataset from BNYM is collected by FRBNY under supervisory authority. The Tri-Party dataset also contains ON RRP transactions, which are conducted on the Tri-Party platform. Since the ON RRP facility is conducted via the Tri-Party platform, this note splits Tri-Party trades into private reverse repo and Federal Reserve reverse repo (ON RRP). FICC-DvP stands for repo from the Fixed Income Clearing Corporation's (FICC) Delivery vs. Payment (DvP) platform. All Tri-Party transactions are done on a general collateral basis, while FICC-DvP transactions use security-specific collateral. Return to text
9. This analysis does not include (1) uncleared bilateral repo and (2) Tri-Party repo conducted via an omnibus account. However, when compared to public, month-end MMF filings, our constructed data for overnight Treasury repo (private repo + ON RRP) captures over 90 percent of all MMF overnight Treasury repo volume since June 2022. Return to text
10. This method does not account for MMFs moving funds indirectly between ON RRP and private repo. For instance, if a MMF moved funds from ON RRP to Treasury bills on day t, and then on day t+1 moved those funds from Treasury bills into private repo, we would not capture the net reallocation. The cumulative effect of these potential indirect reallocations, however, appear to be limited. By applying the daily method outlined in this note to month-end N-MFP data and calculating month-end to month-end reallocations, I found that our cumulative day-to-day reallocations deviated only slightly over time (see black triangles in Figure 3). Return to text
11. Borrowing counterparties are not considered for the main methodology but are considered later in the note. Return to text
12. Volumes are aggregated daily by MMF-spread pairing since there can be multiple trades per MMF at the same rate spread. Return to text
13. The overall change in private repo is expected to be greater than private repo reallocation from the ON RRP facility due in increases in MMF AUM over this period. Return to text
14. Most reallocation into ON RRP at negative rate spreads was concentrated in the Tri-Party segment where relationships play a stronger role. Return to text
15. For more on relationships in the Tri-Party market, see Anbil & Senyuz (2022). For more detail on repo transactions by MMFs below the ON RRP rate, see Hempel et al. (2023). Return to text
16. September 2023 was the first month since the start of balance sheet runoff when the TGCR consistently printed at spreads equal to or greater than the ON RRP offering rate. Return to text
Bostrom, Erik (2025). "Insights from MMF Portfolio Allocations amid Balance Sheet Normalization," FEDS Notes. Washington: Board of Governors of the Federal Reserve System, March 03, 2025, https://doi.org/10.17016/2380-7172.3709.
Disclaimer: FEDS Notes are articles in which Board staff offer their own views and present analysis on a range of topics in economics and finance. These articles are shorter and less technically oriented than FEDS Working Papers and IFDP papers.