FEDS Notes
August 05, 2022
Insights from revised Form FR2004 into primary dealer securities financing and MBS activity
Sebastian Infante, Lubomir Petrasek, Zack Saravay, Mary Tian1
Executive Summary
The Primary Government Securities Dealers Reports (Form FR 2004) collect information at a weekly frequency on positions, cumulative transactions, financing, and fails of primary dealers in U.S. government and other fixed-income securities. The reports have been revised as of January 5, 2022 to increase the granularity of reporting. Among the most important additions, repo financing information in Form FR 2004C is now split by trading and clearing venue, including the relatively opaque bilateral uncleared market, with maturity classification applied to each venue. In addition, agency MBS positions and transactions in Forms FR2004A and B are now reported separately for To-Be-Announced (TBA) and specified pool (SP) classifications, and financing is split between residential and commercial MBS.
In this note, we provide a summary of these changes and discuss the insights gained into repo and MBS markets.2 We find that approximately 40 and 60 percent of aggregate primary dealer repo and reverse repo activity is in the uncleared bilateral segment, respectively. In this market, which is not captured by other data collections, dealers interact with non-dealer clients such as hedge funds, and repo transactions are typically based on specific issue collateral. On average, approximately 70 percent of dealers' aggregate borrowing or lending activity in this market segment is matched with aggregate lending or borrowing in the same market segment, indicating a balanced exposure to the uncleared bilateral repo market.
We also find that approximately 20 percent of all repo and 30 percent of reverse repo is centrally cleared via FICC. Dealers' participation in the centrally cleared bilateral repo market allows them to reduce their balance sheet allocation by approximately 20 percent relative to their total repo exposure. Moreover, sponsored repo volumes, where dealers sponsor non-dealer clients to participate in cleared repo, only account for about two percent of total repo and reverse repo volumes, despite greater balance sheet efficiency and reduction in capital usage for the sponsoring members. Most primary dealer repo transactions are based on specific issue collateral, which allows for counterparties to lend against and source specific securities.
Regarding the maturity of dealers securities financing transaction, most of dealer repo and reverse repo is overnight, with shorter maturities being typical in the tri-party segment, while longer maturities are common in the bilateral and general collateral financing (GCF) segments. Dealers engage in significant maturity transformation, as the maturity of their borrowing–mostly in tri-party repo–is significantly shorter than the maturity of their lending–mostly in bilateral repo.
Finally, the new report allows us to better understand dealers' intermediation activities in agency MBS markets. Specifically, we find that in general dealers hold long positions in SP MBS, and hedge them almost fully by selling TBA contracts; consistent with the idea that dealers hedge their short forward positions from the TBA market in the cash market by holding SP MBS directly.
Repo Market Segments and Clearing
The revised FR 2004C schedule requires dealers to report how much repo activity takes place in different repo market segments–specifically, the tri-party ex-GCF market, the GCF market, the cleared bilateral market, and the uncleared bilateral market.3 Because dealers have different economic motives to participate in each repo market segment, which involve different counterparties and clearing mechanisms, the ability to observe market activity in each segment gives us a better understanding of the drivers behind dealers' participation in repo markets. Specifically, the tri-party ex-GCF is a general collateral (GC) repo market that allows cash investors, such as money market funds, to lend to large creditworthy dealers.4 The GCF market is a GC interdealer repo market, where larger more creditworthy dealers typically lend to smaller ones. The cleared bilateral market is a blind-brokered specific issue (SI) repo market, centrally cleared by FICC, which allows clearing members (the majority of them securities dealers) to borrow and lend cash and specific securities to manage their financing and inventory needs.5,6 And finally, the uncleared bilateral market is a SI repo market that allows dealers to borrow and lend cash and securities from other investors that are not FICC clearing members, such as hedge funds. While other data collections cover the tri-party, GCF, and cleared bilateral market, the revised Form FR2004 provides us, for the first time, with a comprehensive view into the uncleared bilateral repo market.7,8
Figure 1 shows the breakdown of different market segments for all collateral classes. From the new data we can observe that a large fraction of primary dealers' repo (38 percent) and reverse repo (60 percent) activity is in the uncleared bilateral segment. It may appear surprising that the aggregate volume of uncleared bilateral repo is about the same size as the aggregate volume of the tri-party repo market, which is an important source of funds for large dealers to finance their securities holdings. Rather than being a net source of funding for dealers, the large volumes in the uncleared bilateral segment appear to support leveraged investors' activities, which involve taking both long and short levered positions in different Treasury securities, while financing the positions and sourcing the securities in repo and reverse repo, respectively. These activities can be of substantial size. Indeed, the left panel in Figure 3 shows that almost 70 percent of aggregate uncleared bilateral repo and reverse repo volumes are matched at the dealer level, as we would expect if these positions largely support clients' relative value trades.9,10
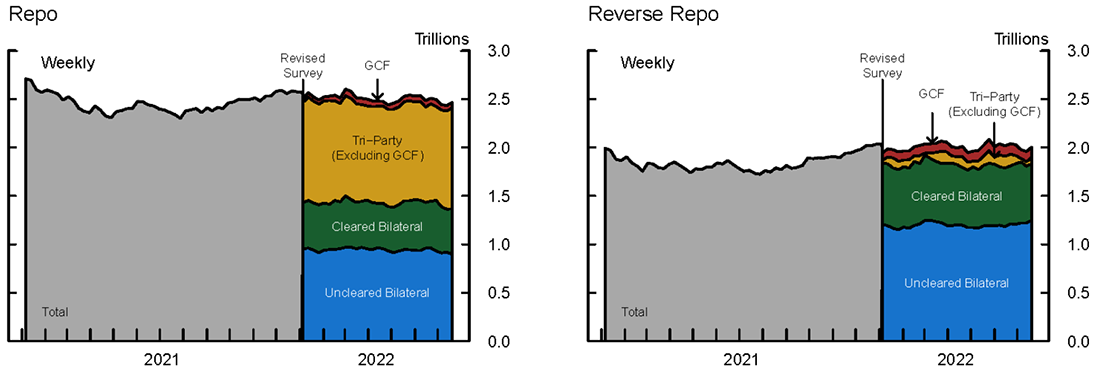
Source: Board of Governors of the Federal Reserve System, Government Securities Dealers Reports (FR 2004)
The revised FR2004C schedule also allows us to gain insight into the relative volumes of SI versus GC repo transactions. Since GC transactions allow cash borrowers the flexibility to post any collateral within a specific asset class, this market is typically used to raise funds. In the SI market, counterparties designate the specific securities used as collateral, allowing them to source specific securities. As seen in Figure 2, about half of primary dealer repo agreements and three-quarters of reverse repo agreements are based on SI repos. A further decomposition of repo collateral volume into uncleared versus cleared bilateral transactions shows that about two-thirds of SI repo and reverse repo are uncleared (shaded in light red), even though these transactions are potentially more balance sheet intensive. The substantial majority of GC repo transactions (about 85 percent) are from the tri-party repo market, while less than half of GC reverse repo transactions (about 40 percent) are in the tri-party repo market.
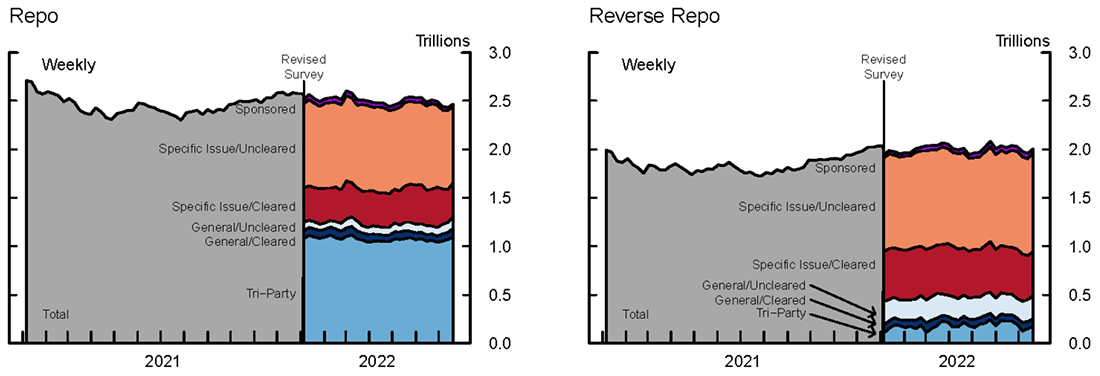
Source: Board of Governors of the Federal Reserve System, Government Securities Dealers Reports (FR 2004)
A final segment of the repo market is FICC's sponsored repo service, which allows sponsored members to submit bilateral repo transactions for clearing. Sponsoring members guarantee the performance of their non-member client's activity, while FICC acts as a central counterparty, matching and netting down transactions. Despite greater balance sheet efficiency and reduction in capital usage for sponsoring members, sponsored repo volumes only account for about two percent of total repo and reverse repo volumes (shaded in purple in Figure 2).11
The new disaggregation of the FR2004C also allows us to estimate the reduction in dealers' repo balance sheet size due to netting. The repo and reverse repo volumes on Form FR2004C are reported as gross volumes. However, accounting rules in the U.S. allow for repos and reverse repos, with the same maturity date and counterparty, to be reported net rather than gross. While the new FR2004C does not report dealers' counterparties, we can estimate a lower bound on the degree of netting by looking at volumes in the cleared bilateral market where all clearing members face FICC, thereby allowing dealers to net down all of their maturity-matched positions for accounting purposes. The right panel in Figure 3 shows dealer-level average ratio between the minimum of overnight repo and reverse repo in the cleared bilateral market over the total repo exposure without netting–effectively the average reduction in repo balance sheet allocation due to netting in the bilateral cleared market.12 The figure shows that, on average, dealers' participation in the cleared bilateral market reduces their balance sheet allocation to repo by almost 20 percent, highlighting the amount of balance sheet relief that comes from central clearing.
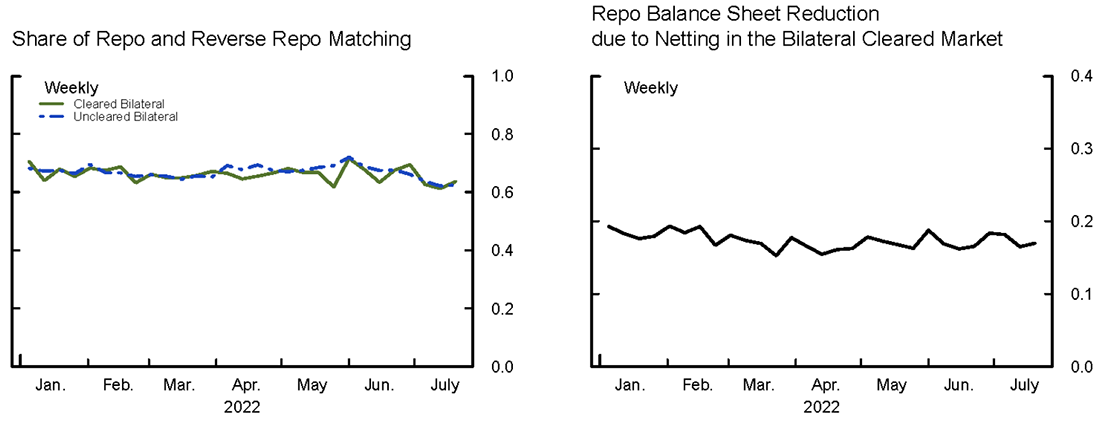
Note: The balance sheet reduction from participating in the DvP repo market (right panel) is calculated by taking the smaller volume between overnight cleared bilateral repo and reverse repo and dividing it by the sum of reverse repo.
Source: Board of Governors of the Federal Reserve System, Government Securities Dealers Reports (FR 2004)
Repo Collateral
Figure 4 shows the collateral types that are used in each of the repo market segments, including tri-party (top row), uncleared bilateral (middle row), and cleared bilateral repo (bottom row). Tri-party repo, which is an important net source of financing for dealers, is secured by a variety of collateral types, including Treasury securities (52 percent), GSE residential mortgage-backed securities (29 percent), equities (7 percent) and corporate bonds (6 percent). In contrast, cleared and uncleared bilateral repo is almost entirely supported by Treasury collateral, including TIPS. In the uncleared bilateral reverse repo segment, dealers provide financing largely for nominal Treasury securities (74 percent) and TIPS (13 percent). Smaller amounts of uncleared bilateral reverse repo finance GSE RMBS (9 percent) and corporate bonds (2 percent).
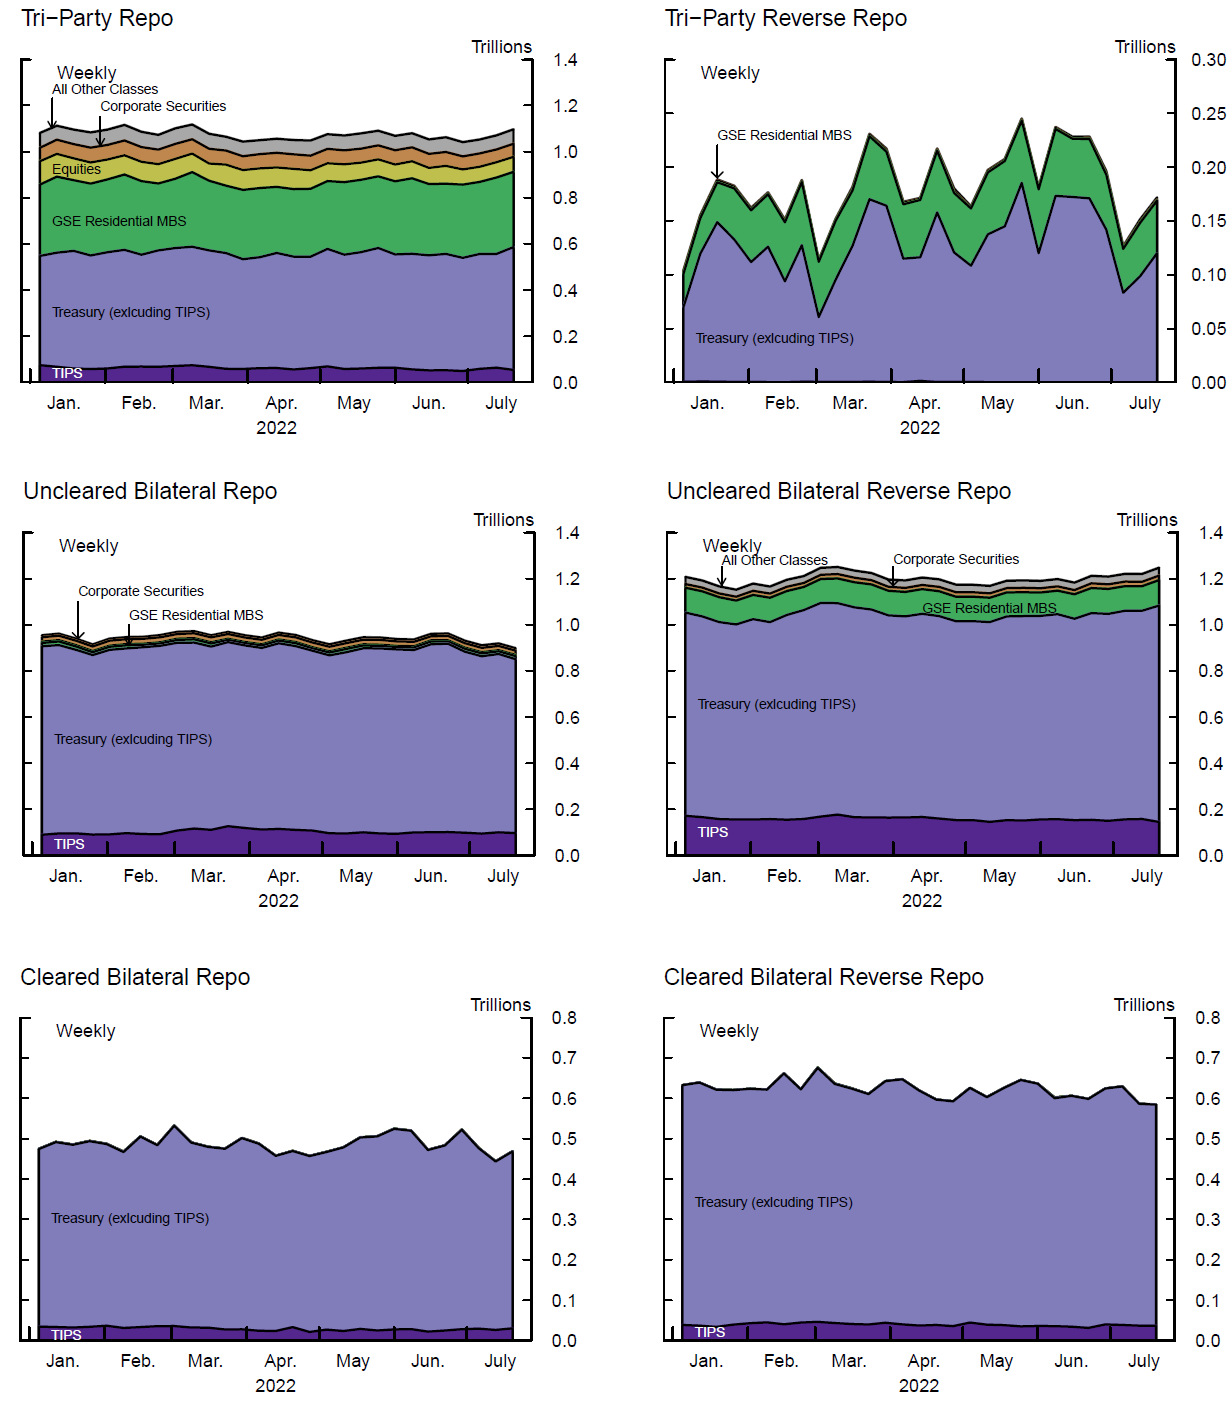
Note: All other classes include asset-backed securities, GSE commercial MBS, GSE non-MBS, and other MBS.
Source: Board of Governors of the Federal Reserve System, Government Securities Dealers Reports (FR 2004)
The top row of charts in Figure 5 shows repo market volumes for Treasury collateral. Total Treasury repo is about $2.0 trillion, accounting for nearly 80 percent of repo market volumes, with the majority of transactions based on SI collateral. Treasury collateral repo accounts for nearly all of the volumes in each of the repo market segments shown in Figure 1, with the exception of the tri-party market. These volumes suggest that while the tri-party market seems to be an important source of funds for dealers to finance their securities holdings across collateral classes, the remaining repo market segments are dominated by U.S. Treasury collateral, and to a less extent Agency MBS collateral. As can be seen in the middle and lower rows of charts in Figure 5, dealers mostly fund agency MBS and other securities (largely corporate bonds) in tri-party repo, while they typically provide financing for those securities in the uncleared bilateral market. Some MBS financing also takes place in GCF reverse repo.
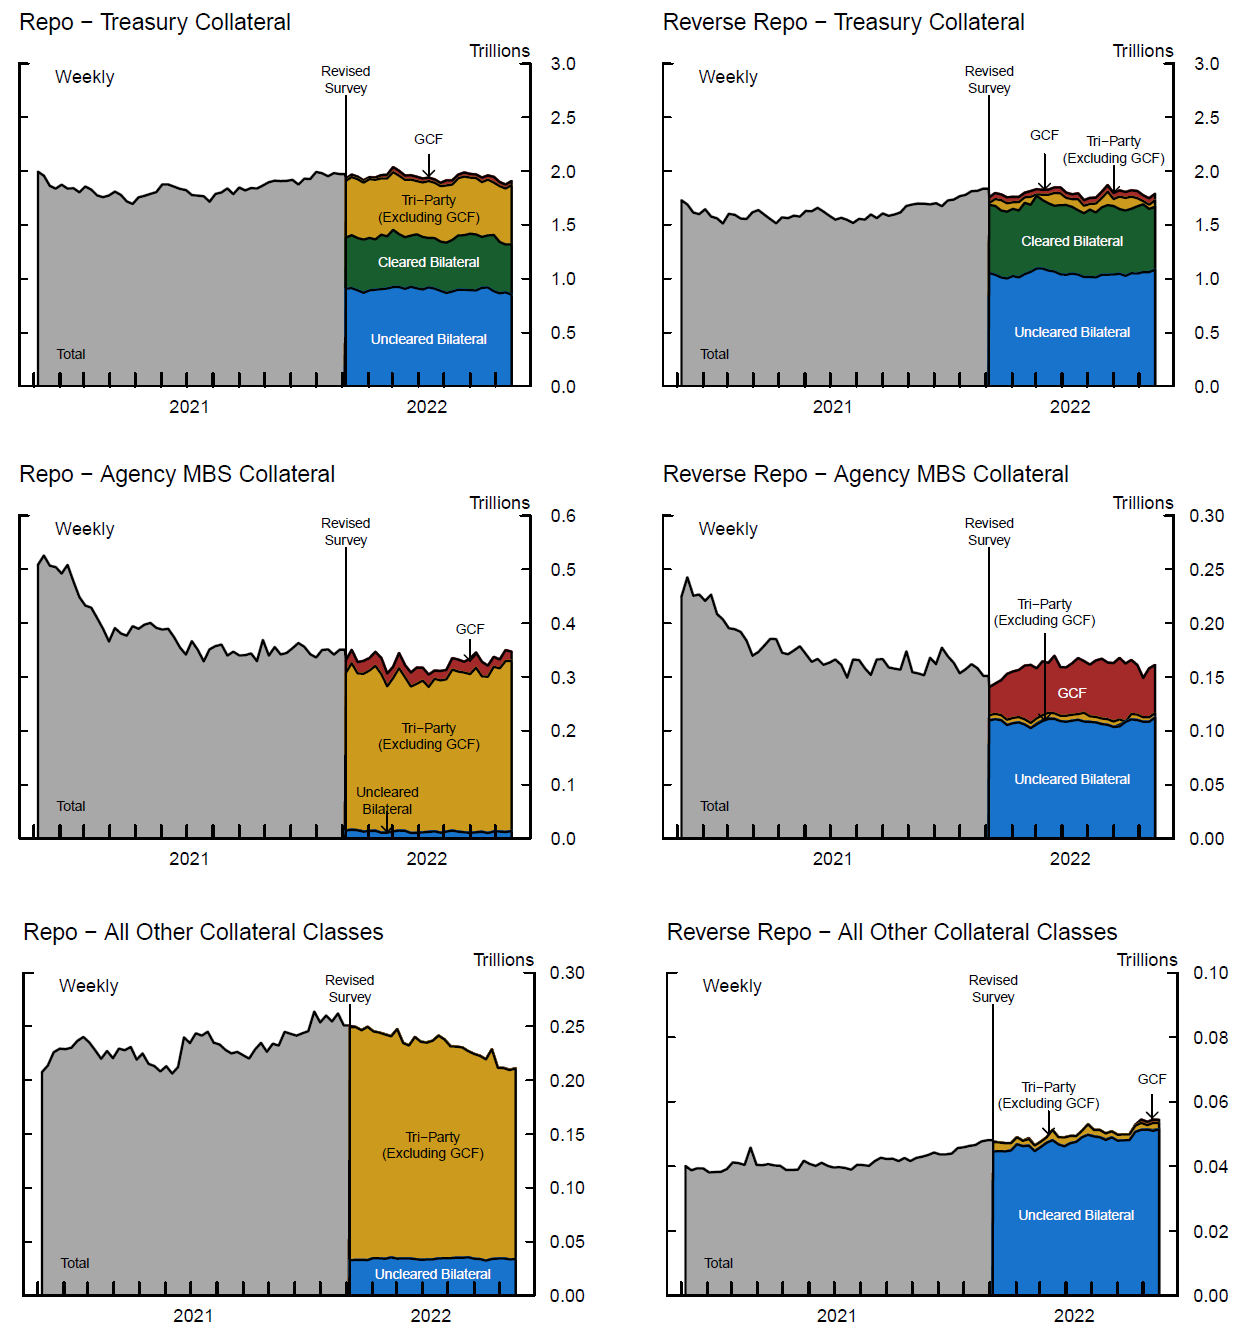
Source: Board of Governors of the Federal Reserve System, Government Securities Dealers Reports (FR 2004)
Repo Maturity and Maturity Transformation
Figure 6 shows the maturities of dealer repo and reverse repo. About three-quarters of dealer repo and one-half of dealer reverse repo is overnight, with most of the rest maturing within 30 days. As shown in Figure 7, the average weighted maturity of dealer repo is 13 days.13 There is, however, a significant variation in maturity by market segment. For example, the average maturity of tri-party repo is 11 days, while the average maturity GCF repo is close to 30 days.14 Similar maturity differences across market segments exist for reverse repo and the subset of transactions collateralized by Treasuries.
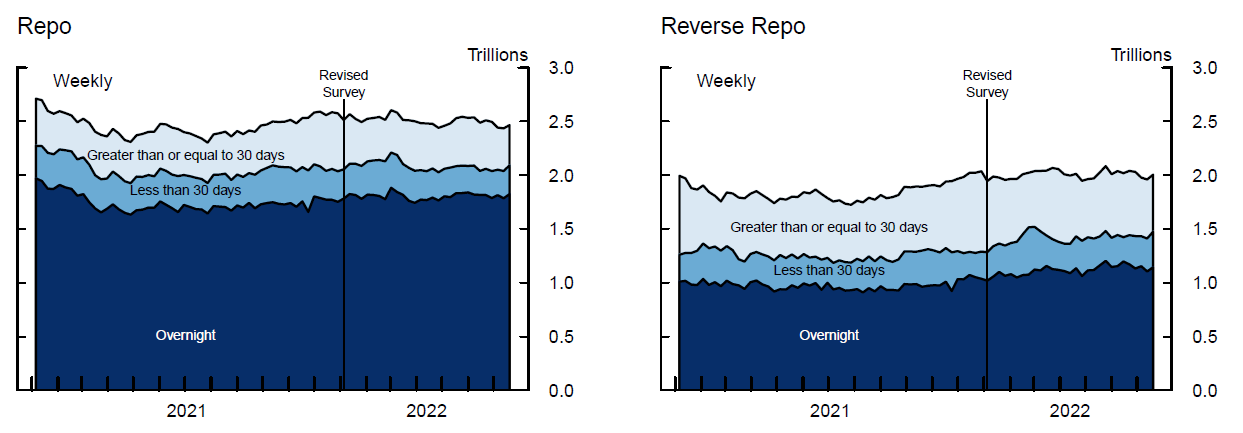
Source: Board of Governors of the Federal Reserve System, Government Securities Dealers Reports (FR 2004)
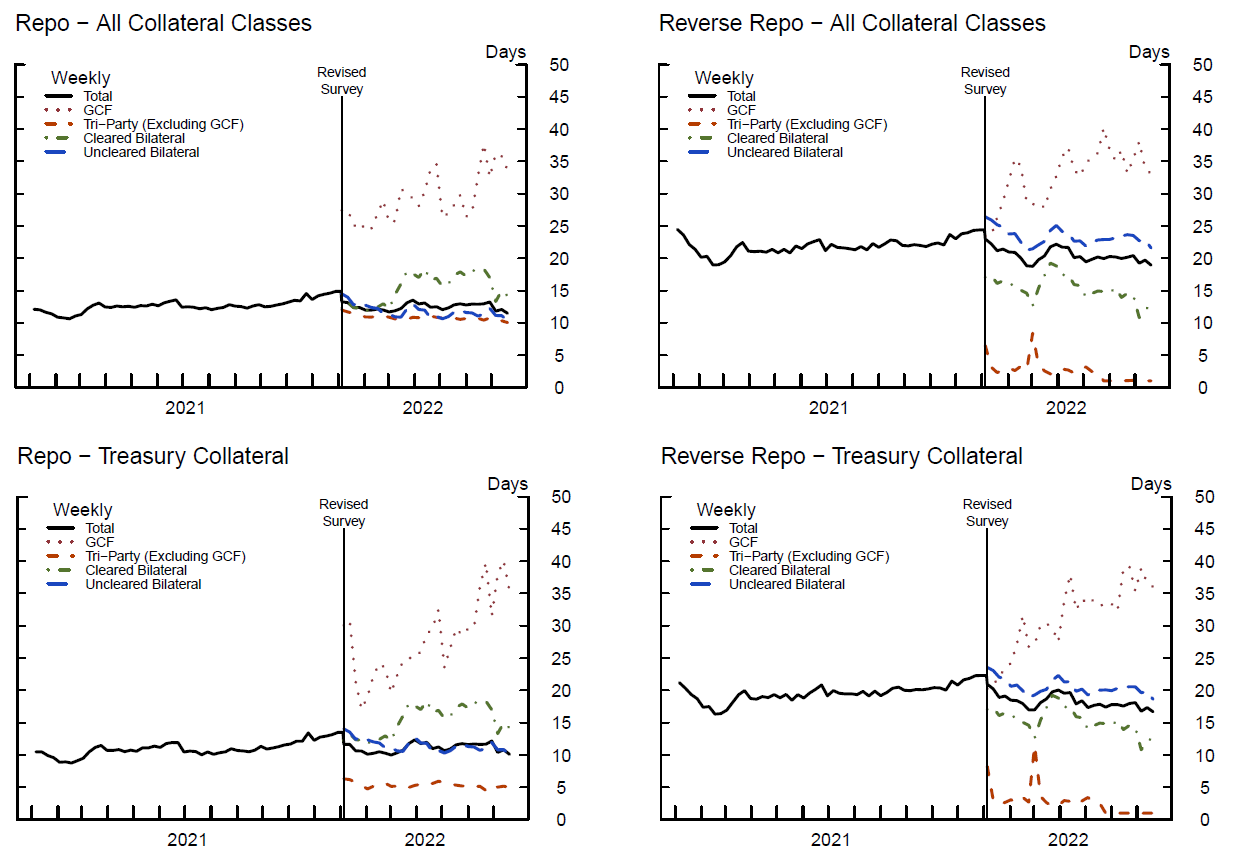
Note: The average maturity is calculated using the volume-weighted average over the midpoint of maturity buckets: One (1) day for overnight, 15 days for less than 30 days, and 60 days for greater than or equal to 30 days.
Source: Board of Governors of the Federal Reserve System, Government Securities Dealers Reports (FR 2004)
Figure 7 also demonstrates that dealers engage in significant maturity transformation. Specifically, the weighted average maturity of dealer borrowing through repo (13 days on average) is significantly shorter than the maturity of dealer lending through reverse repo (21 days on average). The new data allow us to better understand the mechanics of the maturity transformation. First, the maturity of dealer borrowing through tri-party repo, which is an important net source of financing for most large dealers (see Figure 1) is shorter (11 days on average) than the maturity of their net lending, which is conducted through uncleared bilateral (23 days), cleared bilateral (16 days), and GCF market segments (32 days). In addition, significant maturity transformation occurs in the uncleared bilateral segment itself, as the average maturity of bilateral uncleared repo (12 days on average) is significantly shorter than that of reverse repo (23 days on average). This suggests that uncleared bilateral repo markets play an important role in allowing dealers to meet clients' demands for longer-term financing.
Increased Granularity of MBS Positions and Transactions
The revised FR2004 report includes more granular data on dealers' agency MBS positions, transactions, and financing. In Form FR2004A, dealers now report positions separately for TBA and SP agency RMBS securities.15 Dealers hold significant short positions in TBA agency MBS, with smaller long positions, while their SP positions are almost entirely long (left panel in Figure 8). Overall, dealers' net position in SP agency MBS is long about $200 billion, while they hold similarly sized short positions in TBA securities (right panel in Figure 8). This is consistent with research that has shown dealers use TBA trades to hedge SP positions.
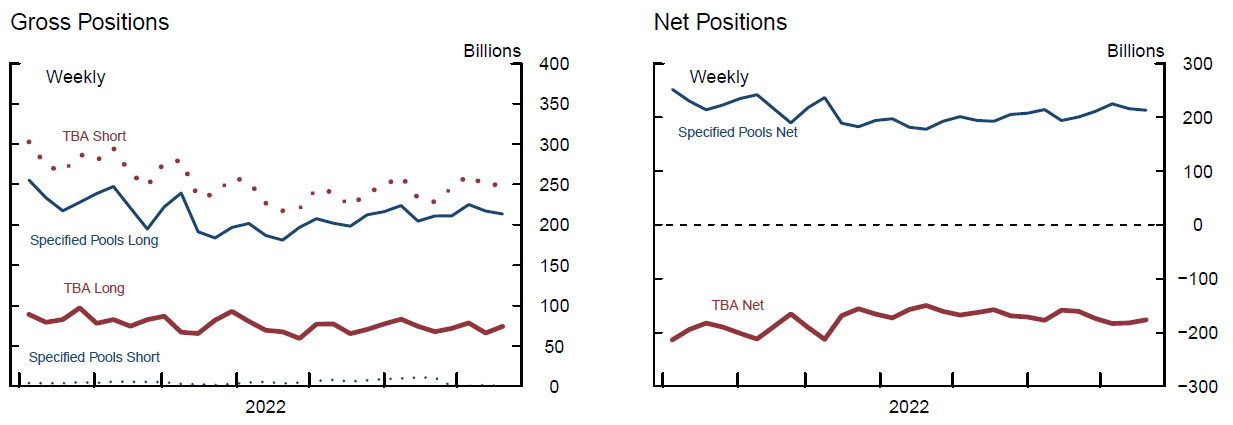
Source: Board of Governors of the Federal Reserve System, Government Securities Dealers Reports (FR 2004)
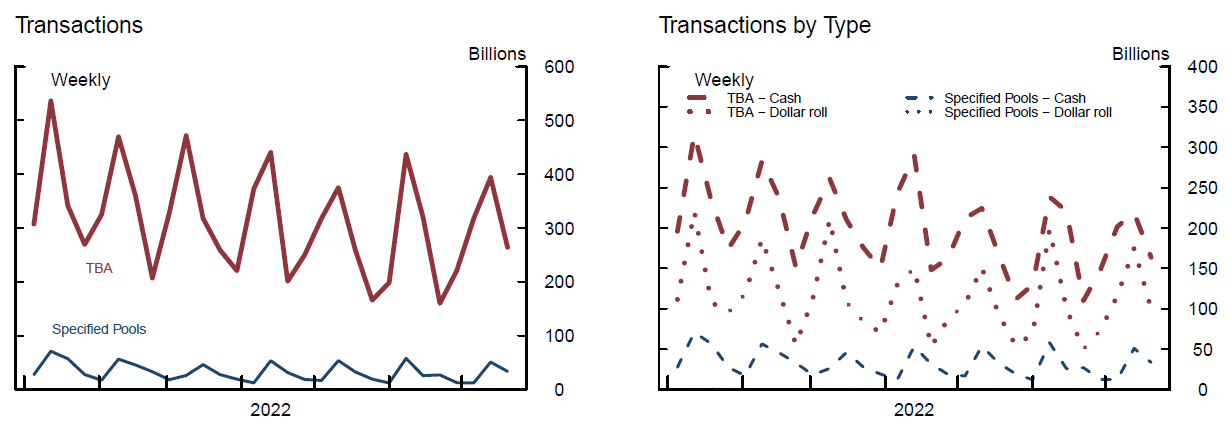
Dealers' agency RMBS transactions are also now reported separately for TBA and SP securities in the revised Form FR2004B. TBA transaction volumes ranged between about $200 and $500 billion in 2022, with spikes on reporting dates around the middle of the month (left panel in Figure 9). The spikes, which are roughly double the volume of the lowest days, precede settlement days in the TBA market.16 SP transaction volumes are significantly lower, ranging between about $10 and $70 billion, and exhibit a similar pattern of spiking in the middle of the month. While SP securities can be traded at any time of the month, research has shown that SP trading costs are lower when TBA trading volumes are high.17 Dealers also report transaction volumes separately for cash transactions and dollar roll transactions.18 The data show that for TBA RMBS, roughly two-thirds of trading volumes are cash transactions, while the rest are dollar rolls (right panel in Figure 9). Both cash and dollar roll transactions exhibit the pattern of spiking ahead of settlement dates. SP trading, by definition, can only be conducted through cash transactions.
Source: Board of Governors of the Federal Reserve System, Government Securities Dealers Reports (FR 2004)
The new FR2004C data requires dealers to report secured borrowing and financing for agency CMBS and RMBS separately. Most of the secured borrowing and financing is done with RMBS, with only a minimal amount backed by CMBS (left panel in Figure 10). Dealers' net borrowing of MBS has been around $200 billion this year, meaning their secured borrowing is $200 billion greater than their secured lending (right panel in Figure 10). This is likely because dealers are borrowing against their holdings of SP MBS – the long position in these securities matches almost exactly the amount of net borrowing.
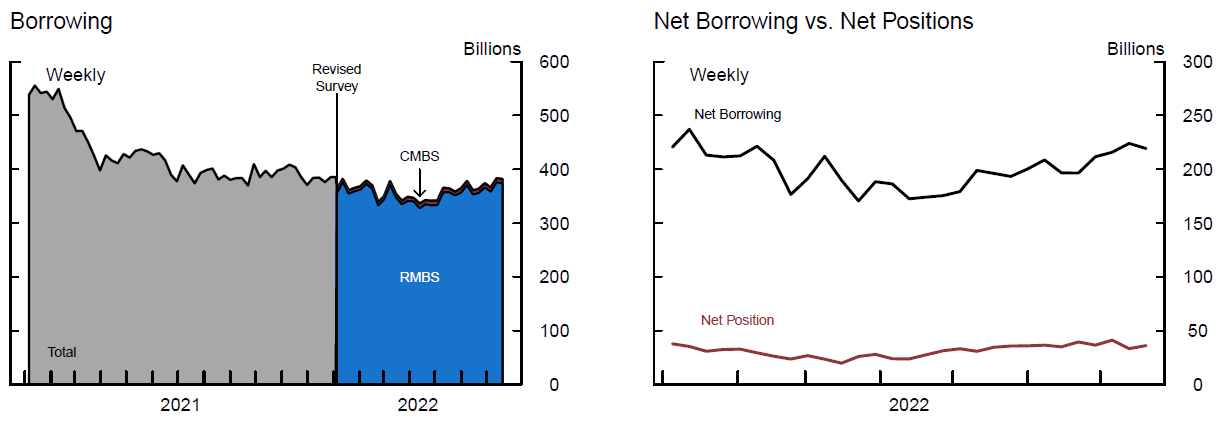
Note: Total is the sum of MBS securities out. CMBS is GSE Commercial MBS and RMBS is GSE Residential MBS. CMBS and RMBS are the sums of securities lent and repo. MBS is the sum of GSE Commercial MBS (CMBS) and GSE Residential MBS (RMBS).
Source: Board of Governors of the Federal Reserve System, Government Securities Dealers Reports (FR 2004)
References
Baklanova, Caglio, Cipriani & Copeland (2019). "The use of collateral in bilateral repurchase and securities lending agreements." Review of Economic Dynamics, 33, 228-249.
Gao, Schultz, & Song (2017). "Liquidity in a market for unique assets: Specified pool and to-be-announced trading in the mortgage-backed securities market." Journal of Finance 72:1119–70
Huh & Infante (2021). "Bond market intermediation and the role of repo." Journal of Banking & Finance, 122, 105999.
1. We thank Lia Chabot for her research assistance. Return to text
2. Additional changes not specifically discussed here include: (1) Adding data fields for the new 20-year Treasury bond; (2) Separate reporting of transactions and fails for Uniform MBS (UMBS) and non-UMBS eligible securities; (3) Modifying the instructions to provide additional guidance on consolidation rules for primary dealers. Return to text
3. The GCF Repo market is a subset of the tri-party repo market. Respondents are asked to report their activity separately in the GCF and tri-party ex-GCF market. Return to text
4. GC repos give the cash borrower the option to choose a security within a collateral class, therefore, the economic motive to engage in them is to borrow and lend funds. Return to text
5. SI repos earmark a specific security to be used as collateral, therefore, the economic motive to engage in them can be either to borrow and lend funds or to borrow and lend a specific security. Return to text
6. For example, the list of FICC clearing members for government securities can be found in https://www.dtcc.com/-/media/Files/Downloads/client-center/FICC/Mem-GOV-by-name.xlsx Return to text
7. The Federal Reserve Bank of New York collects transaction-level data on tri-party and GCF repo, and the DTCC collects information on cleared bilateral repo. The bilateral uncleared market was previously only covered by periodic surveys of buy-side and sell-side market participants. Return to text
8. Baklanova et. al (2019) provides aggregate statistics for the bilateral market using survey responses of nine dealers that participated in a pilot program that to collect comprehensive repo data on three specific days in 2015. That analysis did not differentiate between the cleared and uncleared segments of the market. Return to text
9. Specifically, the dealer average ratio between the minimum repo and reverse repo over the maximum repo and reverse repo in the bilateral uncleared market is approximately 70 percent. Return to text
10. Matched volumes in the uncleared bilateral segments are consistent with the theoretical framework of Huh and Infante (2021) who assume that dealer clients engage in both leveraged long or short positions in the dealer to client bilateral repo market. Return to text
11. In September 2021, FICC launched a new sponsored GC repo service, which allows sponsoring members to transact repo trades with their sponsored members on a GC basis on the tri-party platform. Return to text
12. This calculation is likely a lower bound on the total amount of netting. For example, the matched repo and reverse repo volumes in the uncleared bilateral repo market suggest there is a fair amount of netting in that market; however, without counterparty information we cannot determine how much netting occurs in that market. Return to text
13. The average maturity is calculated using the volume-weighted average over the approximate midpoint of each maturity bucket: 1 day for overnight, 15 days for less than 30 days, and 60 days for greater than 30 days maturity. Return to text
14. GCF repos are important to dealers borrowing on a term basis, because the daily reversal process allows dealers to access their collateral, which may be needed to settle unrelated sales. Return to text
15. To-be-announced (TBA) refers to forward-settling trades where the seller does not specify which exact securities will be delivered upon settlement, but agrees on basic characteristics of the securities, such as the issuer, coupon rate, and price. The TBA market is the largest and most liquid agency MBS market. SP refers to trades where the exact identity of the securities in the pool is known at the time of the trade. Many SP securities trade at a premium to TBA securities because they are backed by mortgages with more favorable prepayment characteristics. Return to text
16. The Securities Industry and Financial Markets Association (SIFMA) sets one settlement date each month for TBA with a given issuer and maturity. In the days preceding the settlement date, many traders roll over their positions rather than receiving or delivering the securities. Return to text
17. See Gao, Shultz, and Song, (2017). Return to text
18. A dollar roll is when one TBA trade is simultaneously offset by another TBA trade settling on a later date. For example, an investor could sell a TBA contract that is closest to settlement and then buy a contract with the same characteristics that settles in a future month. Dollar rolls have two key differences from repo: 1.) The second leg of a dollar roll does not require the return of the original security, only a "substantially similar security"; 2.) Dollar rolls transfer the right to principal and interest payments from the underlying securities. Return to text
Infante, Sebastian, Lubomir Petrasek, Zack Saravay, and Mary Tian (2022). "Insights from revised Form FR2004 into primary dealer securities financing and MBS activity," FEDS Notes. Washington: Board of Governors of the Federal Reserve System, August 5, 2022, https://doi.org/10.17016/2380-7172.3182.
Disclaimer: FEDS Notes are articles in which Board staff offer their own views and present analysis on a range of topics in economics and finance. These articles are shorter and less technically oriented than FEDS Working Papers and IFDP papers.