


FEDS Notes
October 16, 2026
Introducing Private Credit into the Financial Accounts of the United States
Katie Brinkman, Christine Dobridge, Tim Dore, Simon Glossner, Elizabeth Holmquist, Nam Nguyen, Maria Perozek, and Irina Stefanescu1
Section 1: Introduction
Over the past decade, private credit has played an increasingly important role in providing funding to middle-market businesses. While there are several definitions of private credit, here we define it as privately negotiated loans to businesses that are originated by nonbank investment funds rather than by traditional financial intermediaries such as banks.
Until now, private credit loans and the financial vehicles that originate them have not been separately identified in the Financial Accounts of the United States, largely due to the private nature of these transactions and limited available data. We now address this gap using confidential SEC Form PF data along with other data sources to compile balance sheets for private debt funds and other private credit vehicles.
Beginning with the September 2026 release, we have integrated private credit into the Financial Accounts by adding new sectors for private credit vehicles and new financial instrument tables for private credit loans and shares of private debt funds.2 Integrating private credit into the comprehensive Financial Accounts framework—rather than producing standalone tables—helps users to trace the full intermediation chain from investors through private credit vehicles to borrowers, facilitating analysis of its effects on business leverage and financial stability.
This note explains how we have incorporated private credit into the Financial Accounts and discusses implications for key balance sheet measures for businesses and households. Section 2 provides a brief overview of the U.S. private credit market. Section 3 reviews the previous treatment of private credit in the Financial Accounts. Section 4 describes the integration approach, including data sources and methodology for each private credit vehicle and new financial instrument. Section 5 discusses implications for nonfinancial business leverage and household net worth. Section 6 concludes.
Section 2: Background
The private credit market has grown rapidly over the past decade. As shown in Figure 1, assets under management in private credit vehicles have grown from approximately $350 billion in 2012 to over $2.6 trillion as of 2025:Q4, with outstanding private credit loans to U.S. businesses totaling approximately $1.5 trillion.
Figure 1. Assets of Private Credit Vehicles and Private Credit Loans to U.S. Borrowers3
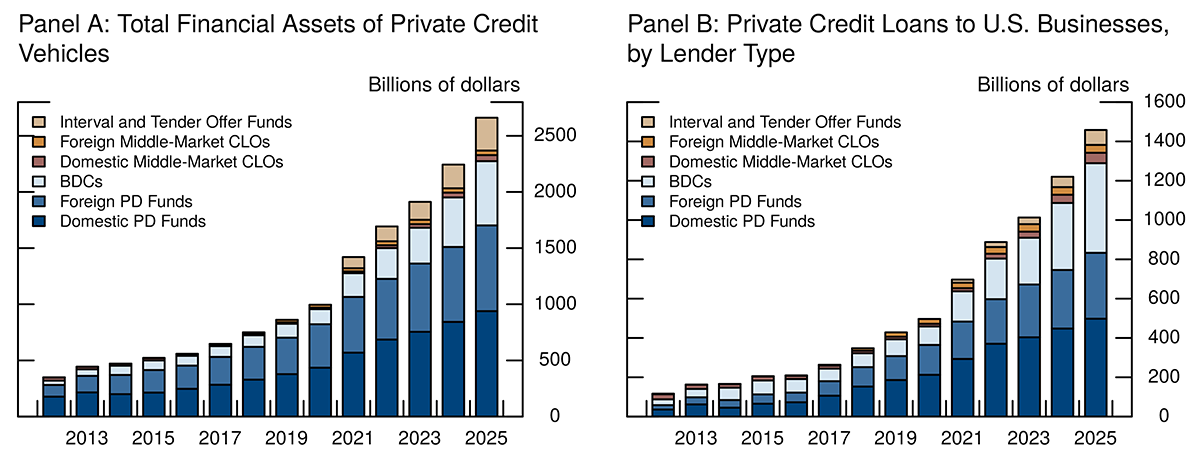
Note: Data as of Q4 each year. The key identifies bars in order from top to bottom.
Source: Financial Accounts of the United States, SEC Form PF.
Private credit is primarily provided through private debt (PD) funds and business development companies (BDCs), though private credit provided through middle-market collateralized loan obligations (MM CLOs) and interval and tender offer funds has also grown substantially in recent years.4 Most borrowers are middle-market nonfinancial firms seeking funding for acquisitions, growth capital, or refinancing. Given the scale and growth of private credit, its integration into the Financial Accounts is essential for comprehensive measurement of credit flows to nonfinancial businesses and for understanding the role of private credit in the financial system.
Section 3: Previous Treatment in the Financial Accounts
Prior to the September 2026 release, most private credit loans from domestically domiciled private credit vehicles were included as liabilities on nonfinancial corporate business balance sheets but were not identified as debt instruments, and the intermediation activities of private credit vehicles were largely excluded from the Financial Accounts. This section describes the previous treatment of private credit and explains why integrating these vehicles has effects that extend beyond the private credit sectors themselves.
The previous treatment of private credit vehicles in the Financial Accounts varied depending on whether the originating vehicle was domiciled in the United States or abroad. We already captured foreign private funds lending to U.S. businesses in the Rest of the World (ROW) sector. Therefore, we only added U.S.-based private credit vehicles as new sectors in the Financial Accounts to complete the picture.
U.S.-domiciled private credit vehicles
U.S.-domiciled private credit vehicles were not identified as separate sectors in the Financial Accounts. As a result, their balance sheet assets and liabilities were either missing entirely or incorrectly attributed to other sectors.
For the most part, loans originated by U.S.-domiciled private credit vehicles were not recorded as loan assets of a financial sector, however, the corresponding loan liabilities of U.S. businesses, were not entirely absent.5 Private credit loans to nonfinancial corporate businesses were generally recorded as miscellaneous liabilities, while loans to noncorporate businesses were generally classified as depository institution loans. As a result, the previous treatment obscured the composition of business borrowing and understated measures of nonfinancial business debt captured by the Financial Accounts' debt instruments.
Depository institution loans issued to U.S.-domiciled private credit vehicles were incorrectly attributed to foreign nondepository financial institutions. In addition, debt securities issued by business development companies (BDCs) and U.S.-domiciled MM CLOs were not previously recorded and therefore represent additions to financial sector debt outstanding in the Financial Accounts.
Similarly, equity shares issued by U.S.-domiciled private debt funds, closely held BDCs, interval funds, and tender offer funds were previously omitted from the Financial Accounts. Equity issued by publicly listed BDCs, by contrast, was already included in corporate equity issues but was attributed to the other financial business sector.
Because the Financial Accounts comprise an integrated set of sectoral balance sheets, the omission of U.S.-domiciled private credit vehicles also affected the measurement of assets and liabilities in other sectors. These effects are particularly important for the household sector, for which many asset holdings are calculated residually.6 For example, when private credit vehicles hold instruments that are also held directly by households—such as checkable deposits and corporate equities—the absence of private credit vehicles from the accounts caused some of these assets to be residually attributed to households, thereby overstating measured household assets and net worth. Conversely, household net worth was understated by the omission of directly held equity shares in private debt funds, closely held BDCs, interval funds, and tender offer funds. Incorporating private credit vehicles therefore both reallocates existing financial assets and liabilities across sectors and introduces instruments that were previously absent from the Financial Accounts.
Foreign-domiciled private credit vehicles
Foreign-domiciled private debt funds and middle-market CLOs have not been introduced as separate sectors in the Financial Accounts because their transactions and positions with U.S. residents were already captured in the ROW sector. In particular, private credit loans extended by foreign-domiciled vehicles to U.S. businesses were recorded as foreign loans to U.S. corporate businesses within the "other loans and advances" instrument category but are now separately identified. Similarly, U.S. financial assets held by foreign private credit vehicles are recorded as ROW assets, with holdings of private debt fund shares now separately identified. Private credit loans extended to foreign businesses by domestic private credit vehicles are a new addition to rest of the world loan liabilities. Equity issued by foreign private credit vehicles and held by U.S. residents is included among U.S. holdings of foreign corporate equities, with private debt fund shares now shown separately.
Section 4: Integration of Private Credit into the Financial Accounts
This section describes how we integrate private credit into the Financial Accounts framework. We begin with an overall summary of the private credit market followed by a description of each new sector and financial instrument added to the accounts.
4.1 Summary of Private Credit Market
Table 1 provides a snapshot of balance sheet assets and liabilities for all vehicles that make up the U.S. private credit market. As of the end of 2025, U.S.-domiciled private credit vehicles had assets under management of $1.9 trillion. At the same time, there were $1.5 trillion in private credit loans extended to U.S. businesses, including $335 billion from foreign-domiciled funds. Private debt funds and BDCs have the largest shares of the market, with each holding just under half of total private credit loans outstanding. These private credit vehicles also hold substantial amounts of corporate equity in their portfolios, including equity stakes taken in connection with lending arrangements.
Table 1: Balance Sheets of Private Credit Vehicles with a U.S. Footprint, as of 2025:Q4
| U.S.-Domiciled | Foreign (ROW Sector) | |||||||
|---|---|---|---|---|---|---|---|---|
| U.S.-Domiciled PD Funds | BDCs | Interval and Tender Offer Funds | U.S.-Domiciled CLOs | Domestic Subtotal | Foreign PD Funds | Foreign CLOs | Total | |
| Total financial assets | 939 | 572 | 292 | 54 | 1,857 | 763 | 41 | 2,661 |
|
Checkable deposits and currency |
38 | 14 | 6 | 58 | 32 | 90 | ||
|
Debt securities |
118 | 41 | 159 | 84 | 243 | |||
|
Loans |
532 | 499 | 84 | 54 | 1,169 | 418 | 41 | 1,628 |
|
Private credit loans to the U.S. |
498 | 456 | 76 | 53 | 1,083 | 335 | 40 | 1,458 |
|
Private credit loans to the rest of the world |
34 | 1 | 35 | 83 | 1 | 119 | ||
|
Other loans and advances (syndicated loans) |
43 | 8 | 51 | 51 | ||||
|
Corporate equities |
173 | 42 | 129 | 344 | 168 | 512 | ||
|
Money market fund shares |
7 | 10 | 18 | 5 | 23 | |||
|
Miscellaneous assets |
70 | 17 | 23 | 109 | 56 | 165 | ||
| Total liabilities and equity | 939 | 572 | 292 | 54 | 1,857 | 763 | 41 | 2,661 |
|
Total liabilities |
397 | 286 | 56 | 54 | 792 | 227 | 41 | 1,060 |
|
Loans |
234 | 181 | 21 | 436 | 156 | 592 | ||
|
Depository institution loans n.e.c. |
150 | 181 | 18 | 349 | 73 | 422 | ||
|
Other loans and advances |
84 | 84 | 83 | 167 | ||||
|
Security repurchase agreements |
3 | 3 | 3 | |||||
|
Debt securities (corporate bonds) |
82 | 54 | 135 | 41 | 176 | |||
|
Miscellaneous liabilities |
163 | 23 | 35 | 221 | 71 | 292 | ||
| Total equity and shares | 541 | 287 | 237 | 1,065 | 537 | 1,602 | ||
Note: Values in billions of dollars. Components may not add to total due to rounding.
Source: Financial Accounts of the United States, SEC Form PF.
U.S. private credit vehicles are primarily funded through equity issuance ($1.1 trillion), although they also access funding though bank loans ($349 billion), and debt securities ($135 billion). Foreign-domiciled private debt funds also provide a substantial share of credit in the market. We estimate that the portfolios and capital structures of these foreign funds are similar to those of U.S.-domiciled private debt funds.
As noted in Section 3, we have added U.S.-domiciled private credit vehicles to the Financial Accounts. The following subsections describe each new sector and the associated financial instruments.
4.2 New Financial Sectors
Private debt funds: tables S.124.8.t and S124.8.s
Private debt funds are privately offered, closed-end investment vehicles that are typically organized as limited partnerships and managed by an affiliated investment adviser. These funds are "private funds" and thus exempted from the regulations of the 1940 Investment Act. PD funds cover different private credit strategies with various mandates and risk profiles, including direct lending, mezzanine and junior capital, distressed and special situations, asset-based and specialty finance, private real estate debt, and infrastructure debt. Capital is raised through commitments from qualified investors—such as pension funds and insurance companies—and drawn over time through capital calls to fund loan originations and acquisitions. Investors do not typically have the right to redeem fund shares before the termination of the fund.
Our primary data source for private debt funds is confidential SEC Form PF, which provides detailed balance sheet information for private funds. These Form PF data translate well into the Financial Accounts structure, as funds report levels of assets and liabilities, which we use for the balance sheet table, as well as holders of private fund shares, which we use for the instrument table.7
However, there are some measurement challenges associated with compiling these balance sheets. First, PD funds are not explicitly identified in Form PF data, so to classify funds as private debt funds, we use signals from fund strategies, fund names, and classifications that are provided in other databases, including Preqin, PitchBook, and Moody's. We merge Form PF data with fund-level information from these sources to construct comprehensive sector-level balance sheets.
Second, not all funds file Form PF on a quarterly basis; some file only annually and provide more limited information. For funds that file quarterly, we are able to estimate quarterly balance sheets. For funds that file only annually, we impute annual balance sheet data using portfolio shares from quarterly filers with similar investment strategies, then interpolate quarterly values between the annual estimates.8
The Z.1 includes data on transactions and stocks for U.S. private debt funds in tables S.124.8.t and S.124.8.s (see Table 2). U.S-domiciled private debt fund AUM have grown over time, from $180 billion in 2012 to about $940 billion as of 2025:Q4.9 Private credit loans account for about 60 percent of assets, and corporate equities account for about 18 percent.10
Table 2: Private Debt Funds Sector Balance Sheet
S124.8.s Private debt funds1
Billions of dollars; amounts outstanding end of period, not seasonally adjusted
| 2023 | 2024 | 2025 | 2025:Q2 | 2025:Q3 | 2025:Q4 | |||
|---|---|---|---|---|---|---|---|---|
| 1 | FL444090000 | Financial assets | 754.6 | 842.5 | 938.7 | 863.1 | 874.2 | 938.7 |
| 2 | FL443020003 |
Checkable deposits and currency |
29.7 | 34.9 | 38.5 | 32.7 | 35.8 | 38.5 |
| 3 | FL443063000 |
Debt securities (corporate and foreign bonds) |
122.7 | 111.1 | 118.2 | 110.4 | 108.9 | 118.2 |
| 4 | FL443067205 |
Loans (private credit loans) |
432.5 | 480.6 | 532.2 | 497.4 | 500.8 | 532.2 |
| 5 | FL443067200 |
Private credit loans to domestic business |
403.2 | 448.2 | 497.9 | 464.5 | 468.0 | 497.9 |
| 6 | FL263167240 |
Private credit loans to rest of the world |
29.2 | 32.4 | 34.2 | 32.9 | 32.8 | 34.2 |
| 7 | LM443064100 |
Corporate equities |
128.2 | 149.7 | 172.8 | 155.9 | 164.3 | 172.8 |
| 8 | FL443034003 |
Money market fund shares |
5.3 | 6.8 | 7.2 | 6.1 | 5.9 | 7.2 |
| 9 | FL443093005 |
Miscellaneous assets |
36.1 | 59.4 | 69.9 | 60.7 | 58.6 | 69.9 |
| 10 | FL444194005 | Liabilities and shares | 754.6 | 842.5 | 938.7 | 863.1 | 874.2 | 938.7 |
| 11 | FL444190005 |
Total liabilities |
302.4 | 337.2 | 397.5 | 342.8 | 357.0 | 397.5 |
| 12 | FL444141005 |
Loans |
201.1 | 211.1 | 234.1 | 207.7 | 219.3 | 234.1 |
| 13 | FL443168000 |
Depository loans n.e.c. |
132.0 | 132.5 | 150.3 | 135.4 | 143.3 | 150.3 |
| 14 | FL443169005 |
Other loans and advances |
69.1 | 78.6 | 83.8 | 72.3 | 76.0 | 83.8 |
| 15 | FL443193005 |
Miscellaneous liabilities |
101.2 | 126.1 | 163.4 | 135.1 | 137.7 | 163.4 |
| 16 | LM443164500 |
Total shares outstanding |
452.2 | 505.2 | 541.3 | 520.3 | 517.2 | 541.3 |
|
Memo: |
||||||||
| 17 | LM443067215 |
Fair value of private credit loans |
426.4 | 474.4 | 527.5 | 493.6 | 496.5 | 527.5 |
| 18 | FL442000093 |
Dry powder2 |
245.7 | 260.0 | 307.4 | 259.0 | 266.9 | 307.4 |
On the liability side, loans (line 12) account for about 60 percent of borrowing. Equity shares issued by private debt funds (line 16) are valued at $541 billion in 2025:Q4. These shares are added as a new financial instrument "private debt fund shares" in the Financial Accounts and are shown in table F522.3.s of the release, discussed in more detail in Section 4.3.
Business development companies (BDCs): tables S.124.5.t and S.124.5.s
Business development companies are closed-end investment companies created by Congress in 1980 to channel capital to small and mid-sized U.S. businesses. BDCs elect to be regulated under Section 2(a)(48) of the Investment Company Act of 1940 and must invest at least 70 percent of their total assets in eligible portfolio companies—primarily domestic unlisted companies or certain small-cap companies. Unlike traditional investment companies, BDCs can employ substantially higher leverage, with statutory limits allowing up to 2:1 debt-to-equity ratios.
BDCs can be structured as publicly traded companies (with shares listed on exchanges), public non-traded companies (offering shares directly to investors meeting certain suitability criteria with periodic redemptions), or private companies (offering securities to either accredited or qualified investors through private placements, similar to private debt funds). All three types of BDCs are included in the Financial Accounts.
Our primary data source is BDC Collateral, a proprietary financial analytics platform and data aggregator developed by LSEG LPC. The platform extracts data from BDCs' 10-Qs and 10-Ks, which we use to estimate equity investments, private credit loans, syndicated loans, cash positions, and miscellaneous assets. The dataset includes both cost and fair value for BDCs' investments, enabling us to decompose changes in asset levels into transactions and revaluations. The BDC table includes memo items showing the breakdown of assets across the three BDC types.
As shown on table S.124.5.s (see Table 3), BDCs have AUM of about $570 billion as of 2025:Q4, up from less than $40 billion in 2012 (see Figure 1). Private credit loans account for 80 percent of assets, while syndicated loans and corporate equities each account for about 7 percent.
Table 3: Business Development Companies Sector Balance Sheet
S124.5.s Business development companies (BDCs)
Billions of dollars; amounts outstanding end of period, not seasonally adjusted
| 2023 | 2024 | 2025 | 2025:Q2 | 2025:Q3 | 2025:Q4 | |||
|---|---|---|---|---|---|---|---|---|
| 1 | FL454090003 | Total financial assets | 318.8 | 440.9 | 572.2 | 502.8 | 534.8 | 572.2 |
| 2 | FL453020003 |
Checkable deposits and currency |
10.6 | 13.7 | 14.4 | 13.8 | 14.8 | 14.4 |
| 3 | FL454041005 |
Loans |
270.9 | 382.0 | 499.1 | 437.1 | 465.4 | 499.1 |
| 4 | FL453067203 |
Private credit loans |
238.1 | 340.8 | 455.9 | 391.1 | 425.8 | 455.9 |
| 5 | FL453069803 |
Other loans and advances (syndicated loans) |
32.9 | 41.2 | 43.2 | 46.0 | 39.6 | 43.2 |
| 6 | LM453064103 |
Corporate equities |
30.3 | 34.1 | 41.8 | 36.1 | 38.7 | 41.8 |
| 7 | FL453093005 |
Miscellaneous assets |
7.0 | 11.0 | 16.9 | 15.8 | 15.9 | 16.9 |
| 8 | FL454194005 | Total liabilities and equity | 318.8 | 440.9 | 572.2 | 502.8 | 534.8 | 572.2 |
| 9 | FL454190005 |
Total liabilities |
156.3 | 215.5 | 285.5 | 242.4 | 258.5 | 285.5 |
| 10 | FL453163003 |
Debt securities (corporate bonds) |
45.3 | 64.4 | 81.5 | 74.4 | 79.0 | 81.5 |
| 11 | FL453168003 |
Depository institution loans n.e.c. |
101.5 | 137.0 | 180.8 | 147.3 | 158.2 | 180.8 |
| 12 | FL453193005 |
Miscellaneous liabilities |
9.5 | 14.2 | 23.2 | 20.7 | 21.4 | 23.2 |
| 13 | LM453164105 |
Total equity |
162.5 | 225.4 | 286.7 | 260.4 | 276.3 | 286.7 |
|
Memo: |
||||||||
| 14 | LM453067213 |
Fair value of private credit loans |
234.8 | 336.4 | 451.9 | 388.1 | 422.1 | 451.9 |
| 15 | LM453069813 |
Fair value of syndicated loans |
31.9 | 40.5 | 42.0 | 45.2 | 38.6 | 42.0 |
|
Total financial assets of BDCs by type: |
||||||||
| 16 | LM454090013 |
Traded perpetual |
151.9 | 163.8 | 181.0 | 176.3 | 179.0 | 181.0 |
| 17 | LM454090023 |
Private perpetual |
115.1 | 204.7 | 306.8 | 250.5 | 277.5 | 306.8 |
| 18 | LM454090033 |
Private finite |
51.8 | 72.4 | 84.5 | 76.0 | 78.3 | 84.5 |
Source: Financial Accounts of the United States.
On the liability side, we distinguish between debt securities, bank loans, and miscellaneous liabilities. Bank loans (line 11) account for about 2/3 of the total, while debt securities (line 10) account for most of the remainder.
BDCs also issue public and private equity that is classified in the Financial Accounts as corporate equity and included on the corporate equity financial instrument table F51.1.s. Equity shares issued by BDCs (line 13) were valued at $287 billion in 2025:Q4.
Interval funds and tender offer funds: tables S124.6.s and S124.6.t
Interval funds and tender offer funds are closed-end investment vehicles designed to invest in illiquid asset classes (e.g., private credit) while providing investors with limited, periodic liquidity through scheduled repurchase mechanisms. The fundamental distinction between the two structures lies in the mandatory versus discretionary nature of their repurchase obligations, with interval funds being required to redeem a certain number of shares at specified intervals while tender offer funds have more discretion over the timing, frequency, and offer size.
Registered interval and tender offer funds are regulated under the 1940 Act. Regulatory requirements include enhanced disclosure through Form N-2 registration statements and Form N-PORT reporting of portfolio holdings, adherence to leverage limitations, and independent board oversight. We use data from Morningstar and SEC Form N-PORT to construct the balance sheet.11
Balance sheet data for interval and tender offer funds appear in table S124.6.s (see Table 4), which shows combined assets of $292 billion as of 2025:Q4, up from $100 billion in 2021 (the beginning of our series). Together, private credit loans and syndicated loans (lines 7 and 8) account for nearly 30 percent of assets, while corporate equities (line 9) account for 44 percent.
Table 4: Interval and Tender Offer Funds Sector Balance Sheet
S124.6.s Interval and tender offer funds1
Billions of dollars; amounts outstanding end of period, not seasonally adjusted
| 2023 | 2024 | 2025 | 2025:Q2 | 2025:Q3 | 2025:Q4 | |||
|---|---|---|---|---|---|---|---|---|
| 1 | FL464090005 | Total financial assets | 160.1 | 210.6 | 292.4 | 250.6 | 276.0 | 292.4 |
| 2 | FL463020005 |
Checkable deposits and currency |
3.0 | 3.4 | 5.6 | 4.6 | 5.2 | 5.6 |
| 3 | LM464022005 |
Debt securities |
28.7 | 34.6 | 40.7 | 38.0 | 40.4 | 40.7 |
| 4 | LM463062005 |
Municipal securities |
4.1 | 4.5 | 4.1 | 4.5 | 4.6 | 4.1 |
| 5 | LM463063005 |
Corporate and foreign bonds |
24.6 | 30.1 | 36.6 | 33.5 | 35.9 | 36.6 |
| 6 | FL464041005 |
Loans |
39.1 | 59.7 | 84.3 | 69.6 | 76.7 | 84.3 |
| 7 | FL463067205 |
Private credit loans |
34.0 | 53.1 | 76.3 | 61.9 | 68.9 | 76.3 |
| 8 | FL463069805 |
Other loans and advances (syndicated loans) |
5.1 | 6.7 | 8.0 | 7.7 | 7.8 | 8.0 |
| 9 | LM463064105 |
Corporate equities |
60.6 | 82.6 | 128.9 | 105.5 | 116.5 | 128.9 |
| 10 | FL463034005 |
Money market fund shares |
5.8 | 7.7 | 10.4 | 10.9 | 13.5 | 10.4 |
| 11 | FL463093005 |
Miscellaneous assets |
22.9 | 22.6 | 22.6 | 22.0 | 23.6 | 22.6 |
| 12 | FL464194005 | Total liabilities and equity | 160.1 | 210.6 | 292.4 | 250.6 | 276.0 | 292.4 |
| 13 | FL464190005 |
Total liabilities |
28.4 | 38.9 | 55.6 | 47.6 | 52.6 | 55.6 |
| 14 | FL464141005 |
Loans |
12.2 | 15.4 | 21.1 | 17.9 | 18.6 | 21.1 |
| 15 | FL462151005 |
Security repurchase agreements |
2.2 | 2.0 | 2.7 | 2.2 | 2.9 | 2.7 |
| 16 | FL463168005 |
Depository institution loans n.e.c. |
9.9 | 13.3 | 18.4 | 15.7 | 15.8 | 18.4 |
| 17 | FL463193005 |
Miscellaneous liabilities |
16.2 | 23.5 | 34.6 | 29.7 | 34.0 | 34.6 |
| 18 | LM463164105 |
Total equity |
131.7 | 171.7 | 236.8 | 203.0 | 223.3 | 236.8 |
|
Memo: |
||||||||
| 19 | LM463067213 |
Fair value of private credit loans |
33.5 | 52.4 | 75.6 | 61.4 | 68.3 | 75.6 |
| 20 | LM463069813 |
Fair value of syndicated loans |
5.0 | 6.5 | 7.8 | 7.6 | 7.6 | 7.8 |
|
Total financial assets by fund type: |
||||||||
| 21 | LM464090073 |
Interval funds |
101.1 | 135.9 | 182.3 | 159.0 | 174.2 | 182.3 |
| 22 | LM464090083 |
Tender offer funds |
59.0 | 74.7 | 110.1 | 91.6 | 101.8 | 110.1 |
On the liability side, interval and tender offer funds use limited borrowing, with equity issues (line 18) accounting for most of the funding.
Middle-market CLOs: Added to tables S125s1.3.s and S125s1.3.t
Collateralized loan obligations (CLOs) are financial vehicles that issue securities backed by pools of loans. Middle-market (MM) CLOs are backed specifically by loans to middle-market companies. The loans underlying MM CLOs are often originated by direct lenders such as PD funds, BDCs, and asset managers affiliated with life insurers. These lenders, or their affiliates, also commonly serve as the CLO managers.
To estimate the outstanding value of private credit loans held by MM CLOs, we use data from Moody's Analytics Inc., Global CLO database, which includes information on CLO assets, performance of CLO tranches, and attributes of the underlying loans and loan obligors.12 We identify MM CLOs by filtering for deals and tranches identified as small and middle-market CLOs that are denominated in U.S. dollars and are backed by loans to U.S. businesses. We then calculate total quarterly MM CLO assets under management (AUM) using data on the outstanding deal value of all CLO tranches meeting these criteria.
Unlike the other private credit vehicles described above, MM CLOs are not added as a new sector but are instead incorporated into the existing issuers of asset-backed securities (ABS) sector, which captures private-label securitization activity collateralized by a variety of financial assets, most notably mortgages and syndicated loans. To do this, we added private credit loans held by U.S.-domiciled MM CLOs to the asset side of the ABS balance sheet and the same amount of corporate bonds to the liability side (shown in lines 7 and 18 of table S125s1.3.s, see Table 5). In 2025:Q4, domestic MM CLOs held $54 billion in private credit loans. MM CLOs domiciled abroad (primarily in the Cayman Islands) are included in the ROW sector.
Table 5: Issuers of Asset-Backed Securities Sector Balance Sheet
S125s1.3.s Issuers of asset-backed securities (ABS)
Billions of dollars; amounts outstanding end of period, not seasonally adjusted
| 2023 | 2024 | 2025 | 2025:Q2 | 2025:Q3 | 2025:Q4 | |||
|---|---|---|---|---|---|---|---|---|
| 1 | FL674090005 | Total financial assets | 1,532.5 | 1,680.3 | 1,910.4 | 1,782.7 | 1,865.4 | 1,910.4 |
| 2 | FL674022005 |
Debt securities |
31.4 | 26.2 | 19.2 | 20.4 | 19.0 | 19.2 |
| 3 | FL673061103 |
Treasury securities |
31.4 | 26.2 | 19.2 | 20.4 | 19.0 | 19.2 |
| 4 | FL673061703 |
Agency- and GSE-backed securities1 |
0.0 | 0.0 | 0.0 | 0.0 | 0.0 | 0.0 |
| 5 | FL674035005 |
Loans |
1,265.2 | 1,383.2 | 1,551.1 | 1,452.9 | 1,515.2 | 1,551.1 |
| 6 | FL673066000 |
Consumer credit |
16.3 | 15.7 | 15.8 | 15.9 | 15.9 | 15.8 |
| 7 | FL673067205 |
Private credit loans |
31.7 | 42.9 | 53.7 | 49.3 | 51.8 | 53.7 |
| 8 | FL673065005 |
Mortgages3 |
924.8 | 993.6 | 1,100.0 | 1,041.1 | 1,083.7 | 1,100.0 |
| 9 | FL673065105 |
One-to-four-family residential |
434.5 | 478.5 | 525.8 | 498.3 | 511.4 | 525.8 |
| 10 | FL673065405 |
Multifamily residential |
66.2 | 70.2 | 73.4 | 72.5 | 72.4 | 73.4 |
| 11 | FL673065505 |
Commercial |
424.1 | 445.0 | 500.8 | 470.3 | 499.9 | 500.8 |
| 12 | FL673069005 |
Other loans and advances2 |
292.5 | 330.9 | 381.6 | 346.6 | 363.9 | 381.6 |
| 13 | FL673070003 |
Trade credit |
45.7 | 49.9 | 59.0 | 54.3 | 54.8 | 59.0 |
| 14 | FL673090543 |
Miscellaneous assets (funding agreements)4 |
190.1 | 221.0 | 281.1 | 255.2 | 276.3 | 281.1 |
| 15 | FL674190005 | Total liabilities | 1,532.5 | 1,680.3 | 1,910.4 | 1,782.7 | 1,865.4 | 1,910.4 |
| 16 | FL674122005 |
Debt securities |
1,526.5 | 1,667.8 | 1,888.1 | 1,764.2 | 1,843.9 | 1,888.1 |
| 17 | FL673169105 |
Commercial paper |
129.6 | 164.5 | 231.5 | 175.3 | 189.1 | 231.5 |
| 18 | FL673163005 |
Corporate bonds (net)5 |
1,396.9 | 1,503.3 | 1,656.6 | 1,588.9 | 1,654.8 | 1,656.6 |
| 19 | FL672151003 |
Loans (security repurchase agreements) |
6.0 | 12.5 | 22.3 | 18.5 | 21.5 | 22.3 |
| Memo: Securitized assets not included above | ||||||||
| 20 | FL675013263 |
Consumer leases6 |
0.0 | 0.0 | 0.0 | 0.0 | 0.0 | 0.0 |
| 21 | FL643065045 |
Mortgage REIT assets7 |
153.1 | 154.0 | 169.8 | 155.5 | 161.3 | 169.8 |
| Memo: Securitized liabilities not included above | ||||||||
| 22 | FL763169103 |
Commercial paper8 |
188.4 | 173.5 | 187.4 | 206.8 | 198.3 | 187.4 |
Note 1: Agency- and GSE-backed mortgage pool securities backing privately issued CMOs.
Note 2: Includes loans backing domestically-issued collateralized loan obligation (CLO) securities; loans backing U.S. CLO securities issued outside the U.S. are shown on the Rest of World table (S2.s), Of which: loans held by CLOs.
Note 3: Mortgages backing privately issued pool securities and privately issued CMOs.
Note 4: Funding agreements with life insurance companies.
Note 5: Liabilities net of assets.
Note 6: Receivables from operating leases, such as consumer automobile leases, are recorded as current income when payments are received and are not included in financial assets (or household liabilities). The leased automobile is a nonfinancial asset.
Note 7: Included on mortgage real estate investment trusts (mortgage REITs) table (S124.4.s).
Note 8: Included on U.S.-chartered depository institutions table (S122.1.s), open market paper liabilities.
Source: Financial Accounts of the United States.
4.3 New Financial Instruments
The private credit integration introduces two new financial instruments into the Financial Accounts: private credit loans (the loans originated by private credit vehicles) and shares of private debt funds (ownership stakes in private debt funds).
Private credit loans: table F4.4.s
As noted in the introduction, private credit loans are defined here as privately negotiated loans to businesses that are originated by nonbank investment funds. This definition encompasses corporate direct lending, asset-based and specialty finance, real estate debt, infrastructure debt, and other privately negotiated loans. It therefore does not depend on the identity of the borrower, the purpose of the loan, or the assets supporting repayment. These loans span the full range of seniority levels: some are senior secured with first claim on collateral, others are unsecured or junior claims that absorb losses earlier but expect to earn higher returns, and still others are hybrid instruments blending debt and equity characteristics.
Private credit loans originated by all private credit vehicles are reported on a new financial instrument table. This table shows both the holders (lenders) and issuers (borrowers) of the loans, providing a complete picture of U.S. private credit market activity.
As of 2025:Q4, total private credit loans outstanding across all vehicles amounted to approximately $1.5 trillion. U.S.-domiciled private credit vehicles—primarily PD funds and BDCs—account for about $1 trillion, or roughly two-thirds of the total, while foreign-domiciled vehicles (mainly PD funds) account for $376 billion in loans to U.S. businesses (see Table 6).
Table 6: Private Credit Loans Instrument, Holders and Issuers
F4.4.s Private credit loans
Billions of dollars; amounts outstanding end of period, not seasonally adjusted
| 2023 | 2024 | 2025 | 2025:Q2 | 2025:Q3 | 2025:Q4 | |||
|---|---|---|---|---|---|---|---|---|
| 1 | FL893167205 | Total liabilities | 1,042.6 | 1,253.6 | 1,493.5 | 1,354.9 | 1,410.6 | 1,493.5 |
| 2 | FL103167205 |
Nonfinancial corporate business |
764.5 | 916.9 | 1,087.9 | 990.1 | 1,031.1 | 1,087.9 |
| 3 | FL113167205 |
Nonfinancial noncorporate business |
148.1 | 181.7 | 222.7 | 198.3 | 208.9 | 222.7 |
| 4 | FL503167205 |
Other financial business |
100.2 | 121.8 | 147.8 | 132.9 | 137.2 | 147.8 |
| 5 | FL263167205 |
Rest of the world |
29.8 | 33.2 | 35.1 | 33.6 | 33.5 | 35.1 |
| 6 | FL893067205 | Total assets | 1,042.6 | 1,253.6 | 1,493.5 | 1,354.9 | 1,410.6 | 1,493.5 |
| 7 | FL453067203 |
Business development companies |
238.1 | 340.8 | 455.9 | 391.1 | 425.8 | 455.9 |
| 8 | FL463067205 |
Interval and tender offer funds |
34.0 | 53.1 | 76.3 | 61.9 | 68.9 | 76.3 |
| 9 | FL443067205 |
Private debt funds |
432.5 | 480.6 | 532.2 | 497.4 | 500.8 | 532.2 |
| 10 | FL673067205 |
Issuers of asset-backed securities (CLOs) |
31.7 | 42.9 | 53.7 | 49.3 | 51.8 | 53.7 |
| 11 | FL263067205 |
Rest of the world |
306.4 | 336.2 | 375.5 | 355.2 | 363.4 | 375.5 |
Source: Financial Accounts of the United States.
Constructing the borrower side of the table presents measurement challenges, as we do not have detailed data on borrower characteristics for loans originated by both private debt funds and interval and tender offer funds. However, both BDC Collateral and Moody's Global CLO datasets include information on identity of the borrower, industry classifications, and country locations. We use this information to estimate the U.S. borrower sector distribution for loans originated by BDCs and held in MM CLOs, and we then apply the same distribution to loans held by PD funds and interval and tender offer funds. As shown in Figure 2, most borrowers are U.S. nonfinancial businesses; other financial businesses and foreign businesses account for the remainder.
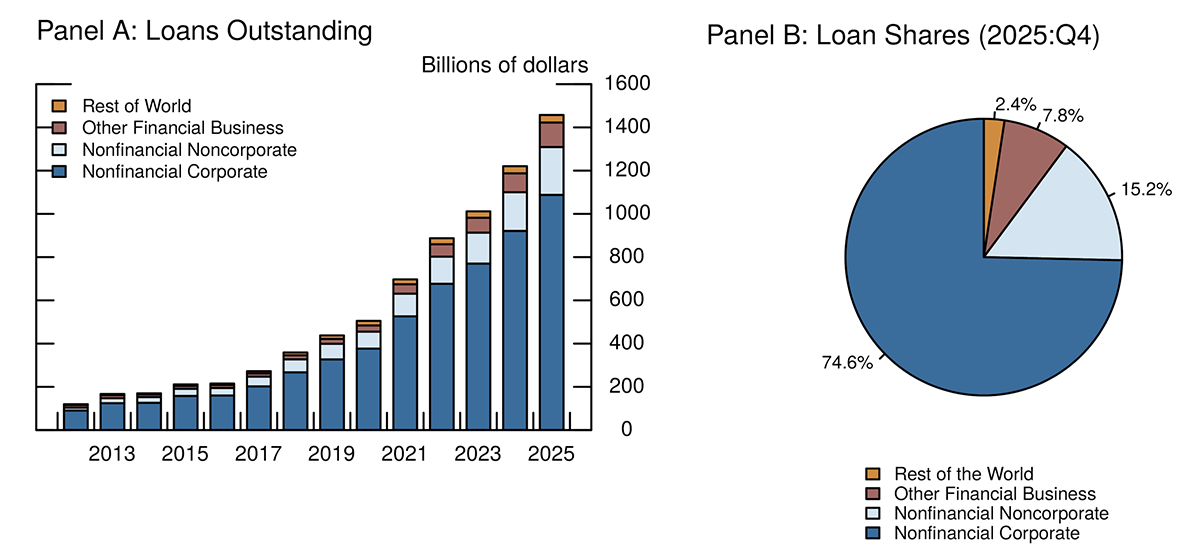
Note: Data as of Q4 each year. For Panel A, the key identifies bars in order from top to bottom. For Panel B, the legend identifies borrower types in clockwise order, starting at the top of the chart with Rest of the World (2.4%).
Source: Financial Accounts of the United States.
The private credit loan table's underlying detail series provides from-whom-to-whom data at the sector level, enabling users to analyze the source of private credit borrowing for each business sector or the lending exposures for each private credit vehicle. For example, U.S. nonfinancial corporate businesses owe roughly $1.1 trillion in private credit loans, with $622 billion borrowed from private debt funds, $341 billion through BDCs, $57 billion through interval and tender offer funds, and $69 billion through middle-market CLOs.
Shares of private debt funds: table F522.3.s
Equity shares issued by private debt funds are reported in a new financial instrument table (F522.3.s, see Table 7). As with the private credit loan table, this instrument table provides detail on the amounts outstanding by both issuer sectors (domestic PD funds and ROW) and investor sectors.
Table 7: Private Debt Fund Shares Instrument
F522.3.s Private debt fund shares
Billions of dollars; amounts outstanding end of period, not seasonally adjusted
| 2023 | 2024 | 2025 | 2025:Q2 | 2025:Q3 | 2025:Q4 | |||
|---|---|---|---|---|---|---|---|---|
| 1 | LM893164505 | Shares at market value | 579.0 | 642.4 | 689.4 | 661.2 | 656.9 | 689.4 |
| 2 | LM443164500 |
Private debt funds |
452.2 | 505.2 | 541.3 | 520.3 | 517.2 | 541.3 |
| 3 | LM263164500 |
Rest of the world |
126.8 | 137.1 | 148.2 | 140.9 | 139.7 | 148.2 |
| 4 | LM893164505 | Holdings at market value | 579.0 | 642.4 | 689.4 | 661.2 | 656.9 | 689.4 |
| 5 | LM153064505 |
Households1 |
137.6 | 148.5 | 155.9 | 150.9 | 150.6 | 155.9 |
| 6 | LM213064500 |
State and local governments |
21.9 | 26.5 | 29.4 | 28.0 | 26.9 | 29.4 |
| 7 | LM543064570 |
Life insurance companies |
77.0 | 85.6 | 99.1 | 88.3 | 89.4 | 99.1 |
| 8 | LM573064540 |
Private pension funds |
85.2 | 84.6 | 94.4 | 87.4 | 86.4 | 94.4 |
| 9 | LM223064540 |
State and local government employee pension funds |
166.2 | 191.0 | 195.2 | 195.5 | 194.2 | 195.2 |
| 10 | LM503064500 |
Other financial business |
15.6 | 20.0 | 24.0 | 20.9 | 20.6 | 24.0 |
| 11 | LM263064500 |
Rest of the world |
75.5 | 86.1 | 91.5 | 90.2 | 88.8 | 91.5 |
The net asset value of PD fund shares (line 1) equals the total value of shares outstanding. We use data from SEC Form PF to allocate private debt fund shares across investor sectors in the Financial Accounts. Note that these shares reflect deployed capital and do not include dry powder, which is capital committed to the fund but not yet drawn down.
PD funds are primarily financed by institutional investors through long-term, committed capital with limited redemption rights. As shown in Figure 3, public and private defined benefit pension funds hold just over 40 percent of the shares, life insurers hold 14 percent, and households and nonprofits hold 23 percent. The remainder is held by state and local governments, other financial businesses, and investors in the ROW sector. These shares have remained stable over the past decade, though the share held by life insurers has increased somewhat while shares held by households and private pensions have declined modestly.
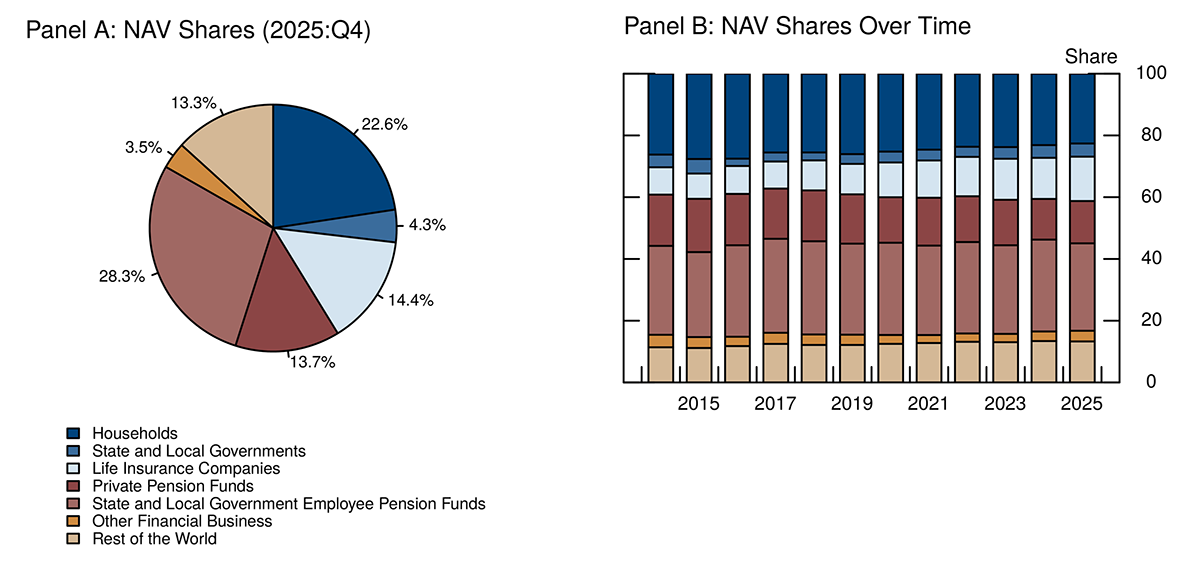
Note: Data as of Q4 each year. NAV is net asset value. For Panel A, the legend identifies investor type in a clockwise order, starting at the top of the chart with Households (22.6%). For Panel B, the key identifies bars in order from top to bottom.
Source: Financial Accounts of the United States.
Section 5. Effects on Financial Accounts Measures of Debt, Leverage, and Household Wealth
Nonfinancial business debt and leverage
This section examines how adding private credit loans to the Financial Accounts affects measures of aggregate nonfinancial business debt and leverage. Private credit now makes up a substantial fraction of total business debt. As shown in Table 8, which presents components of total debt of the nonfinancial business sector as of 2025:Q4, private credit loans accounted for about 6 percent of total business debt, up from around one percent in 2012 (Figure 4).
Table 8: Components of Nonfinancial Business Sector Debt
| Total debt in 2025:Q4 ($Trillions) | Percent of total debt in 2025:Q4 | |
|---|---|---|
| Nonfinancial business debt outstanding, by debt type | ||
|
Corporate bonds |
8.08 | 35% |
|
Private credit |
1.31 | 6% |
|
Syndicated loans |
0.77 | 3% |
|
Mortgages |
7.20 | 31% |
|
Depository loans |
2.87 | 12% |
|
Commercial paper |
0.21 | 1% |
|
Industrial revenue bonds |
0.65 | 3% |
|
Other debt |
2.21 | 9% |
| Total nonfinancial business debt | 23.29 | 100% |
Note: Debt is defined as loans and debt securities. Components may not add to total due to rounding.
Source: Financial Accounts of the United States.
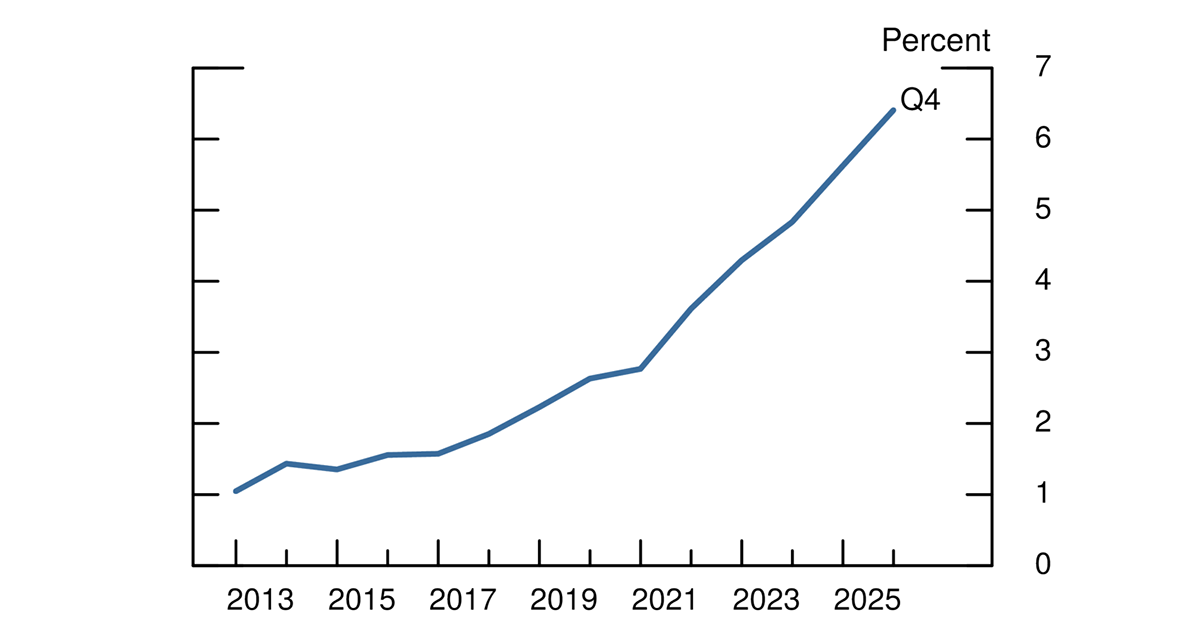
Note: Data as of Q4 each year. Debt is defined as loans and debt securities.
Source: Financial Accounts of the United States.
Debt positions of nonfinancial businesses have been identified as important metrics of financial health and systemic financial risk. Measures of nonfinancial leverage based on Financial Accounts data are also used to evaluate financial stability risks in the Federal Reserve's biannual Financial Stability Report.13 Prior to incorporating private credit loans as a component of debt in the Financial Accounts, aggregate debt positions of nonfinancial businesses were understated. It is useful, therefore, to evaluate whether debt trends are meaningfully different with the inclusion of private credit in aggregate measures of U.S. business debt.
Despite the strong growth in private credit loans in the U.S. economy since 2018, the addition of private credit loans to the Financial Accounts does not substantially change the trends in business debt overall. Panel A of Figure 5 presents the ratio of nonfinancial business debt-to-GDP with and without private credit loans included in the measure of debt. The debt-to-GDP ratio is around 5 percentage points higher in recent years when private credit is included, but the ratio remains below the median as measured since 2012 and has been on a declining trend since 2020. Panel B of Figure 5 shows debt growth with and without private credit included in the measure of total business debt. Annual debt growth since 2018 is somewhat higher when private credit is incorporated but the trend is not substantially different.
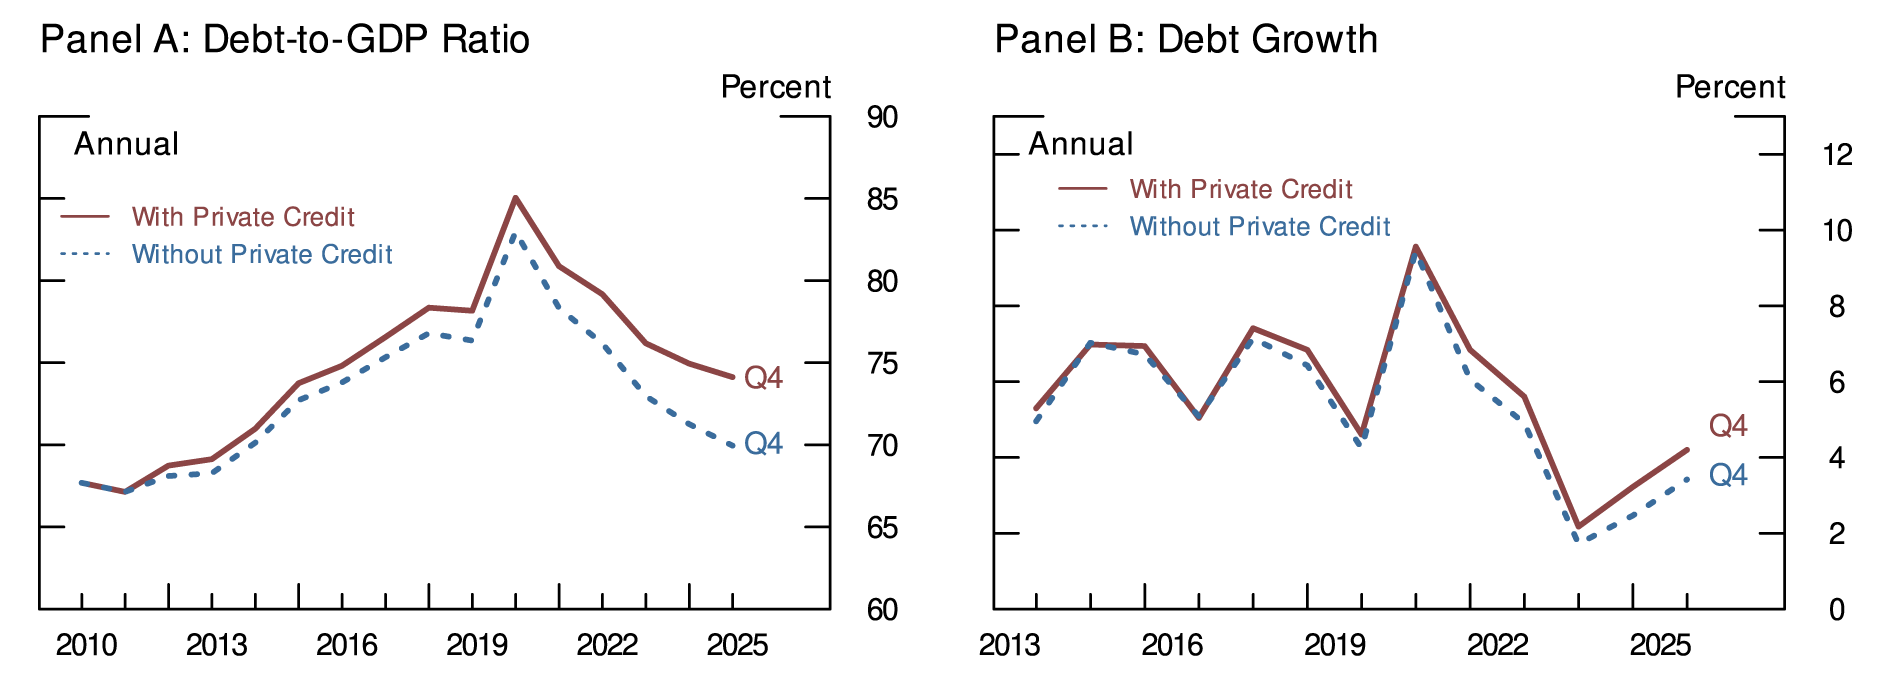
Note: Data as of Q4 each year. Debt is defined as loans plus debt securities.
Source: Financial Accounts of the United States.
Household net worth
The integration of private credit also directly and indirectly affects measures of household net worth. As discussed in Section 3, the previous treatment of private credit led to the misattribution (directly or indirectly) of certain financial assets on the household balance sheet. The integration of private credit vehicles and instruments results in more accurate measurement of household balance sheets. Additionally, we now show households' direct exposures to private credit through investment in private debt fund shares as well as their indirect exposures through important household assets such as pension entitlements.
Section 6. Conclusion
Beginning with the September 2026 release, the Financial Accounts of the United States fully integrate private credit by adding new sectors for private credit vehicles and new financial instrument tables for private credit loans and shares of private debt funds. Using confidential SEC Form PF data along with other sources, we construct comprehensive balance sheets for approximately $1.1 trillion in private credit loan activity by U.S.-domiciled vehicles. The integration helps users track the intermediation chain from investors through private credit vehicles to borrowers, with detailed data available on private credit loans across sectors.14
This integration substantially improves measurement of nonfinancial business leverage and provides more accurate measurement of household balance sheets and exposures to private credit markets. The comprehensive framework facilitates analysis of the connections between private credit and the broader financial system, enhancing the Financial Accounts' utility for assessing financial stability risks. For more detail on the institutional features of private credit vehicles and the growing role of private credit in financial markets, see the forthcoming companion FEDS note "U.S. Private Credit Vehicles: Institutional Structure and Aggregate Balance Sheets." For complete methodological details on the construction of these series, see the Guide to the Financial Accounts of the United States.
References
Adrian, Tobias, Daniel Covitz, and Nellie Liang (2015). Financial Stability Monitoring. Annual Review of Financial Economics 7(1), 357-395.
Board of Governors of the Federal Reserve System (2026). Financial Stability Report – May 2026.
1. We are grateful to Daniel Barth, Mike Batty, Marco Cagetti, Fang Cai, Sophia Castelo, Ahmet Degerli, Giovanni Favara, Matt Hoops, Patrick McCabe, Phillip Monin, Lubomir Petrasek, and Clara Vega for helpful comments and suggestions. We also thank Keely Adjorlolo, Santoro Giuggio, Harrison Karp, and Patrick Schroeder for expertise and assistance with the private credit data. Return to text
2. The September 2026 release also incorporates a new hedge fund sector and an associated hedge fund shares instrument category. These changes will be further detailed in a separate FEDS Note. Return to text
3. Total assets under management of foreign private debt funds represent funds covered by SEC Form PF and are not separately identified in the Financial Accounts. Return to text
4. For more detail on the institutional features of these vehicles, please see the forthcoming FEDS Note "U.S. Private Credit Vehicles: Institutional Structure and Aggregate Balance Sheets." Return to text
5. Except for the nonfinancial noncorporate sector, where they were incorrectly attributed to banks. Return to text
6. In the Financial Accounts, household transactions (holdings) of many financial instruments are estimated as the difference between total issuance (outstanding) and the sum of transactions (holdings) by all other identified sectors. Return to text
7. One limitation of using Form PF is that it captures only private debt funds that fall under the SEC registration of the fund advisor, which does not rely on the location of investments. Certain non-U.S. advisers may remain exempt from SEC registration even where their funds have U.S. investors or make substantial U.S. investments, causing some U.S. loans to fall outside Form PF. Return to text
8. For more detail on the classification and imputation methodology, see the forthcoming FEDS Note: "U.S. Private Credit Vehicles: Institutional Structure and Aggregate Balance Sheets." Additional detail on the construction of individual series is available in the Financial Accounts Guide. Return to text
9. The Financial Accounts data to not include uncalled capital commitments in AUM but this amount is available as a memo item on table S124.8.s. Return to text
10. We note, however, that our private credit loan figures may include some syndicated loans, as we're currently unable to fully distinguish between the two types in our data. Return to text
11. For more detail on the classification see the Financial Accounts Guide and a forthcoming FEDs note "U.S. Private Credit Vehicles: Institutional Structure and Aggregate Balance Sheets." Return to text
12. The Moody's Global CLO database is the most comprehensive data source currently available to the Federal Reserve Board for information on middle-market CLOs, however, this dataset may undercount total MM CLO volumes. Return to text
13. See Adrian et al. (2015) and Board of Governors of the Federal Reserve System (2026). Return to text
14. Detailed data on the from-whom-to-whom allocation of private credit loans from private credit vehicles to borrowing sectors are not shown on published Z.1 tables but are available through the Federal Reserve's Data Download Program (DDP) and through the Federal Reserve Bank of St. Louis's Federal Reserve Economic Data (FRED). Return to text
Brinkman, Katie, Christine Dobridge, Tim Dore, Simon Glossner, Elizabeth Holmquist, Nam Nguyen, Maria Perozek, and Irina Stefanescu (2026). "Introducing Private Credit into the Financial Accounts of the United States," FEDS Notes. Washington: Board of Governors of the Federal Reserve System, October 16, 2026, https://doi.org/10.17016/2380-7172.4204.
Disclaimer: FEDS Notes are articles in which Board staff offer their own views and present analysis on a range of topics in economics and finance. These articles are shorter and less technically oriented than FEDS Working Papers and IFDP papers.