FEDS Notes
April 19, 2022
Investor Base and Prime Money Market Fund Behavior
Lei Li and Lucas Epstein1
On August 16, 2022, this FEDS Note was revised to reflect, based on more accurate and up-to-date information, the reclassification of one large money market fund to the nonpublic sector from the public sector. The text and figures have been revised.
Introduction
Prime money market funds (MMFs) represent a key vulnerability in the financial system. During the last 15 years, they have experienced two severe investor runs, in September 2008 and March 2020, both of which contributed to full-scale financial crises. The vulnerability of prime MMFs to runs and potential reforms to address the problem have attracted attention from academia, regulators, and the public.2 In this note, we examine the relationship between the investor base and behavior of prime MMFs between 2017 and 2021.
We focus on institutional prime MMFs, as they experienced more severe runs in 2008 and 2020 than retail prime funds. Institutional prime MMFs are an important cash management vehicle for non-retail investors, such as corporations, pension funds, and state and local governments. There is substantial heterogeneity in the investor base of institutional prime funds. While so-called public funds are broadly open to institutional investors, some of the largest institutional prime funds are nonpublic funds that are sold only to selected investors. Public funds have generally received more attention than nonpublic funds, largely due to the availability of more timely and frequent data on public funds. To the best of our knowledge, this note is the first comprehensive study comparing nonpublic institutional prime funds to their public counterparts. We find that, relative to their public counterparts, nonpublic MMFs usually experience more volatile aggregate flows, tend to have safer and more liquid portfolios, and experienced less severe outflows in March 2020.
Data and basic fund characteristics
Both public and nonpublic MMFs are regulated by the Securities and Exchange Commission (SEC) and governed by the same set of rules. To identify nonpublic MMFs, we start from the list of MMFs that file SEC Form N-MFP, which is a mandatory reporting form for all MMFs. From this list of MMFs, we filter out public funds that are covered by the iMoneyNet database. Then we manually check the prospectus of each of the funds not in the iMoneyNet database and categorize them as public or nonpublic accordingly. We drop a few funds with missing or erroneous data.3 Our final sample includes 16 unique nonpublic institutional prime funds out of 49 unique institutional prime funds in the N-MFP data between January 2017 and December 2021.4
While there are fewer nonpublic funds than public ones, nonpublic funds tend to be larger. As of December 2021, the average assets under management (AUM) of nonpublic funds was $29 billion, more than four times the size of the average public fund. The top five nonpublic funds had $367 billion in assets as of 2021 year-end, while the top five public funds had only $115 billion. In aggregate, nonpublic funds have historically accounted for well over half of the AUM in institutional prime funds (Figure 1). Notably, nonpublic funds did not experience the severe outflows in March 2020 that were observed in public funds.
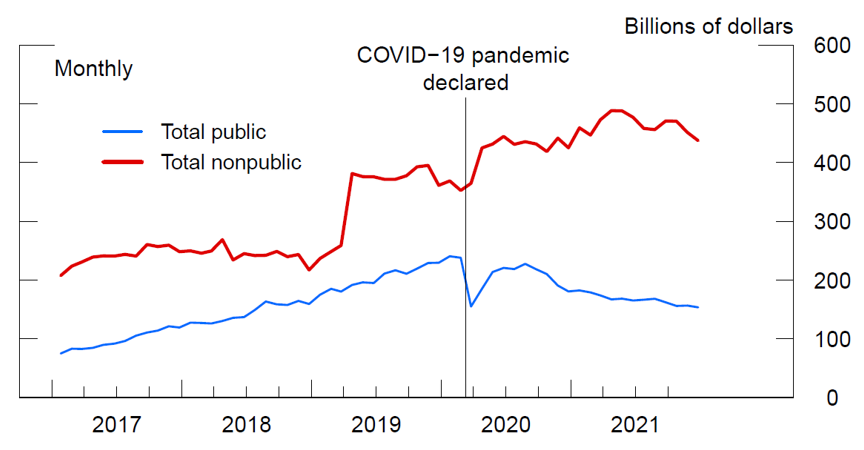
Note: This figure shows aggregate AUM for public and nonpublic institutional prime MMFs separately. Vertical line marks the COVID-19 pandemic declared in 2020 Q1.
Source: Data are from MMFs' SEC Form N-MFP filings.
Business functions and investor base
Public institutional prime funds generally offer their shares to all investors that can meet their minimum investment requirements. They tend to have a broad base of institutional investors, including corporates, pension funds, and state and local governments. Nonpublic funds, on the other hand, tend to state in their prospectuses that they are only open to specified investors. For example, the Vanguard Market Liquidity Fund states that it is "a cash management vehicle for the Vanguard funds and certain trusts and accounts managed by Vanguard or its affiliates. The Fund is not available to other investors."
Like the Vanguard Market Liquidity Fund, most nonpublic prime funds are internal cash management vehicles at asset management firms. At the end of 2021, internal cash management funds accounted for 92% of the AUM of the nonpublic prime fund sector. A second type of nonpublic fund is used for cash collateral reinvestment for securities lending. These funds represent about 8% of the nonpublic sector. Less than 0.05% of nonpublic funds are used for cash management by insurance companies.
Flow volatility and portfolio risk
Since nonpublic prime funds only accept investments from a selected group of investors, it is reasonable to assume that their investor base on average is more concentrated than that of public prime funds. However, we do not have detailed data on their investor bases to confirm our assumption. With this caveat in mind, we compare public and nonpublic institutional prime MMFs' flow volatility and portfolio risk.
As cash management vehicles, institutional prime MMFs have flows that are largely determined by their investors' day-to-day liquidity needs. If nonpublic funds have less diversified investor bases than public funds, the liquidity needs of investors in nonpublic funds may also be less diversified, leading to more volatile investment flows. We plot the aggregate weekly flow volatility measured over rolling 8-week windows for nonpublic and public funds separately in Figure 2. Indeed, nonpublic funds on average have more volatile net flows than public funds. Between 2017 and 2019, the aggregate weekly flow volatility for nonpublic funds was 2.3% of assets, but it was only 2.1% for public funds. At the onset of the COVID crisis, however, public fund flow volatility spiked amid substantial outflows. We zoom in on the March 2020 financial turmoil in the next section.
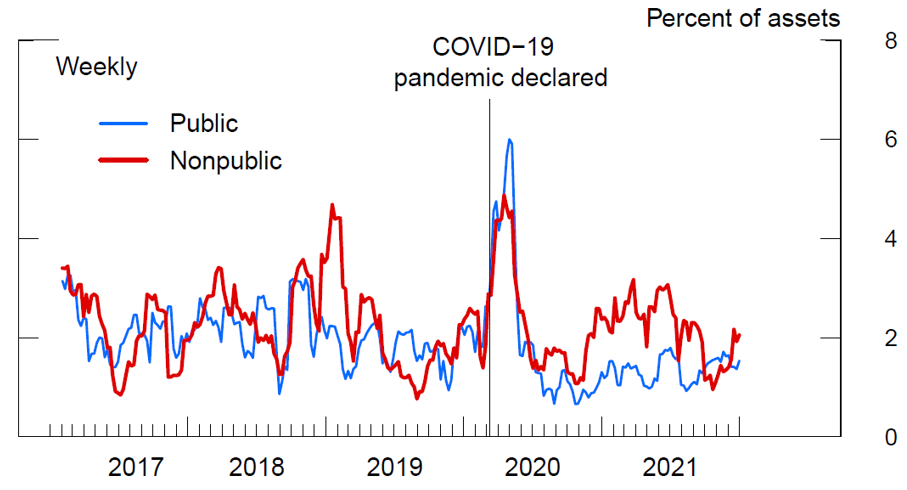
Note: This figure shows the standard deviation of weekly aggregate net flows as percent of assets under management (AUM) over the past eight weeks for public and nonpublic institutional prime funds separately. Vertical line marks the COVID-19 pandemic declared in 2020 Q1.
Source: Data are from MMFs' SEC Form N-MFP filings.
Perhaps because nonpublic funds face higher flow volatility, they tend to hold safer and more liquid portfolios than their public counterparts (Figures 3 and 4). From 2017 to 2019, nonpublic funds on average held 37% of their assets in safe assets, that is, U.S. government securities and repo backed by government securities. In contrast, the safe-asset share for public funds averaged only 11%.
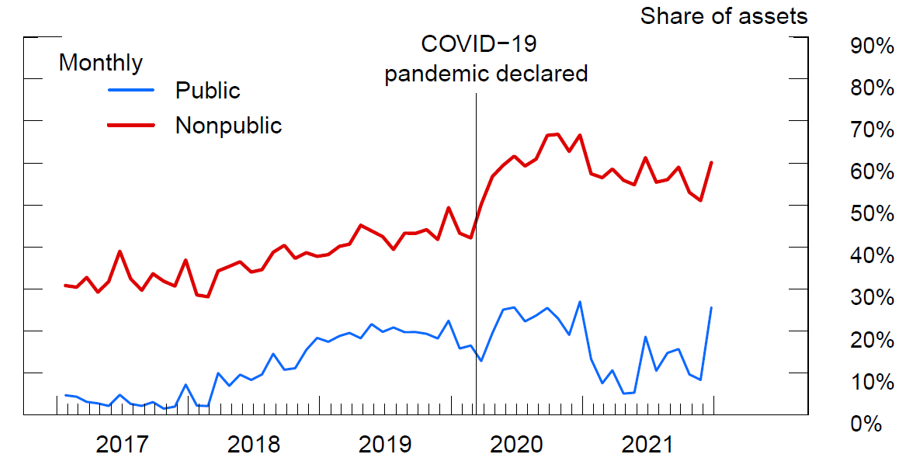
Note: This figure shows the aggregate share of safe assets in fund portfolios for public and nonpublic institutional prime funds separately. "Safe assets" are U.S. government securities, agency debt, and repo backed by government securities or agency debt. Vertical line marks the COVID-19 pandemic declared in 2020 Q1.
Source: Data are from MMFs' SEC Form N-MFP filings.
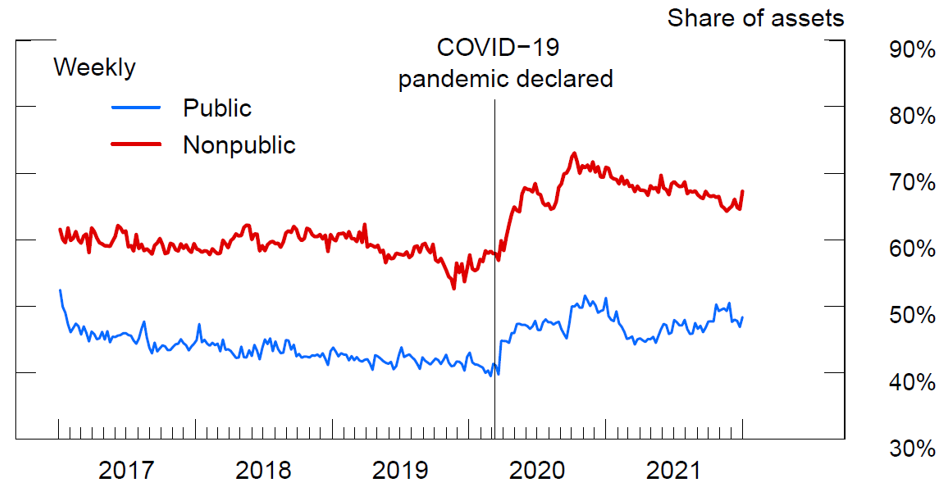
Note: This figure shows aggregate WLA as share of AUM for public and nonpublic institutional prime funds separately. WLA include cash, Treasuries, certain agency notes that mature within 60 days, and other assets that mature within one week. Vertical line marks the COVID-19 pandemic declared in 2020 Q1.
Source: Data are from MMFs' SEC Form N-MFP filings.
Nonpublic funds also tend to hold more liquid assets. Weekly liquid assets (WLA) as share of AUM is a common measure of a MMF portfolio's liquidity. WLA include assets maturing within a week and certain U.S. government securities. Nonpublic funds' WLA averaged 59% of their AUM from 2017 to 2019, significantly higher than the 44% average for public funds. Since the March 2020 crisis, the gap between nonpublic and public funds' average safe-asset shares, as well as the difference in their average WLA shares, have widened further.
Since nonpublic funds hold fewer high-yield, risky assets, such as commercial paper (CP) and negotiable certificates of deposits (NCDs), their gross yields – that is, yields before fees are charged to investors – are generally lower than those of public funds. Figure 5 shows that nonpublic funds' average gross yield was about 15 basis points lower than that of public funds before the COVID pandemic.
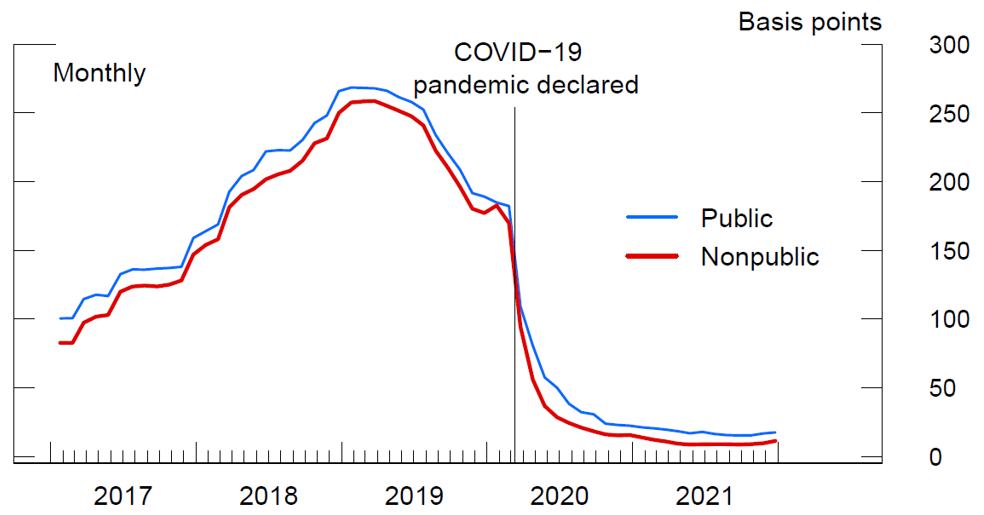
Note: This figure shows the asset-weighted average 7-day gross yield in the seven days leading up the final business day of each month for public and nonpublic institutional prime funds separately. Vertical line marks the COVID-19 pandemic declared in 2020 Q1.
Source: Data are from MMFs' SEC Form N-MFP filings.
Turmoil in March 2020
It has been well documented that institutional prime funds experienced severe investor runs at the onset of the COVID crisis (see, for example, President's Working Group on Financial Markets (2020) and Li, Li, Macchiavelli, and Zhou (2021)). In less than three weeks in March 2020, 16% of AUM was redeemed from institutional prime funds. This aggregate, however, masks a significant difference between public and nonpublic funds' outflows. Cumulative outflows for nonpublic institutional prime funds in March 2020 peaked at only 7% of AUM, whereas public institutional prime funds' outflows peaked at 35% (Figure 6). In other words, the run on nonpublic institutional prime funds was much milder than the one on their public counterparts.
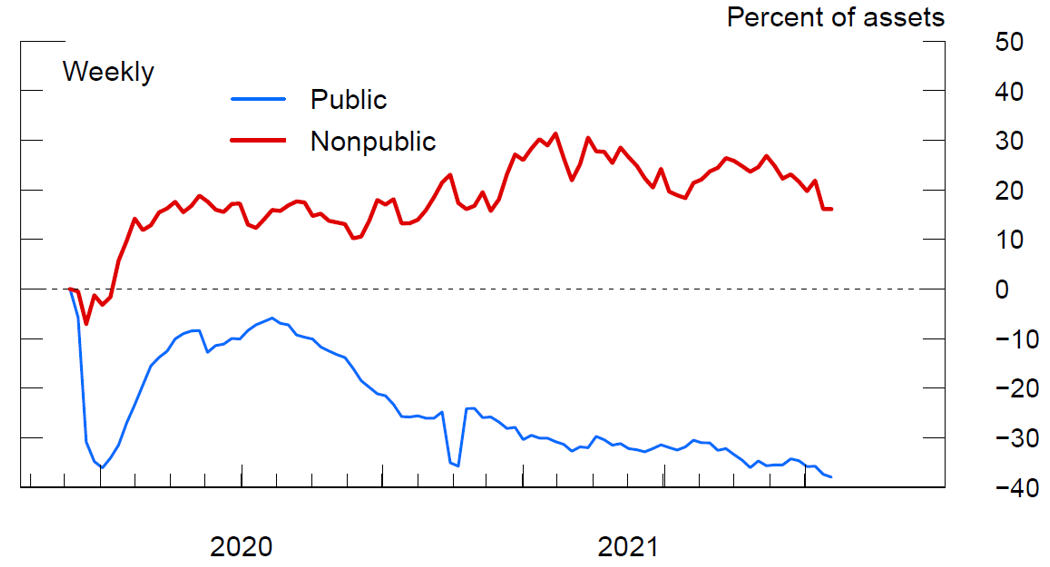
Note: This figure shows cumulative net flows since March 6, 2020, as a percent of assets on March 5, 2020, for public and nonpublic institutional prime funds separately.
Source: Data are from MMFs' SEC Form N-MFP filings.
As part of its response to the COVID crisis, the Federal Reserve established the Money Market Mutual Fund Liquidity Facility (MMLF) in March 2020 to help alleviate the distress for MMFs. There are stark differences in the MMLF take-up between public and nonpublic prime funds that reflect differences in the level of redemption pressures they faced. Only 4 (or 27%) of the 15 nonpublic funds tapped the MMLF, and they sold on average 8% of their assets into the facility. In contrast, 81% of public institutional prime funds tapped the MMLF, and their MMLF asset sales averaged 15% of their AUM.
These findings may reflect better coordination during stress periods among nonpublic funds' investors who are typically peer funds in the same family. The findings are also consistent with the notion that the more concentrated investor base of nonpublic funds gives their investors less incentives to run during a crisis since they must internalize more of the costs associated with their redemptions.
Conclusion
In this note, we compare the investment behavior and investor flows of public and nonpublic institutional prime MMFs. We find that nonpublic funds typically have more volatile aggregate net flows than public funds. Nonpublic funds also tend to have safer and more liquid portfolios and experienced significantly less outflows in March 2020. To be sure, some nonpublic funds did tap the MMLF for liquidity in March 2020, and nonpublic prime MMFs engage in significant liquidity transformation, so vulnerabilities to runs could emerge in future crises. Nonetheless, we conclude that the more concentrated investor base of nonpublic prime funds has a considerable effect on their investment decisions and investor flows.
References
Federal Reserve Bank of Boston, Money Market Mutual Fund Liquidity Facility (MMLF).
Lei Li, Yi Li, Marco Macchiavelli, Xing (Alex) Zhou, 2021, "Liquidity Restrictions, Runs, and Central Bank Interventions: Evidence from Money Market Funds," The Review of Financial Studies, Volume 34, 5402–5437.
President's Working Group on Financial Markets, 2020, "Overview of Recent Events and Potential Reform Options for Money Market Funds," accessible at https://home.treasury.gov/system/files/136/PWG-MMF-report-final-Dec-2020.pdf (PDF).
1. Li and Epstein are with the Short-Term Funding Markets Section of the Division of Research and statistics at the Federal Reserve Board. We thank Max Gross, Akber Khan, Kate Lassiter, Thomas Leistikow, Yi Li, Marco Macchiavelli, Patrick McCabe, Ashley Wang, Frank Ye, Alex Zhou, and Francesca Zucchi for helpful discussion, comments, and suggestions. The views expressed in this note are those of the authors and do not necessarily reflect those of the Board of Governors or the Federal Reserve System. Emails: [email protected], [email protected].Return to text
2. For example, the President's Working Group on Financial Markets (PWG) released a report on options for MMF reforms after each of the two runs. The Securities and Exchange Commission (SEC) introduced two rounds of MMF reforms in 2010 and 2014 and proposed further reforms in 2021. Return to text
3. In addition, we exclude feeder funds from our sample when their respective master funds are in the sample. We also exclude observations for funds with less than $1 million in assets in either the current or following month and observations with erroneous flow data. Return to text
4. We start our sample in January 2017 because a set of MMF reforms that became effective in October 2016 significantly changed the composition of the prime MMF sector. We exclude from our sample the first few months after the reforms became effective, when MMFs may still have been transitioning because of the new rules. Return to text
Li, Lei, and Lucas Epstein (2022). "Investor Base and Prime Money Market Fund Behavior," FEDS Notes. Washington: Board of Governors of the Federal Reserve System, April 19, 2022, https://doi.org/10.17016/2380-7172.3116.
Disclaimer: FEDS Notes are articles in which Board staff offer their own views and present analysis on a range of topics in economics and finance. These articles are shorter and less technically oriented than FEDS Working Papers and IFDP papers.