FEDS Notes
April 02, 2026
Labor force growth, breakeven employment, and potential GDP growth
Labor force growth has been slowing and could be near-zero starting this year, driven by weak population growth reflecting low net immigration and by declining labor force participation reflecting population aging. Such weak growth in the labor force is unprecedented in the United States’ recent history. In this note we highlight two significant implications of near-zero labor force growth: First, near-zero labor force growth implies that breakeven employment growth (i.e. the pace needed to maintain a steady unemployment rate) would also be near-zero—making negative job growth almost as likely as positive job growth in any given month. Second, it implies that any growth in potential GDP will need to come entirely from productivity growth. These features would represent a significant shift in U.S. labor market dynamics and the composition of economic growth.
Labor force growth could slow to near zero starting this year
The labor force is the pool of people available to work in the economy, namely anyone over the age of 16 who is employed or actively looking for work.1 Since this note explores the economic implications of demographic shifts that are unrelated to the business cycle, we focus on the potential labor force, so as to abstract from cyclical factors that may affect employment and job seeking behavior. The potential labor force can be expressed as the population times the potential labor force participation rate (potential LFPR).2 As a result, growth in the potential labor force is determined by population growth and changes in the potential LFPR. Since 1960, the potential labor force has grown by about 1.4 percent per year, on average (Figure 1, the red line).
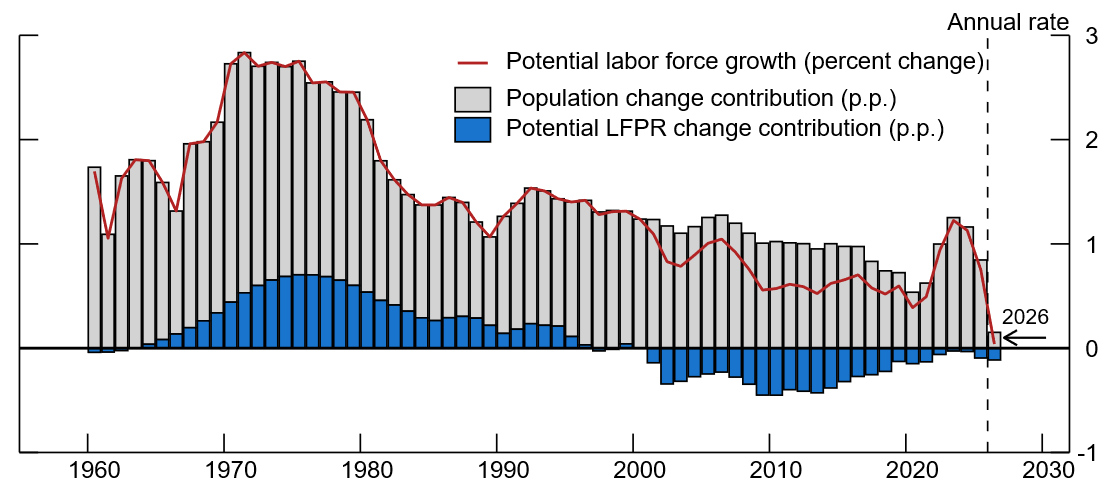
Note: The population change is the change in the civilian noninstitutional population ages 16 or older constructed as described in Appendix A. The potential LFPR is from CBO (2026). The potential labor force is the product of these measures of the population and potential LFPR. The key identifies bars in order from top to bottom.
The gray bars in Figure 1 show that population growth—which has risen by an average of 1.3 percent per year since 1960—accounts for much of the growth in the potential labor force over this period. In 2026, however, a precipitous drop in net international migration may cause population growth to be the weakest it has been since 1951—when military enlistment during the Korean War dragged on the civilian population. In January and February 2026, the Bureau of Labor Statistics (BLS) reported that the population grew at an annualized rate of only 0.4 percent. Even in 2020, when increased deaths and lower net immigration during the pandemic caused the population to grow at its lowest rate since the early 1950s, the population still grew by 0.5 percent.
Furthermore, the BLS may be overestimating the pace of population growth in 2026 as its estimates of population growth rely on the Census Bureau's projection that net immigration will boost population growth in 2026 by about 320,000 (Census Bureau (2026)). When developing this projection, the Census Bureau had to rely on data that was available as of mid-summer 2025. In Edelberg et al. (2026), the Brookings Institution used more up-to-date information to project that net immigration would likely contribute between –925,000 and +185,000 to population growth in 2026. Taking the midpoint of this range would suggest that population growth in 2026 could be a bit below 0.2 percent in 2026 (see Appendix A for details on this estimate).
The negligible contribution to potential labor force growth in 2026 from population growth is likely to be further compounded by the drag on the potential labor force from the longstanding downward trend in potential LFPR. The blue bars in Figure 1 use the Congressional Budget Office's (CBO) estimate of the potential LFPR to show the contribution of changes in potential LFPR to labor force growth. The negative contribution to labor force growth in recent years is mostly the result of the aging of the population.3
The combination of historically weak population growth and declining potential LFPR would imply that the pool of available workers in the U.S. could grow by less than 10,000 workers per month in 2026. Such a slowdown in potential labor force growth is unprecedented in recent history and would have significant implications for the U.S. economy—to which we turn next.
Implications for breakeven employment growth
Breakeven employment growth is the number of jobs that must be added to the economy each month to keep the unemployment rate steady while still absorbing the growth in the potential labor force. When monthly job growth persistently exceeds the breakeven pace of employment growth, you would generally expect the unemployment rate to decline; conversely, when job growth persistently falls short of the breakeven pace you would expect the unemployment rate to rise.
The breakeven pace of employment growth can be calculated as the change in potential employment—more concretely, the monthly change in the potential labor force times the noncyclical employment rate of individuals in the labor force (or one minus the noncyclical rate of unemployment); see Appendix C for more details. The black line in Figure 2 shows an estimate of the breakeven pace of employment growth constructed using the measure of the potential labor force discussed above and the CBO's estimate of the noncyclical rate of unemployment.
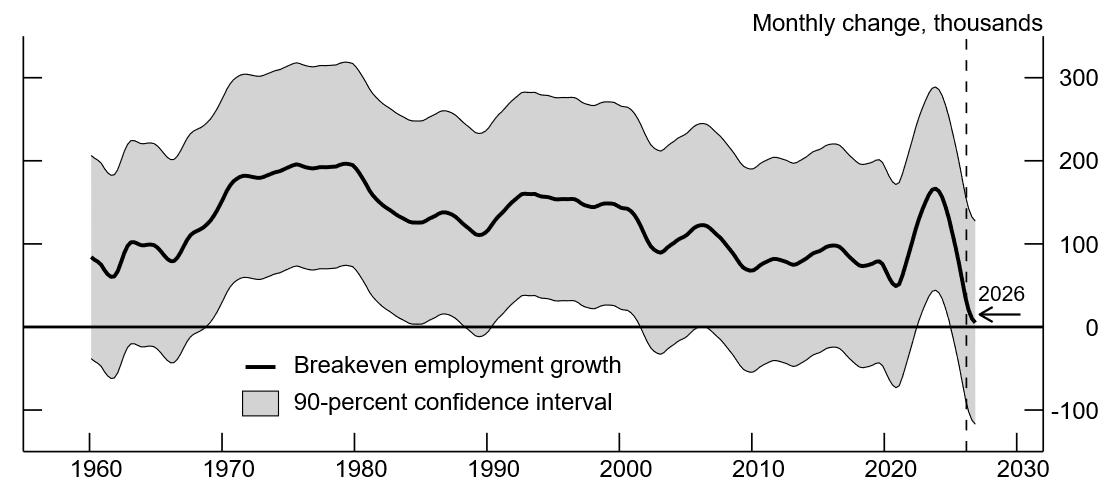
Note: The breakeven pace of employment growth is constructed using the change in the potential labor force, as shown in Figure 1, times one minus the noncyclical rate of unemployment from CBO (2026) (see Appendix C for more details). The 90-percent confidence interval is derived from the BLS's estimate of the standard error in its measure of the change in total payroll employment (see BLS 2026).
The breakeven pace has varied considerably over time—averaging as much as 185,000 jobs per month during the 1970s—as the steady increase in women's labor force participation and the entry of the baby boomers into the workforce boosted labor force growth—and as little as 80,000 jobs per month during the 2010s—as population growth slowed and the baby boomer cohort started retiring from the labor force in greater numbers. The pandemic caused the breakeven pace to fall to its lowest point over (at least) the last 65 years, to just 50,000 jobs per month in late 2020. The monthly breakeven pace subsequently rose to 155,000 in 2023-24 due to a surge in net immigration, but fell to an estimated 85,000 in 2025 as net immigration slowed significantly.4
The breakeven pace in 2026 could be significantly lower than even the historic low reached during the pandemic. As discussed above, the rapid slowing of net immigration may translate into such a large drop in labor force growth that the breakeven pace could fall to nearly zero, requiring less than 10,000 new jobs per month in 2026. As Figure 2 shows, this near-zero pace of breakeven job growth is substantially lower than at any point in the past 65 years.
One important implication of a near-zero breakeven pace is that, even if the output of the U.S. economy (GDP) is growing at the same pace as potential output (potential GDP), employment growth in any given month is almost as likely to be negative as it is to be positive.5 Furthermore, these negative prints of job growth could be large in any given month. The gray shaded area in Figure 2 shows the 90-percent confidence interval of total employment growth based on the BLS's estimate of the standard error of monthly payroll employment growth from their establishment survey (BLS (2026)). This 90-percent confidence interval implies that it would not be unusual for there to be one or more months in 2026 with declines in total payroll employment as large as -100,000 jobs, even if economic output was growing at the rate of potential output growth.
Implications for potential GDP growth
Near-zero labor force growth also has important implications for potential GDP growth. Potential GDP represents the amount of real GDP that can be produced if domestic inputs of labor and capital are employed at their maximum sustainable rates.6 Potential GDP grows over time through two mechanisms: either changes in potential employment or growth in the average productivity of each worker.7
Figure 3 shows the CBO's estimate of Q4/Q4 growth in potential GDP (the horizontal red lines) from 1960-2025, which has grown by an average of 3 percent per year over this 65-year period. The blue bars show what portion of this potential output growth can be attributed to changes in the potential employment measure described above. The gray bars, which are simply the difference between the CBO's measure of potential GDP growth and our derived measure of potential employment growth, are the contribution to potential GDP growth attributable to labor productivity growth.8
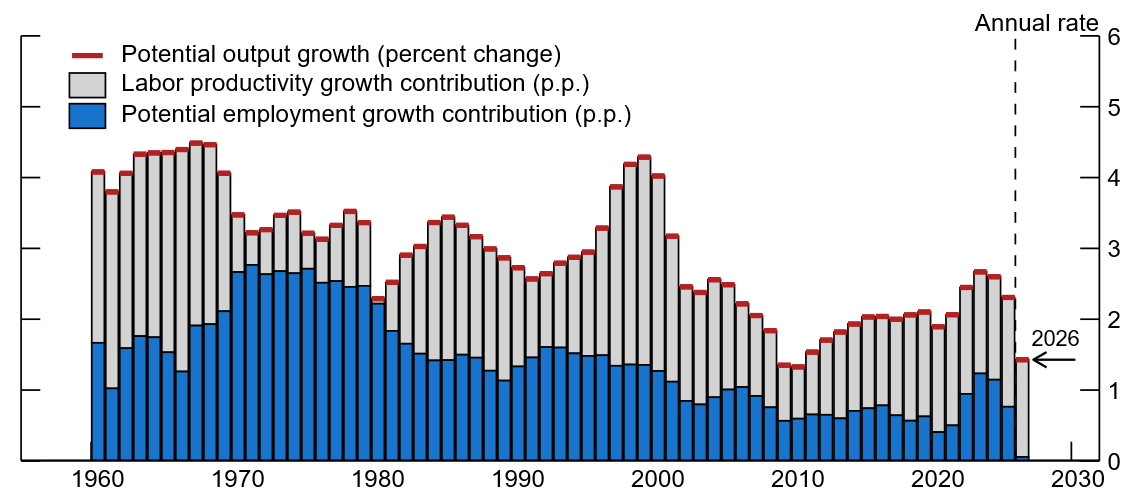
Note: Labor productivity is the ratio of the CBO's estimate of potential output and either our constructed measure of potential employment (from 1960-2025) or the CBO's estimate of potential employment (in 2026). Our constructed measure of potential employment is the product of the labor force measure shown in Figure 1 and the potential employment rate implied by the noncyclical rate of unemployment from CBO (2026). Potential GDP growth (from 1960-2025) is the Q4/Q4 percent change in the estimate of potential GDP from CBO (2026). In 2026, potential GDP growth is the sum of the contributions from our measure of potential employment growth and the growth in the CBO's implied measure of labor productivity—specifically, the ratio of its measures of potential output and potential employment. The key identifies bars in order from top to bottom.
As the figure shows, historically, growth in both potential employment and labor productivity have been important contributors to potential GDP growth. Between 1960 and 2025, potential employment growth has contributed about 1.4 percentage points to the average annual growth of potential GDP, with the remainder being due to growth in productivity. Moreover, most of the growth in potential employment over this extended period has been driven by growth in the labor force due to population growth.9
The rightmost bar in Figure 3 shows that, for 2026, our constructed estimate of potential employment growth (the blue bar) is projected to be nearly zero—reflecting the very weak growth in the potential labor force discussed above. Thus, any growth in potential GDP this year would then need to come from productivity growth.10 As Figure 3 makes clear, this would represent a significant departure in the composition of economic growth from recent history.
Concluding remarks
Labor force growth has slowed significantly in the past two years and could be near-zero this year. This note highlights two significant implications of near-zero labor force growth: (i) Breakeven employment growth would also be near-zero—such that, if the unemployment rate is relatively constant, then negative job growth would be almost as likely as positive job growth in any given month. (ii) Any growth in potential GDP will need to come entirely from labor productivity growth. These two features would represent a significant shift in U.S. labor market dynamics and the composition of economic growth. Furthermore, looking beyond this year, the demographic forces weighing on labor force growth are slow-moving and unlikely to change soon—and substantial changes in net immigration also seem unlikely. As a result, near-zero labor force growth may become the new norm for some time—along with the implications highlighted in this note.
References
Bureau of Labor Statistics, Current Employment Statistics (BLS 2026). "All Employee Standard Error Tables." Accessed: 2026-03-25.
Coglianese, John, Seth Murray, and Christopher J. Nekarda (2025). "Harmonized Population and Labor Force Statistics," FEDS Notes. Board of Governors of the Federal Reserve System, August 2025.
Congressional Budget Office (CBO 2026). "Historical Data and Economic Projections (ZIP)," February 2026.
Edelberg, Wendy, Stan Veuger, and Tara Watson (2026). "Macroeconomic Implications of Immigration Flows in 2025 and 2026: January 2026 Update," Research Note. Brookings Institution, January 2026.
Gregory, Victoria, and Alexander Bick (2025). "Breakeven Employment Growth: A Simple but Useful Benchmark," On the Economy Blog. Federal Reserve Bank of St. Louis, April 15, 2025.
Shackleton, Robert (2018). "Estimating and Projecting Potential Output Using CBO's Forecasting Growth Model (PDF)," Working Paper Series. Congressional Budget Office, March 2018.
U.S. Census Bureau, Population Estimates Program Staff (2026). "New Population Estimates Show Historic Decline in Net International Migration," Random Samplings blog.
Appendix A: Construction of the population measure
Measuring the civilian noninstitutional population ages 16 or older
When constructing measures of aggregate labor force outcomes, the relevant measure of the population is the civilian noninstitutional population ages 16 or older (the "CNI 16+ population") because this measure includes U.S. residents aged 16 or older who are not on active duty in the Armed Forces and are not inmates of institutions such as prisons, jails, or residential care facilities.
In order to ensure that our measure of the CNI 16+ population uses the latest publicly available historical data, we rely on the harmonized estimates of the CNI 16+ population from Coglianese, Murray, and Nekarda (2025) (PDF) for the period from January 1960 through December 2024. These estimates are based on vintage 2024 population estimates from the Census Bureau, which are also what the BLS used to produce its estimates of monthly population growth in 2025, which we use for our measure of the CNI 16+ population from January 2025 through December 2025.
Starting in January 2026, the BLS's estimates of the CNI 16+ population switched to using the Census Bureau's vintage 2025 estimates of the population, for which the underlying demographic details are not yet publicly available. However, the BLS publishes a report (PDF) describing the implications of the new vintage 2025 population data. This report includes an estimate of the December 2025 CNI 16+ population if the BLS were to use the vintage 2025 population estimates instead of the vintage 2024 estimates. In order to construct the monthly change in the CNI 16+ population for January and February 2026, we use the vintage 2025 estimates of the December 2025 population as the population base from which these changes are calculated (as well as the implied annualized percent change in the CNI 16+ population during the first two months of 2026).
This approach indicates that the CNI 16+ population grew by about 90,000 per month in both January and February 2026, according to the Census Bureau's vintage 2025 population estimates. These monthly changes would imply an annualized population growth of 0.4 percent in 2026.11
Adjusting for alternative estimates of net immigration
The Census Bureau's vintage 2025 population estimates assume that net immigration will add about 320,000 to population growth in 2026 (Census Bureau (2026)). When developing this forecast of net immigration for 2026, the Census Bureau followed its standard practice of relying primarily on the 2024 American Community Survey (ACS) to develop estimates of immigration and emigration. However, the Census Bureau adjusted the ACS-based emigration estimate to incorporate information available as of mid-summer 2025 on repatriations (from the Department of Homeland Security), changes in the foreign-born share of the population (from the Current Population Survey), and estimates of the number of Mexicans who returned to Mexico after having lived in the U.S. last year (from Mexico's National Survey of Occupation and Employment).12
In Edelberg et al. (2026), the Brookings Institution used more up-to-date information on immigrant inflows and outflows to project that the contribution of net immigration to population growth would likely be between -925,000 to +185,000 in 2026.13 In this note, we consider the scenario where net immigration falls in the mid-point of this range (-370,000), which would imply a downward revision of -690,000 to the Census Bureau's vintage 2025 estimate of net immigration in 2026 (the "immigration surprise").
As the net immigration estimates from both the Census Bureau and the Brookings Institution are for immigrants of all ages, we must first construct a net immigration estimate for the ages 16 or older. To do so, we use the CBO's estimates of the age composition of immigrant inflows and outflows for calendar year 2026 to estimate that immigrants aged 16 or older will account for over 90 percent of the immigration surprise.14 This adjustment to use the net immigration estimate from the Brookings Institution implies that the pace of growth in the CNI 16+ population was a bit under 40,000 per month in early 2026—which is an annualized rate of growth of less than 0.2 percent.
Appendix B: The CBO's estimate of the potential labor force participation rate
Our measure of the potential LFPR comes from the most recent vintage of the Congressional Budget Office's Historical Data and Economic Projections (CBO (2026)). As part of these Economic Projections, the CBO produces an estimate of the potential labor force participation rate (LFPR) at a quarterly frequency, which we use in this note. The black line in Figure B.1 shows the CBO's latest estimates of potential LFPR over the period from 1960 to 2026. Potential LFPR has tended to change gradually over time as the result of slow-moving structural factors. See the discussion in footnote 4 of the main text.
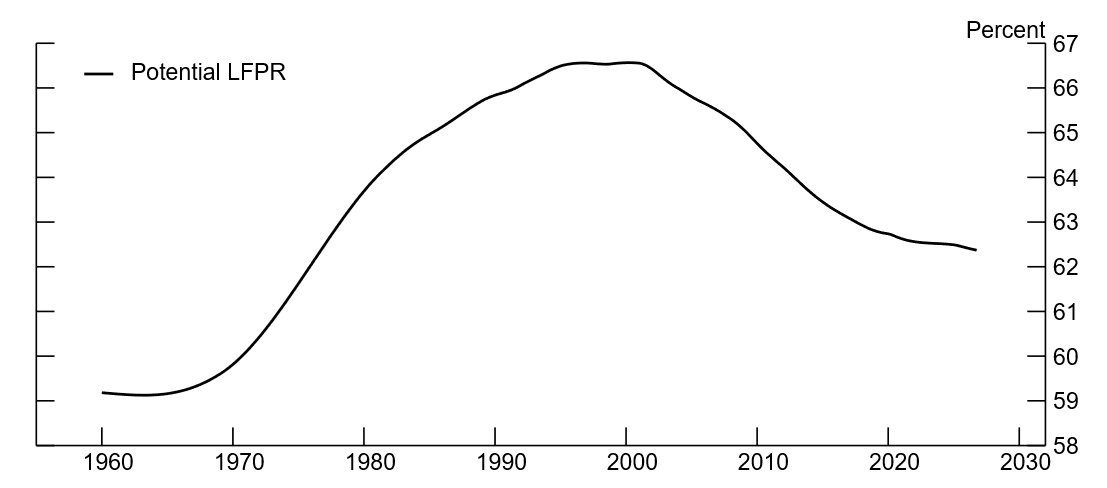
Note: The potential LFPR shown here is from CBO (2026).
Appendix C: Calculation of the breakeven pace of employment growth
The breakeven pace of employment growth is defined as the number of jobs that must be added to the economy to keep the unemployment rate at a particular target level, given labor force growth.15 More specifically,
$$$$\text{Breakeven pace}_t = \Delta \text{Potential labor force}_t ~ * ~ \left(1 - \text{Target unemployment rate}_t\right)$$$$
The target unemployment rate in the expression above is typically set to either the current unemployment rate or the noncyclical unemployment rate. Currently, the unemployment rate is near many forecasters' estimates of its noncyclical level—so this choice makes very little difference. (Indeed, the CBO's estimate of the noncyclical unemployment rate currently is 4.4 percent—the same as the February 2026 reading of the unemployment rate, see CBO (2026).)
Measurement of the change in the potential labor force
The change in the potential labor force can be decomposed into the following two components:
$$$$\Delta \text{Potential LF}_t = \Delta \text{Population}_t ~ * ~ \text{Potential LFPR}_t ~ + ~ \Delta \text{Potential LFPR}_t ~ * ~ \text{Population}_{t-1}$$$$
For our measure of the breakeven pace, we construct a 13-month centered moving average of our estimate of the CNI 16+ population level (described in Appendix A), so as to smooth through much of the month-to-month volatility in the population series.
No such smoothing was necessary for the potential LFPR series since, as shown by Figure B.1, changes in the CBO's estimate of potential LFPR occur only gradually.
Uncertainty in our measure of the breakeven pace of employment growth
Outside of periods of significant economic upheaval, the breakeven pace of employment growth is expected to evolve gradually over time. As a result, we smooth the quarterly estimate of the breakeven pace using a 5-quarter centered moving average. This eliminates much of the quarter-over-quarter volatility in our estimate of the breakeven pace.
While we provide point estimates for the breakeven pace, breakeven estimates are inherently subject to significant uncertainty—especially in real time. It's generally more appropriate to provide a range of plausible values rather than a single number. This uncertainty stems from several factors. For example, as already discussed, the breakeven pace relies on estimates of immigration and population growth, which are often based on limited real-time information and can revise substantially.
Additionally, monthly payroll and labor force growth data come from different BLS surveys—one of establishments, the other of households. These surveys cover somewhat different employment concepts and use distinct sampling and measurement procedures. These differences can result in different cyclical properties in the establishment survey, which measures jobs filled, and the household survey, which measures employed individuals. For instance, multiple job holding tends to be more common in tighter labor markets—resulting in a boost in the number of jobs filled, but having no effect on the number of employed individuals.
All these factors can contribute to the imprecision of breakeven estimates, underscoring the need for caution when interpreting single-point estimates.
1. By definition, the labor force excludes any non-employed individuals over the age of 16 who are not actively looking for work—such as retirees, students, and discouraged workers. Return to text
2. The relevant measure of the population for the labor force, and the measure we refer to as "the population" in this note, is the civilian noninstitutional population ages 16 or older. Our estimate of this population is the combination of: the harmonized population from Coglianese, Murray, and Nekarda (2025) for the period from 1960-2024, the published population series from the BLS for 2025, and, for 2026, the authors' calculation based on the BLS's published and revised population for 2026 and the net international migration estimates from the Census Bureau (2026) and Edelberg et al. (2026) (see Appendix A for more details). Return to text
3. The CBO's estimate of potential LFPR from 1960 to 2026 is shown in Appendix figure B.1. Changes in potential LFPR—which determine the contributions shown in Figure 1—have varied significantly over time, driven by slow-moving structural factors. In particular, potential LFPR increased from the late 1960s until around 2000, boosted by the influx of women into the labor market and the entry of the baby boom generation into their prime working years. Starting around 2000, potential LFPR started trending down, driven largely by an aging population (especially after 2007 or so when the baby boomers began entering their retirement years) and a structural decline in the participation rate of some workers under age 55 (primarily men)—reflecting a reduced demand for some skillsets due to widespread adoption of some labor-replacing technologies and increased globalization. These data come from CBO (2026). Return to text
4. While we provide point estimates for the breakeven pace, breakeven estimates are inherently subject to significant uncertainty—especially in real time. It's generally more appropriate to provide a range of plausible values rather than a single number. See Appendix C for more details on some of the factors that contribute to the imprecision of breakeven estimates. Return to text
5. This tendency of negative payroll growth being almost as likely as positive payroll growth in any given month may not be immediately apparent in the BLS's initial estimates of payroll growth. In recent years, the initial published estimates of payroll employment growth have tended to be revised down when the BLS produces its annual benchmark revision that incorporates administrative data from the Quarterly Census of Employment and Wages. For instance, the most recent benchmark revision to payroll employment (see https://www.bls.gov/web/empsit/cesbmart.htm) revised down the monthly pace of payroll employment growth by 71,000 per month over the period from April 2024 to March 2025. If labor force growth is near zero but the initial estimates of payroll growth continue to be biased upwards, then these initial estimates would be more likely to be positive on average. However, upon publication of the annual benchmark revision, the downward revisions to payroll employment growth would make negative employment growth almost as likely as positive employment growth in the post-benchmark estimates of payroll employment growth. Return to text
6. We use the definition of potential output from Shackleton (2018), as this note uses the CBO's estimate of potential output from the CBO's February 2026 Economic Projections (CBO (2026)). Return to text
7. Note that GDP (actual or potential) can be decomposed as GDP = (GDP/EMP)*EMP, where EMP is employment and GDP/EMP is output per worker—the measure of labor productivity that we focus on in this note. As this decomposition shows, GDP growth must come from either employment growth or productivity growth. Return to text
8. As noted above, our measure of labor productivity is output per worker. An alternative measure would be output per work hour, where GDP is decomposed as GDP = (GDP/HRS)*HRS, and HRS is aggregate work hours (which are defined as the total level of employment times the average hours worked per worker). For the purposes of this note, using output per worker or per hour as the productivity measure makes very little difference. Return to text
9. Potential employment growth is also influenced by changes in the potential LFPR and the noncyclical rate of unemployment. Although contributions to potential employment from potential LFPR were positive up to 2000, since then they have been mostly negative. Additionally, the noncyclical rate of unemployment generally exhibited less substantial trend movements since 1960. As a result, changes in the potential LFPR and the noncyclical rate of unemployment have, on net, had little effect on the 65-year average of potential employment growth. Return to text
10. Note that for 2026, the black line in the figure is the sum of our estimate of potential employment growth and the CBO's projection of growth in potential output per worker. Return to text
11. Historically, the average monthly population change within a calendar year has tended to be about 20 percent higher than the pace of population growth in the first two months of the year. It is unclear whether this historical pattern will also apply to population growth in 2026 given the timing of the decline in net immigration. However, if population growth were to follow this historical pattern, and thus become stronger over the course of 2026, then this might boost the monthly change in the labor force growth by only about 10,000-15,000 in 2026, relative to the estimate presented in this note. Return to text
12. For more details on the adjustments that the Census Bureau made to its estimates of emigration see Census Bureau (2026). Return to text
13. There are likely a number of reasons why the upper bound of the estimated range from the Brookings Institution is below the Census Bureau's estimate of net immigration in 2026. On the immigrant inflow side, Brookings is projecting a decline from 2025 to 2026 in inflows of immigrants with lawful permanent resident status due to visa bans that were put in place in the second half of 2025—after the Census Bureau had to develop their estimate of net immigration. These visa bans also led Brookings to lower its estimate of inflows of immigrants with temporary visas in 2026 (relative to 2025). On the immigrant outflow side, Brookings is projecting increases in ICE removals and voluntary departures of immigrants—reflecting both data on removals showing rising ICE removals through November 2025 and the anticipated effects of the increased ICE and CBP funding from the One Big Beautiful Bill Act enacted last summer. For more details on the Brookings Institution's estimates of net immigration, see Edelberg et al. (2026). Return to text
14. The CBO publishes estimates of immigrant inflows and outflows by age-sex-immigrant status, which are published as supporting documents to the CBO's 2026 Demographic Outlook. These estimates are available for download at https://www.cbo.gov/system/files/2026-01/57059-2026-01-Demographic-Projections.zip (ZIP). We further assume that the Brooking Institutions' projected number of immigrant removals in 2026 will only be adults—as children are only very rarely held in detention by ICE. Return to text
15. For example, see Gregory and Bick (2025). Return to text
Murray, Seth, and Ivan Vidangos (2026). "Labor force growth, breakeven employment, and potential GDP growth," FEDS Notes. Washington: Board of Governors of the Federal Reserve System, April 02, 2026, https://doi.org/10.17016/2380-7172.4045.
Disclaimer: FEDS Notes are articles in which Board staff offer their own views and present analysis on a range of topics in economics and finance. These articles are shorter and less technically oriented than FEDS Working Papers and IFDP papers.