FEDS Notes
September 25, 2017
Labor Market Outcomes in Metropolitan and Non-Metropolitan Areas: Signs of Growing Disparities
The U.S. unemployment rate has fallen steadily since 2010, indicating broad-based improvement in the labor market. However, disaggregated measures reveal divergences between regions and types of workers. Specifically, adults in non-metropolitan areas are more likely to be unemployed or out of the labor force compared to adults in metropolitan areas, especially when one considers the non-college population. Over the last decade, less-educated adults experienced larger increases in their employment rates, but lower wage growth, in metropolitan compared to non-metropolitan areas.
1. Background
Before looking at labor market outcomes, it is helpful to characterize some of the differences between metropolitan and non-metropolitan areas. A metropolitan area is a county or set of counties with strong commuting ties to a large urbanized center, whereas a non-metropolitan area is a county that lacks such ties. Although non-metropolitan counties outnumber metropolitan ones, only a small share of the U.S. population lives in non-metropolitan areas. In the late 1990s, around 20 percent of adults lived in non-metropolitan areas but that share is now below 15 percent.2
Demographically, non-metropolitan areas tend to have older populations than metropolitan areas. In particular, non-metropolitan areas have lower shares of prime-age adults (ages 25-54) and higher shares of adults ages 55 and older. Non-metropolitan areas also tend to have lower levels of educational attainment: in 2017, half of prime-age adults in non-metropolitan areas had no more than a high school education compared to only a third of prime-age adults in metropolitan areas. Recognizing these differences, my initial analysis focuses on labor market measures for the prime-age population and my subsequent analysis disaggregates these measures by educational attainment.
2. Recent disparity in unemployment rates
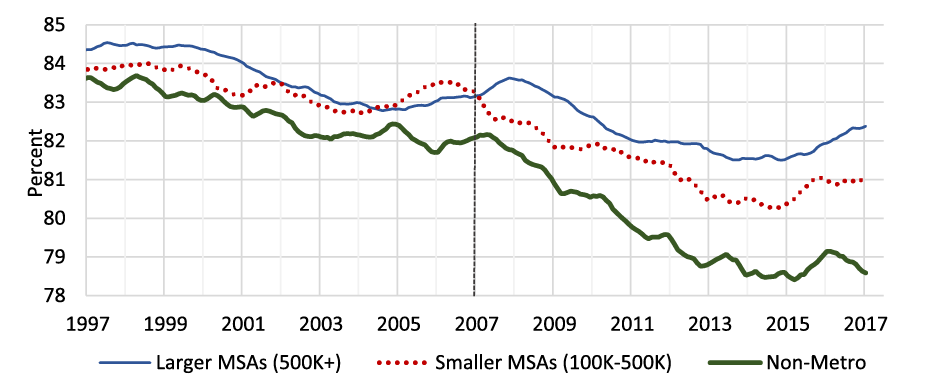
To begin, I compare prime-age unemployment rates in non-metropolitan areas to those in larger and smaller MSAs. Chart 1 displays these three unemployment rates tabulated from Current Population Survey (CPS) microdata.

Source: Author's calculations based on CPS data. 12-month centered moving averages. Gridlines denote July.
Chart 1 shows that the three unemployment rates usually move together over time, although the unemployment rate in large MSAs tends to be more cyclical (i.e. higher in recessions and lower in expansions) relative to the unemployment rate in non-metropolitan areas. The chart also reveals a particularly striking divergence in these three measures after 2015.
Chart 2 divides the prime-age population by educational attainment and shows "unemployment rate gaps", defined as the unemployment rate in non-metropolitan areas minus the unemployment rate in metropolitan areas.
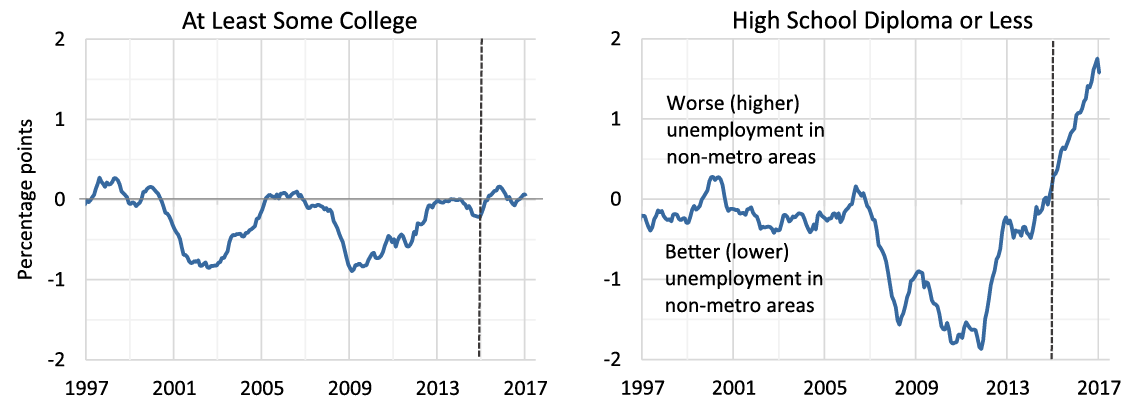
Source: Author's calculations based on CPS data. The left-hand panel includes those with graduate or professional degrees and anyone who enrolled in college or received an Associate's degree.
The left-hand panel of Chart 2 shows that the unemployment rate gap for workers with at least some college was close to zero over the last few years. In contrast, the right-hand panel shows that the gap for workers with a high school diploma or less has been positive since 2015, indicating that the unemployment rate of less-educated workers has been higher in non-metropolitan areas than in metropolitan ones.3 Remarkably, the positive unemployment rate gap after 2015 is only apparent for less-educated workers.
Although the unemployment rate divergence is fairly recent and concentrated in a small population of workers, this geographic disparity is a sign of imbalances and labor market inequities that may persist or widen over time. The next section highlights another disparity in employment affecting the same population of workers over a longer time horizon.
3. Decade-long divergence in participation rates
In addition to the recent divergence in unemployment rates, a further geographic difference in employment is apparent over the last decade: the labor force participation rate (LFPR) has declined much more in non-metropolitan areas than in metropolitan ones. Most recently, 21% of prime-age adults in non-metropolitan areas were classified as out of the labor force compared to 18% in metropolitan areas.
Chart 3 shows prime-age LFPR for all three geographic categories. All three exhibit a secular decline from 2007 onward, however, the gap between participation in metropolitan compared to non-metropolitan areas also widened substantially during that time. It is unlikely that differences in the age distribution by metropolitan status can explain the geographic disparity in participation because the prime-age category already excludes groups with generally low participation rates such as teenagers and young adults, who are more likely to be in school, and older adults, who are more likely to be retired.
Source: Author's calculations from CPS data. 12-month centered moving averages. Historical CPS data reveal that the current difference in LFPR between metropolitan and non-metropolitan area participation rates is the largest in the series' forty-year history.
Chart 4 divides the prime-age population by educational attainment and shows "participation rate gaps", defined as LFPR in metropolitan areas minus LFPR in non-metropolitan areas. The results indicate that the decade-long geographic divergence in LFPR also seems to be concentrated in less-educated adults, as was the case for the recent divergence in unemployment rates.
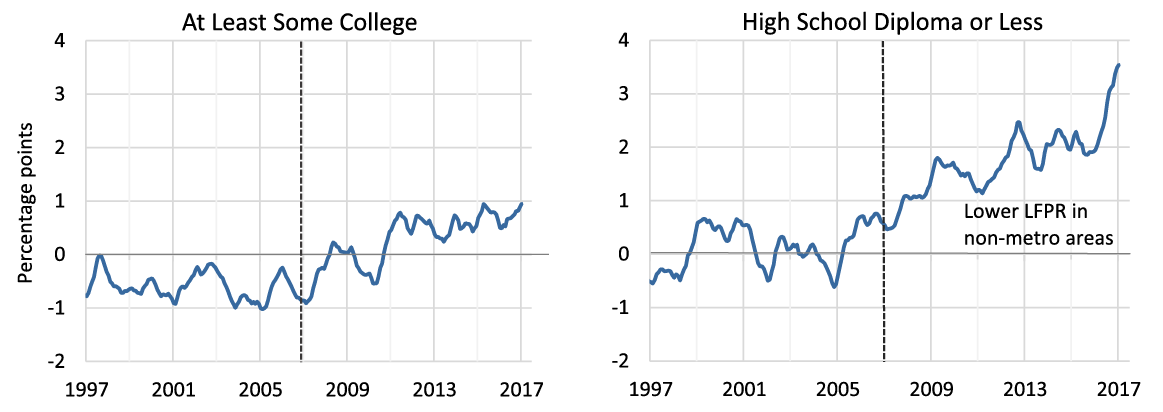
Source: Author's calculations based on CPS data.
The left-hand panel of Chart 4 shows that the LFPR gap of more-educated adults has been fairly stable over the last two decades, though it changed from mostly negative before 2011 to mostly positive thereafter. The right-hand panel shows that, for prime-age adults with a high school diploma or less, the LFPR gap stayed close to zero for many years before 2007 but grew increasingly large over the following decade. In other words, the participation rate of less-educated adults fell more in non-metropolitan areas than in metropolitan ones starting before 2007 and continuing through 2017. The LFPR divergence for less-educated men started in the late 1990s,4 whereas for less-educated women the divergence appears to be a more recent phenomenon.
The geographic divergences in aggregate participation and unemployment together led to a widening gap in the metropolitan versus non-metropolitan employment-to-population ratio over the last decade. To what extent have declining employment opportunities during and after the 2008 Recession contributed to these geographic disparities in unemployment and labor force participation? The next section uses wage data to examine the interaction between metropolitan status, employment, and labor demand.
4. Relative wages over time
If labor demand is a key driver of the decade-long employment divergence then wage growth in metropolitan areas should have outpaced non-metropolitan areas. In fact, the opposite pattern emerges: over much of the last decade, wage growth for less educated workers appears weaker in metropolitan than non-metropolitan areas. Using data from the Occupational Employment Statistics (OES), Chart 5 shows cumulative growth in average wages for higher- and lower-skilled workers by metropolitan status.
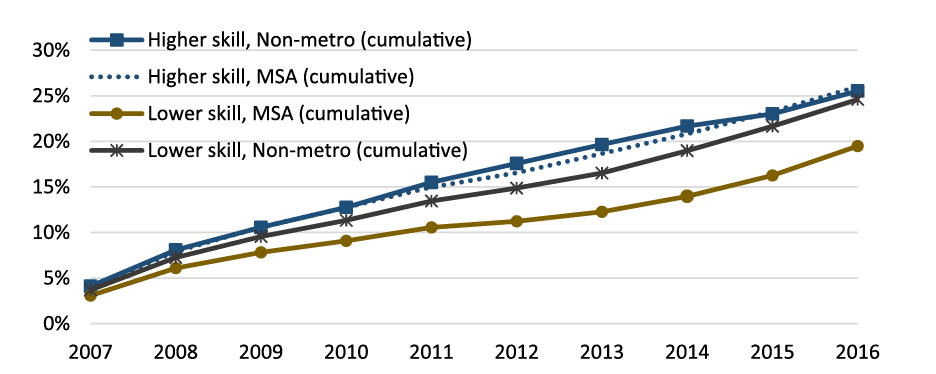
Source: Author's calculations using OES wages, reported annually in May. The results are based on average hourly wage data for MSAs and non-metropolitan areas, which are available for 2006-2016.5
Chart 5 reveals that average wage growth of lower-skilled workers in metropolitan areas lagged behind average wage growth of other workers over much of the last decade. These findings are based on nominal wages, as it is difficult to estimate real wages by skill level and metropolitan status. Nevertheless, if metropolitan areas experienced the same or higher price inflation than non-metropolitan areas, then the geographic disparity in lower-skilled workers' real wage growth would be even larger than the nominal figures show.
Another way of looking at the geographic dimension of wages is to calculate the premium that workers earn in metropolitan areas over time. Chart 6 shows this premium as the ratio of metropolitan to non-metropolitan wages by skill category.
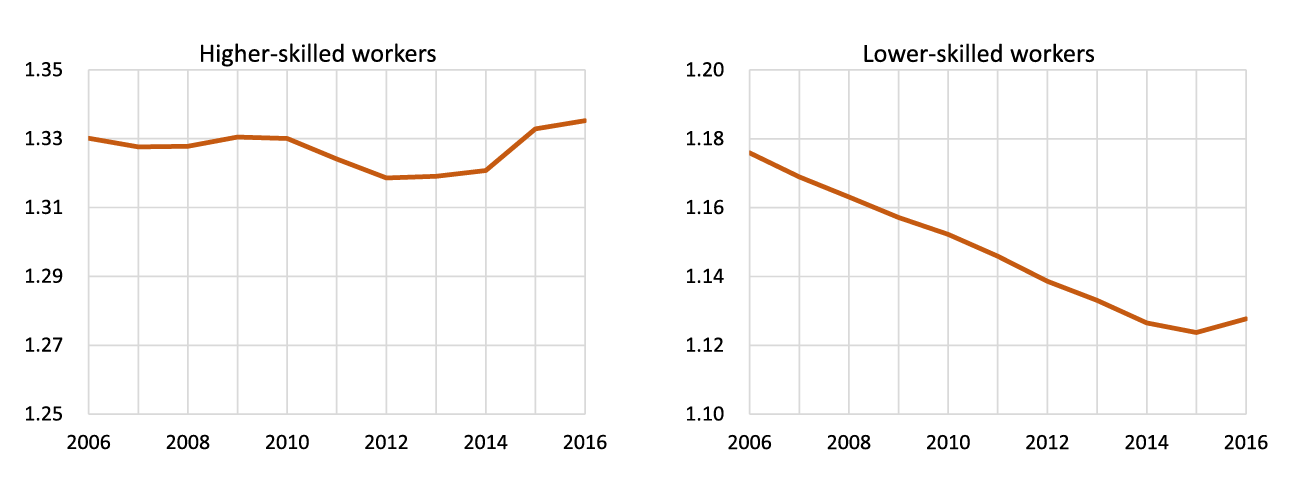
Source: Author's calculations based on OES average hourly wage data for metropolitan and non-metropolitan areas.
The left-hand panel of Chart 6 shows that, for higher-skilled workers, the metropolitan wage premium may have edged up recently but was generally around 33% in the 2006-2016 period. The right-hand panel reveals that the metropolitan wage premium for lower-skilled workers was about 18% in 2006 but had declined to just 13% by 2016.
Does the secular decline in the metropolitan wage premium of less-skilled workers indicate that a labor supply shock is responsible for the decade-long geographic divergence in participation? Maybe. The fact that wages for less-skilled workers grew more slowly in metropolitan areas than in non-metropolitan areas challenges the conventional narrative that weak labor demand in the 2008 Recession led to lower LFPR in non-metropolitan areas. However, an alternative explanation is that the characteristics of employed workers in metropolitan and non-metropolitan areas diverged a lot over the last decade. The next section looks at the metropolitan wage premium while controlling for many of workers' observable demographic and job-related characteristics.6
Wage regressions by worker characteristics
Based on findings in the previous section, here I use CPS data to explore geographic differences in workers’ wages over time. I estimate the following regression using hourly wages of all workers in 1996-2017, $$$$ y_{i,t} = {\theta_t I[M_{i,t}]} \times \psi_t + {\mu I[M_{i,t}]} + {\beta' X_{i,t}} + \alpha_j + \alpha_{occ} + \alpha_s + \psi_m + \psi_t + e_{i,t}$$$$ where $$y_{i,t}$$ is the log hourly wage of person i in a given month t, M takes the value of 1 if the worker is in a metropolitan area and X denotes demographic variables such as sex, age, age squared, marital status, race, and education. The variables $$\alpha_j$$, $$\alpha_{occ}$$ and $$\alpha_{state}$$ denote industry-level, occupation-level and state-level fixed effects, respectively. Month and year fixed effects ($$\psi_m$$ and $$\psi_t$$) are also included in the regression.
Chart 7 displays estimates of $$\theta_t$$, the time-varying marginal effect of metropolitan status on wages in the regression above, based on CPS data for workers with high school or less education.
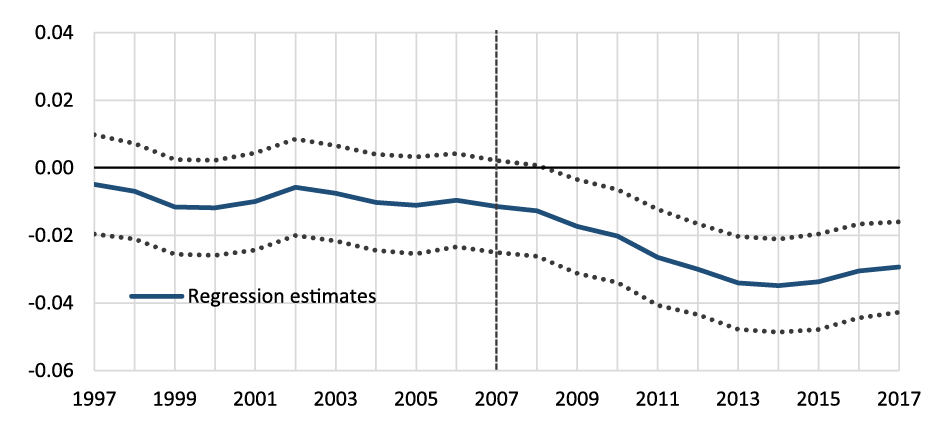
Source: Author's calculations from CPS hourly wages. Three-year centered moving averages are shown. Wage data for all workers are winsorized at the 5% and 95% levels by date; standard errors are clustered by date and metropolitan status.
The results in Chart 7 confirm that there has been a statistically significant decline in the metropolitan wage premium of less-educated workers, even after controlling for demographic characteristics, state of residence, occupation, and industry.7 It is striking that, although the CPS data are completely separate from the OES data used in the previous section, the patterns in Chart 7 look very similar to those in the right-hand panel of Chart 6. Both graphs show a decline during and immediately after the recession and a small uptick around 2016.
As a comparison, Chart 8 displays regression estimates of $$\theta_t$$ for more-educated workers in the CPS.
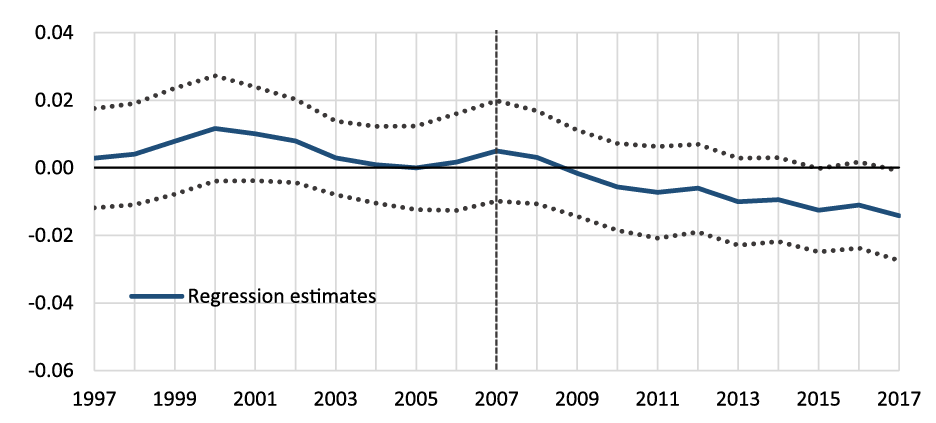
Source: Author's calculations from CPS hourly wages. Three-year centered moving averages are shown.
The results in Chart 8 show that, after controlling for demographics and other factors, the metropolitan wage premium for more-educated workers may have declined a bit recently, in contrast to the OES-based patterns in the left-hand panel of Chart 6. Nevertheless, both data sources suggest that less-educated workers experienced significant declines in their metropolitan wage premium since 2007 or earlier.
5. Conclusion and discussion
This note documents two geographic disparities in the U.S. labor market. The first is a divergence in unemployment rates that has emerged between metropolitan and non-metropolitan areas over the last two years. The second is a divergence in labor force participation rates that has emerged between metropolitan and non-metropolitan areas over the last decade. Both have led to lower employment rates in non-metropolitan relative to metropolitan areas, particularly for less-educated workers.
These geographic divergences raise several questions. First, are non-metropolitan areas stagnating or metropolitan areas overheating? Second, why haven't these disparities self-corrected; are interstate and intercounty migration patterns partly responsible? And third, what is the role of labor demand and labor supply? Regarding this final question, while employment was more plentiful for lower-skilled workers in metropolitan areas, the prima facie evidence shows that their wage gains appeared to lag behind wage gains experienced by other workers over the last decade. Unless there is another explanation for the declining metropolitan wage premium, the patterns documented in this note suggest that labor supply may have been a main driver of the geographic divergence in participation.
Bibliography
Bureau of Economic Analysis, U.S. Department of Commerce, "Total Full-Time and Part-Time Employment by NAICS Industry", Local Area Personal Income and Employment, accessed August 2017, https://www.bea.gov/iTable/index_regional.cfm
Bureau of Labor Statistics, U.S. Department of Labor, Occupational Employment Statistics, accessed August 2017
Bureau of Labor Statistics, U.S. Department of Labor, Current Population Survey, accessed August 2017
IPUMS-CPS, University of Minnesota, "Metropolitan Area Codes: May 2014 Onward", available at https://cps.ipums.org/cps/codes/metfips_2014onward_codes.shtml
Office of Management and Budget, Executive Office of the President, July 15, 2015, "Revised Delineations of Metropolitan Statistical Areas, Micropolitan Statistical Areas, and Combined Statistical Areas, and Guidance on Uses of the Delineations of These Areas", available at https://obamawhitehouse.archives.gov/sites/default/files/omb/bulletins/2015/15-01.pdf
1. The author thanks Lael Brainard, Andrew Figura, Felix Galbis-Reig, Paolo Ramezzana, and Christopher Smith for helpful comments and suggestions. Return to text
2. Based on Current Population Survey microdata. I define metropolitan areas as Metropolitan Statistical Areas (MSAs) or Core Based Statistical Areas (CBSAs) with at least 100,000 residents. The survey implemented some changes to metropolitan area boundaries over the May 2014 to July 2015 period; see OMB (2015) and IPUMS-CPS (2014). Return to text
3. The share of less-educated prime-age adults in non-metropolitan areas is higher than in metropolitan areas. As a result, the aggregate unemployment rate gap over the last year is approximately 1 percentage point, about 1/4 percentage point wider than a simple average of the two gaps illustrated in Chart 2. Return to text
4. The divergence is particularly striking for less-than-high-school educated men, who comprise 10-15% of the prime-age male populations in metropolitan and non-metropolitan areas. Return to text
5. The OES is not directly comparable to the measures discussed earlier. In particular, the OES reports workers' occupations but not their education and the geographic categories are determined by the MSA status of employers. In this analysis, occupational groups 1 and 2 are defined as "Higher skill" and groups 3-5 are defined as "Lower skill". These higher-skill occupations constitute only 25% of the non-metropolitan workforce and 30% of the metropolitan workforce. Return to text
6. The analysis does not control for other changes in worker quality or for changes in the attractiveness of metropolitan areas relative to non-metropolitan areas over time. Return to text
7. Relatedly, I find that both metropolitan and non-metropolitan areas experienced declines of around 10% in their manufacturing employment over the 2007-2015 period (the manufacturing share of employment in 2015 was 6% and 11% in metropolitan and non-metropolitan areas, respectively). From 2007-2010, manufacturing accounted for 40% and 45% of the employment decline in metropolitan and non-metropolitan areas, respectively. Data source: Bureau of Economic Analysis. Return to text
Weingarden, Alison (2017). "Labor Market Outcomes in Metropolitan and Non-Metropolitan Areas: Signs of Growing Disparities," FEDS Notes. Washington: Board of Governors of the Federal Reserve System, September 25, 2017, https://doi.org/10.17016/2380-7172.2063.
Disclaimer: FEDS Notes are articles in which Board staff offer their own views and present analysis on a range of topics in economics and finance. These articles are shorter and less technically oriented than FEDS Working Papers and IFDP papers.