


FEDS Notes
August 19, 2026
Liquidity Transformation Risks in U.S. Bank Loan and High-Yield Mutual Funds: A 2026 Update
Kenechukwu Anadu, Sean Baker, Fang Cai, Logan George, and Erik Larsson1
1. Introduction
Mutual funds (MFs) and other open-ended collective investment funds engage in liquidity transformation—they offer investors daily redemptions while investing in assets that may take longer than a day to sell without significant price impact. This activity is particularly salient for corporate debt funds, where large investor redemptions during stress periods could result in fire sales that adversely affect underlying markets (see, e.g., Goldstein, Jiang, and Ng, 2017; Chernenko and Sunderam, 2020; Falato, Goldstein, and Hortaçsu, 2021; Federal Reserve Board, 2025).
Using MF holdings data reported on the Securities and Exchange Commission's (SEC) Forms N-Q and N-CSR, Anadu and Cai (2019) developed a simple liquidity and illiquidity ratio for monitoring the liquidity characteristics of the largest bank loan (BL) and high-yield corporate (HY) MFs.2 They showed that, from 2007 to 2019, the average BL MF increased its holdings of illiquid assets, while maintaining relatively stable liquid assets. In contrast, the average HY MF's illiquid assets declined modestly, while its liquid assets remained roughly unchanged.
In this note, using the more granular SEC Form N-PORT data, which replaced N-Q in 2020, we update the liquidity monitoring metrics from Anadu and Cai (2019) in several ways. First, we increase the fund coverage substantially to all BL and HY MFs.3 Second, we expand the numerator of the liquidity ratio from cash and cash equivalents to also include U.S. Treasury Bills (T-Bills) and Short-Term Investment Vehicles (STIVs).4 Finally, we examine MF net flows by ex-ante liquidity ratio levels during two stress episodes: the April 2025 tariff shock and the March 2020 onset of the pandemic. This flow analysis helps us better understand whether precautionary liquidity management practices at these MFs help mitigate redemption risks.
We show that the median liquidity ratios for BL and HY MFs have remained relatively stable in recent years. The median illiquidity ratio for BL MFs has risen to near the levels last observed during the pandemic; the analogous ratio for HY MFs has declined since the pandemic. For BL MFs specifically, this dynamic—stable liquidity ratios amid rising illiquidity ratios—suggests increased liquidity transformation risk, on balance. To be sure, our illiquidity measure (Level 3 assets) captures only one extreme dimension of illiquidity, rather than the full illiquidity profile of a fund's portfolio. Thus, these measures provide only a partial view of portfolio liquidity.
Following the April 2 "Liberation Day" announcement, both BL and HY MFs with above-median liquidity ratios ex-ante experienced larger weekly outflows than those with below-median liquidity ratios, on average.5 This pattern is broadly consistent with the literature on MFs — particularly those holding illiquid assets or facing large outflows — strategically manage liquidity, including by holding higher liquid assets, to avoid fire sales (see, e.g., Chernenko and Sunderam, 2016).
March 2020, however, showed a reverse pattern for BL MFs: those with above-median liquidity ratios ex-ante experienced lower monthly net outflows. Nonetheless, this, too, is consistent with pandemic-era empirical evidence on MF redemption dynamics (see, e.g., Claessens and Lewrick, 2021; Hespeler and Suntheim, 2020). These contrasting observations suggest that the relationship between an MF's liquidity characteristics and redemption patterns is somewhat conditional on the nature of the market stress.
The rest of this note proceeds as follows. Section 2 describes the growth of HY and BL MFs since 2020. Section 3 presents analysis of the liquidity and illiquidity ratios of HY and BL MFs. Section 4 examines MF net flows by liquidity characteristics in April 2025 and March 2020. We conclude in Section 5.
2. Size of BL and HY MFs
Figure 1 reports the net assets in BL and HY MFs. From 2019 Q4 to 2025 Q4, BL MFs' net assets declined by $19 billion (21 percent) to $71 billion (Panel A). In contrast, HY MFs' assets rose by 13 percent to $263 billion (Panel B).6
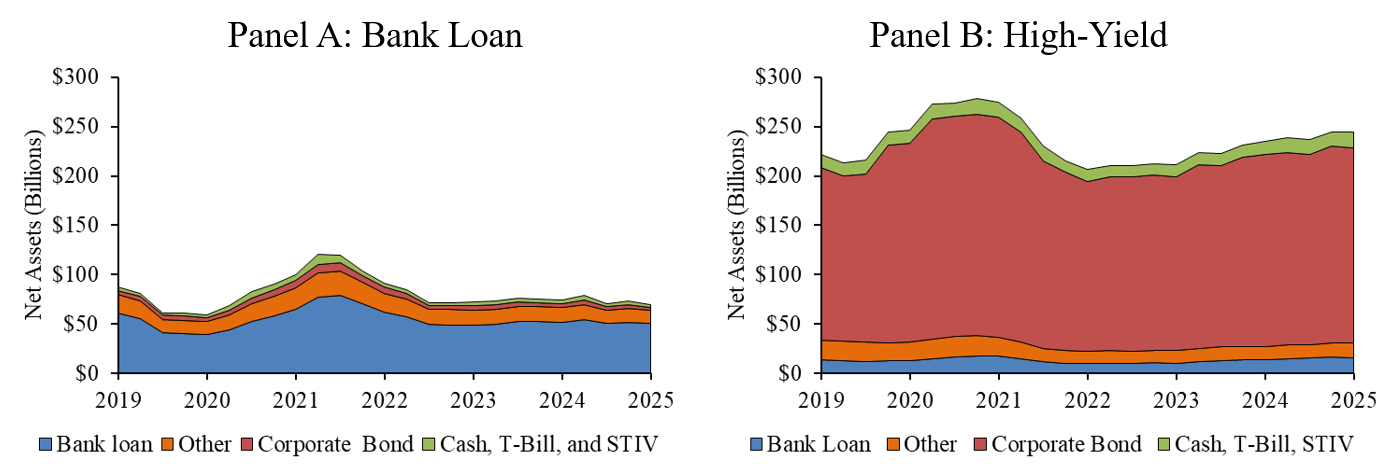
Notes: The figure shows the net assets for bank loan and high-yield mutual funds by asset type. Key identifies series in order from bottom to top.
Sources: SEC Form N-PORT.
Consistent with their investment strategies, BL and HY MFs invest primarily in bank loans and non-investment-grade corporate bonds, respectively—relatively illiquid asset classes.7 However, both fund types hold relatively small fractions of liquid assets, such as cash and T-Bills. This combination of illiquid or less liquid securities and limited liquid assets could create potential challenges when funds face large redemption pressures.
Next, we examine the trends in liquidity and illiquidity ratios for these funds.
3. Monitoring Tools: Liquidity and Illiquidity Ratios
Our liquidity ratio is the sum of an MF's cash and cash equivalents, T-Bills, and STIVs, divided by its total net assets. The illiquidity ratio is the fraction of a fund's total net assets that comprise Level 3 assets.8 The illiquidity ratio captures only the most extreme dimension of illiquidity—securities with no observable market prices—rather than the full spectrum of a fund's liquidity profile.9
The data are from SEC Form N-PORT, which succeeded Form N-Q in 2020.10
Like Anadu and Cai (2019), we focus on the time-series trends of these measures, not their point estimates. We take this approach because the heterogeneity in MFs' asset classification practices could bias our measures. For example, some funds may include illiquid assets, such as commercial paper, as "cash and cash equivalents," which biases our liquidity ratio upwards, on balance. For the illiquidity measure, the likely "fluidity" between Level 2 and Level 3 assets could result in an underestimation of a fund's illiquidity ratio. Nonetheless, by consistently monitoring these measures, we shed light on how aggregate liquidity transformation activities in MFs are evolving, including in response to shocks.11
3.1 BL MFs
The liquidity ratio for the median BL MF increased from 2020, reaching almost ten percent of net assets in 2021 (Figure 2, Panel A). It began to decline thereafter and has remained relatively stable at about four-and-a-half percent since 2024; the range between the 5th and 95th percentiles has narrowed since 2021.
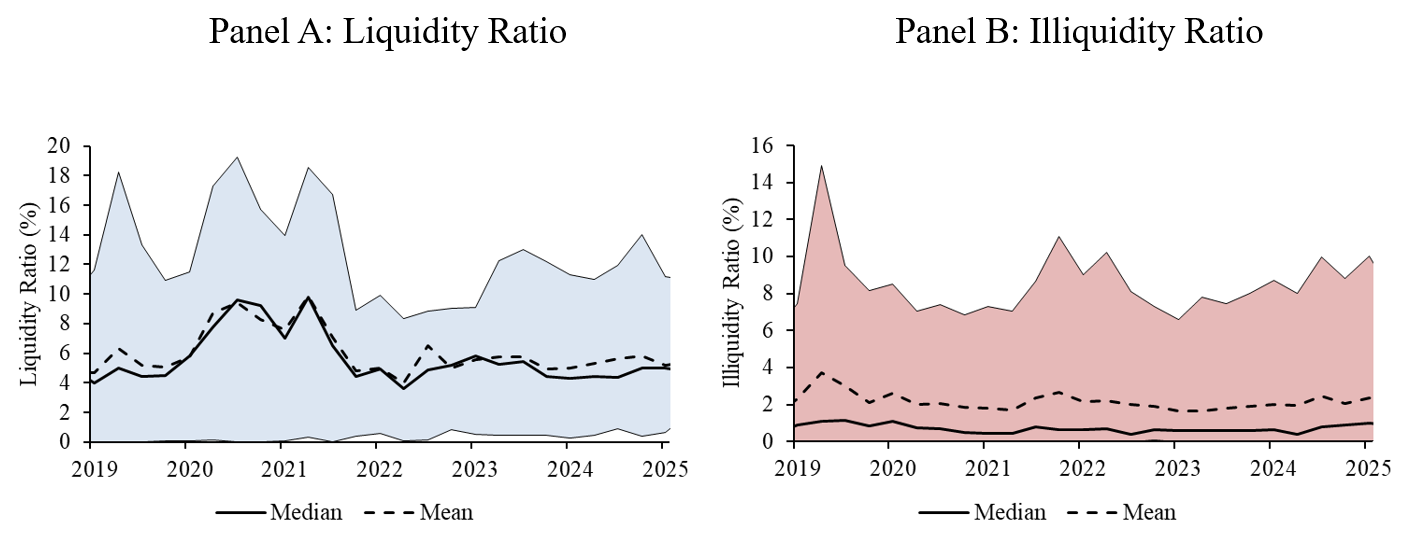
Notes: The liquidity ratio is computed as the sum of a fund's cash and cash equivalents, T-Bills, and STIVs, divided by its net assets. The blue shaded area shows the 5th-95th percentile range of the liquidity ratio distribution; the red shaded area shows the same range for the illiquidity ratio distribution. For the illiquidity ratio, our sample is restricted to MFs that report Level 3 assets in any reporting quarter, which account for 84 percent of total BL MF assets, as of 2025 Q4.
Sources: SEC Form N-PORT; Authors' calculations.
Figure 2, Panel B shows that the illiquidity ratio for the median BL MF rose to over one percent in 2020, declined thereafter, and, since 2025, has been approaching levels seen during the pandemic-era spike. Taken together, Panels A and B suggest that, in recent years, the liquidity transformation risk in the median BL MF has increased, on balance; the level of illiquid assets has ticked up from post-pandemic lows against the backdrop of a relatively stable liquid asset ratio.
3.2 HY MFs
Turning to HY MFs, in contrast to BL MFs, the liquidity ratio for the median HY MF has been relatively stable—at about four percent—since 2020 (Figure 3, Panel A). Similarly, the illiquidity ratio for the median HY MF has been relatively flat and the percentile range has narrowed notably since 2020 (Figure 3, Panel B). Thus, for HY MFs, liquidity transformation activity appears to have declined, on balance, in recent years.
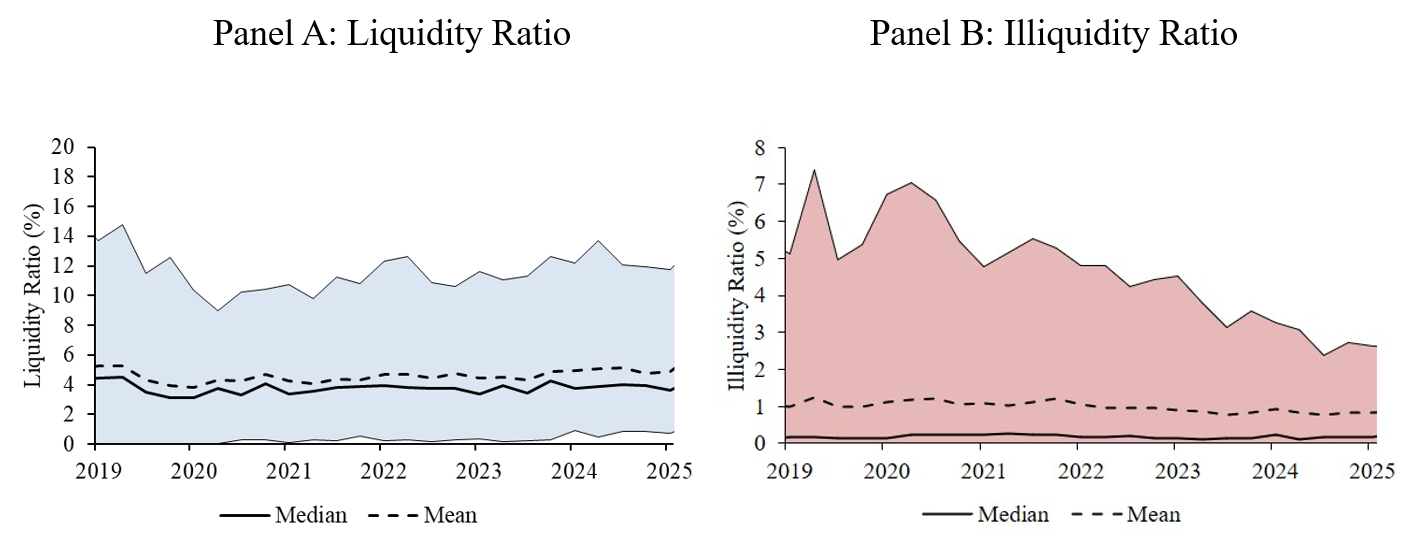
Notes: The liquidity ratio is computed as the sum of a fund's cash and cash equivalents, T-Bills, and STIVs, divided by its net assets. The blue shaded area shows the 5th-95th percentile range of the liquidity ratio distribution; the red shaded area shows the same range for the illiquidity ratio distribution. For the illiquidity ratio, our sample is restricted to MFs that report Level 3 assets in any reporting quarter, which account for 97 percent of total HY MF assets, as of 2025 Q4.
Sources: SEC Form N-PORT; Authors' calculations.
4. Case Studies
Next, we examine whether MFs with higher (lower) ex-ante liquidity ratios tend to experience lower (larger) net redemptions during market stress periods, on average. This flow analysis can help us better understand whether precautionary liquidity management practices at these MFs help mitigate redemption risks during market stress periods.
4.1 April 2025: The tariff-induced market volatility
Table 1 reports the net flows for BL MFs during the tariff-induced market volatility of April 2025. Focusing on the week after the Liberation Day announcement, on April 2, BL MFs with above-median liquidity in the quarter before April 2025 experienced higher net outflows in early April than below-median liquidity MFs, on average (Column 4). However, the difference between the group averages is not statistically significant.
Table 1: April 2025 Average Net Flows for BL MFs by Liquidity
| Liquidity Group |
(1) |
(2) |
(3) |
(4) |
(5) |
|---|---|---|---|---|---|
| Above Median |
19
|
8.8 (2.4) |
0.3 (0.7) |
-4.2 (3.4) |
-1.9 (2.8) |
| Below Median |
20
|
2.4 (1.6) |
-0.2 (0.6) |
-2.7 (2.2) |
-1.3 (1.6) |
| Differences | 6.4*** | 0.5** | -1.5 | -0.7 |
Notes: Column 2 reports the mean and standard deviation (in parenthesis) of BL MFs’ liquidity ratios normalized by net assets. Columns 3-5 report mean weekly (standard deviation) net flows. The sample of funds represents 63 percent of the total net assets of BL MFs in April 2025. (*p < 0.10, **p < 0.05, ***p < 0.01.)
Sources: Morningstar Direct; Authors’ calculations.
Our results are similar for HY MFs. Table 2 shows that, in the week of April 2, on average, HY MFs with higher ex-ante liquidity experienced larger net outflows than lower-liquidity ones (Column 4).
Table 2: April 2025 Average Net Flows for HY MFs by Liquidity
| Liquidity Group | (1) Total Funds |
(2) Liq. Ratio (%) 2025Q1 |
(3) Net Flows (%) March 26-April 1 |
(4) Net Flows (%) April 2-9 |
(5) Net Flows (%) April 10-17 |
|---|---|---|---|---|---|
| Above Median |
63
|
8.5 (4.3) |
0.1 (2.0) |
-2.1 (2.5) |
-1.1 (7.2) |
| Below Median |
63
|
2.1 (1.1) |
0.4 (1.7) |
-1.1 (3.5) |
0.1 (21.0) |
| Differences | 6.4*** | -0.4 | -1.0* | -1.3 |
Notes: Column 2 reports the mean and standard deviation (in parenthesis) of HY MFs’ liquidity ratios normalized by net assets. Columns 3-5 report mean weekly (standard deviation) net flows. The sample of funds represents 86 percent of the total net assets of HY MFs in April 2025. (*p < 0.10, **p < 0.05, ***p < 0.01.)
Sources: Morningstar Direct; Authors’ calculations.
Taken together, these observations are generally consistent with the literature, which suggests that riskier, less liquid MFs tend to hold larger liquidity buffers strategically to absorb redemption shocks (see, for example, Chernenko and Sunderam, 2016).
4.2 March 2020: COVID-19 pandemic
Tables 3 and 4 report the net flows for BL and HY MFs, respectively, during the COVID-19 period. In March 2020, BL MFs with below-median ex-ante liquidity ratios experienced significantly larger monthly net outflows, on average, than above-median-liquidity ones (Table 3, Column 4).
Table 3: March 2020 Average Net Flows for BL MFs by Liquidity
| Liquidity Group | (1) Total Funds |
(2) Liq. Ratio (%) 2019Q4 |
(3) Net Flows (%) February |
(4) Net Flows (%) March |
(5) Net Flows (%) April |
|---|---|---|---|---|---|
| Above Median |
24
|
9.7 (11.1) |
-0.6 (3.6) |
-6.7 (10.2) |
2.2 (25.0) |
| Below Median |
25
|
1.7 (1.4) |
-0.9 (5.0) |
-14.2 (6.2) |
-2.4 (2.0) |
| Differences | 8.0*** | 0.3 | 7.6*** | 4.7 |
Notes: Column 2 reports the mean and standard deviation (in parenthesis) of BL MFs' liquidity ratios normalized by net assets. Columns 3-5 report mean monthly (standard deviation) net flows. The sample of funds represents about 97 percent of the total net assets of BL MFs in March 2020. (*p < 0.10, **p < 0.05, ***p < 0.01.)
Source: Morningstar Direct; Authors' calculations.
Table 4: March 2020 Average Net Flows for HY MFs by Liquidity
| Liquidity Group | (1) Total Funds |
(2) Liq. Ratio (%) 2019Q4 |
(3) Net Flows (%) February |
(4) Net Flows (%) March |
(5) Net Flows (%) April |
|---|---|---|---|---|---|
| Above Median |
76
|
9.0 (6.6) |
-1.1 (3.8) |
-4.3 (8.5) |
2.2 (5.9) |
| Below Median |
76
|
2.0 (1.4) |
-1.4 (3.7) |
-4.0 (17.6) |
6.2 (36.4) |
| Differences | 7.0*** | 0.3 | -0.3 | -4.0 |
Notes: Column 2 reports the mean and standard deviation (in parenthesis) of HY MFs' liquidity ratios normalized by net assets. Columns 3-5 report mean monthly (standard deviation) net flows. The sample of funds represents about 97 percent of the total net assets of HY MFs in March 2020. (*p < 0.10, **p < 0.05, ***p < 0.01.)
Sources: Morningstar Direct; Authors' calculations.
The divergence of 2020's flow-liquidity observations from 2025's (and the broader literature) has some grounding in relatively recent work on MF flow dynamics during the pandemic. For example, Claessens and Lewrick (2021) show that, in March 2020, corporate bond MFs with higher liquid asset ratios ex-ante tended to experience larger net outflows, although this cohort, on average, experienced lower net outflows during normal periods. Similarly, Hespeler and Suntheim (2020) show that, during non-COVID-19 periods, an increase in cash and cash equivalents was associated with an increase in net flows. This relationship weakens during the pandemic period.
For HY MFs, those with below-median liquidity ratios experienced slightly lower net outflows, on average, than those with above-median liquidity (Table 4, Column 4); however, the difference is not statistically significant.
5. Conclusion
We update Anadu and Cai (2019) by substantially expanding the sample of HY and BL MFs for which liquidity and illiquidity ratios are computed and using more granular SEC Form N-PORT data available since 2020. These simple measures help shed some light on how liquidity transformation risks are evolving in the aggregate for corporate debt MFs. Evidence from the March 2020 and April 2025 episodes suggests that while MFs' precautionary liquidity risk management strategies could effectively mitigate redemption risks under normal market volatility, they alone might be insufficient to explain market dynamics during extraordinary shocks like the COVID-19 pandemic.
6. References
Anadu, K., and Cai, F. (2019). Liquidity Transformation Risks in U.S. Bank Loan and High-Yield Mutual Funds. FEDS Notes.
Bao, J., Pan, J., and Wang, J. (2011). The Illiquidity of Corporate Bonds. The Journal of Finance Volume LXVI, No. 3.
Chernenko, S. and Sunderam, A. (2016). Liquidity transformation in asset management: Evidence from the cash holdings of mutual funds. NBER Working Paper.
Chernenko, S. and Sunderam, A. (2020). Do fire sales create externalities? Journal of Financial Economics Volume 135, Issue 3, Pages 602-628.
Claessens, S., and Lewrick, U. (2021). Open-ended bond funds: systemic risks and policy implications. BIS Quarterly Review.
Falato, A., Goldstein, I., and Hortaçsu, A. (2021). Financial fragility in the COVID-19 crisis: The case of investment funds in corporate bond markets. Journal of Monetary Economics Volume 123, Pages 35-52.
Federal Reserve Board. (2025). Financial Stability Report.
Financial Accounting Standards Board. (2006). Fair Value Measurement (Topic 820).
Goldstein, I., Jiang, H., and Ng, D. (2017). Investor flows and fragility in corporate bond funds. Journal of Financial Economics Volume 126, Issue 3, Pages 592-613.
Hespeler, F., and Suntheim, F. (2020). The Behavior of Fixed-income Funds during COVID-19 Market Turmoil. IMF Global Financial Stability Notes.
Larsson, E., Kawamura, T., and Shin, C. (2026). Measuring Mutual Fund Liquidity with N-PORT. FEDS Notes.
1. Authors: Anadu, [email protected]; Baker, [email protected]; Cai, [email protected]; George, [email protected]; and Larsson, [email protected]. We thank Bill Bassett, Nicola Cetorelli, John Levin, Siobhan Sanders, and Chaehee Shin for helpful comments and suggestions. The views expressed in this note are ours and do not necessarily reflect those of the Federal Reserve Bank of Boston, the Federal Reserve Board of Governors, or the Federal Reserve System. Return to text
2. N-Q was a quarterly portfolio holdings report, and N-CSR is a semi-annual certified shareholder report. Return to text
3. Anadu and Cai's (2019) sample includes the ten largest BL and HY MFs, which, respectively, represented 62 percent and 45 percent of the BL and HY sectors, as of July 2018. Return to text
4. Larsson, Kawamura, and Shin (2026) also use N-PORT data to define Short-Term Liquid Assets Ratio of corporate bond MFs. Return to text
5. See, https://www.whitehouse.gov/presidential-actions/2025/04/regulating-imports-with-a-reciprocal-tariff-to-rectify-trade-practices-that-contribute-to-large-and-persistent-annual-united-states-goods-trade-deficits/. Return to text
6. According to Morningstar Direct data, from 2019 to 2025 BL and HY MFs saw net outflows of $23 billion (27% of assets) and $15 billion (6% of assets), respectively. Return to text
7. In the case of corporate bond illiquidity, see, for example, Bao, Pan, and Wang (2011). Return to text
8. Level 3 assets are valued using significant unobservable inputs, which require management's best estimates. Thus, these assets are difficult to value and typically illiquid. In contrast, Level 1 assets are valued using quoted prices in active markets; Level 2 assets are valued using observable inputs other than Level 1 quoted prices (see, Financial Accounting Standards Board, 2006). Return to text
9. Other factors, such as market depth, are not observed in our analysis. Thus, our measure provides only a partial view of portfolio liquidity; moreover, funds with few Level 3 holdings may nonetheless face liquidity pressures if they hold substantial Level 2 assets or concentrated positions in thinly traded securities. Return to text
10. The SEC adopted Form N-PORT in February 2016. MFs were given staggered compliance dates based on their size and fiscal quarter end dates. Large funds began filing in October 2019, while small funds began in April 2020. Form N-PORT requires filers to report detailed portfolio-related information, such as individual holdings and total assets and liabilities, to the SEC monthly. On February 18, 2026, the SEC amended this reporting requirement to quarterly, effective in November 2027 for larger funds and in May 2028 for smaller ones. See, https://www.sec.gov/newsroom/press-releases/2026-19-sec-proposes-amendments-reduce-burdens-eporting-fund-portfolio-holdings. Return to text
11. The SEC rules prohibit MFs from purchasing illiquid assets if the sum of their illiquid assets is greater than 15 percent. Funds are required to privately notify the SEC (not the public) when they breach the 15 percent illiquid-asset threshold. As these data are not public, our measure fills a gap in monitoring MFs illiquid (hard-to-value) asset levels. Return to text
Anadu, Kenechukwu, Sean Baker, Fang Cai, Logan George, and Erik Larsson (2026). "Liquidity Transformation Risks in U.S. Bank Loan and High-Yield Mutual Funds: A 2026 Update," FEDS Notes. Washington: Board of Governors of the Federal Reserve System, August 19, 2026, https://doi.org/10.17016/2380-7172.4123.
Disclaimer: FEDS Notes are articles in which Board staff offer their own views and present analysis on a range of topics in economics and finance. These articles are shorter and less technically oriented than FEDS Working Papers and IFDP papers.