FEDS Notes
June 26, 2019
Trade in Goods and Services: Measuring Domestic and Export Flows in Buyer-Supplier Data
According to Statement No. 14 and Statement No. 131 of the Financial Accounting Standards, public firms are required to disclose major customers--that is, customers that account for at least 10 percent of their total sales.2 This public filing requirement is a source of unique firm-to-firm transactions reported in the customer segment of the Compustat database.
This note explores measures of domestic and export flows based upon the Compustat customer segment data and compares our measures with official statistics.
The customer segment includes two main variables on public firms' customers: the customer name and the market segment of the buyer. With these two pieces of data, we are able to construct a foreign indicator that identifies whether the transaction is with a U.S. or a foreign firm. A brief description of our methodology follows.
First, we match the reported customer names to Compustat firms. To address the problem of nonstandardized customer names, we adopt a similar strategy to Fee and Thomas (2004). After excluding all customers with unreported names and those identified as governments or geographic regions, we run a text-matching program requiring the letters in the customer name to be sequentially present in a potential match.3 To ensure matching accuracy, we manually review the matched pairs. If there are multiple potential matches and we cannot identify a unique match by looking at information on firm websites or Google, we exclude them from the sample. The name-matching procedure results in 23,833 firm-customer or 74,353 firm-customer-year observations.4 Of the matched sample, we use the customer's headquarters to proxy for the firm's physical location in order to differentiate between domestic and foreign transactions.
Second, we complement the name-matching strategy with additional geographic imputations based on the customer's name or the market segment.5 Finally, for the largest unmatched transactions, we look at publicly available information to identify the foreign status of the customer. Overall, we are able to assign a foreign status indicator to 449,015 firm-customer-year transactions--more than 84 percent of the total number of observations.6
Figure 1 shows the evolution of domestic and export flows from the Compustat customer segment between 1991 and 2016.
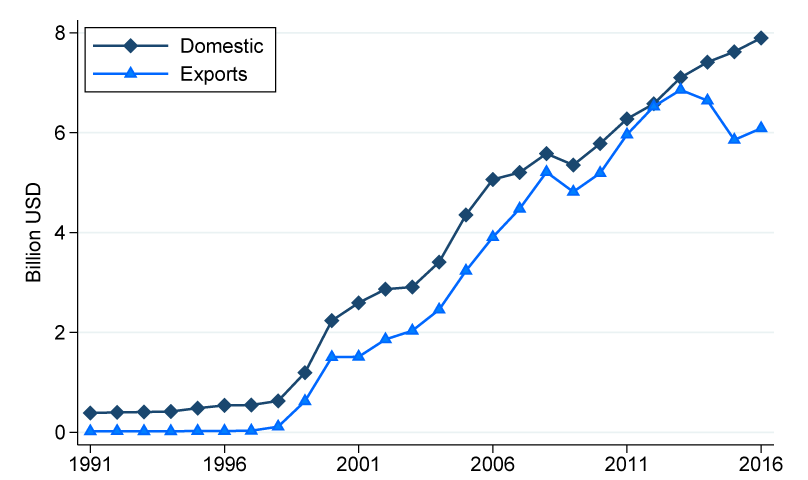
Note: Evolution of domestic and foreign shipments based on the customers' foreign status, 1991 to 2016.
Source: S&P Global Market Intelligence, Compustat North America, customer segment.
Domestic and export shipments remain fairly flat over the first few years until a sharp acceleration around 1998, reflecting the changes to the filing requirements introduced by Statement No. 131. After 1998, the two series share similar trends and diverge again only around 2015, a period marked by the global trade slowdown.7 Exports represent, on average, 20 percent of total shipments, a value that increases to 45 percent toward the end of our sample.
Overall, export shares calculated from the Compustat data seem roughly consistent with the traditional firm-level statistics compiled from the U.S. export customs.8 However, export flows based on Compustat represent only a small fraction of the universe of all exports shipments. Figure 2 compares the U.S. Census Bureau (Census) export statistics--which combine a census of commodity exports with U.S. Census Bureau estimates of low-valued exports and Bureau of Economic Analysis (BEA) estimates of trade in services--with the export flows recorded in the customer segment.
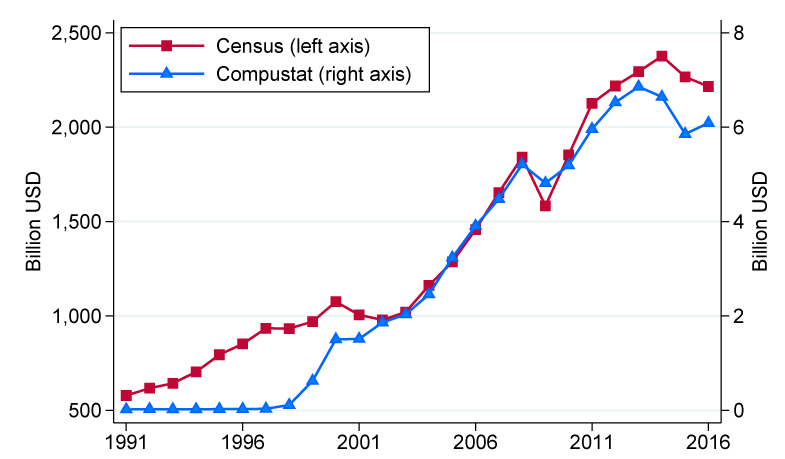
Note: Export shipments from Compustat and Export Customs. Compustat export shipments are based on the customers' foreign status, 1991 to 2016.
Source: S&P Global Market Intelligence, Compustat North America, customer segment and Census.
We represent the two series over two different scales, but, for ease of comparison, we maintain the same unit of measure, billions of U.S. dollars. Compustat-based export flows account for, on average, only about 0.1 percent of economy-wide exports. The difference in magnitude points to the fact that the reporting 10 percent rule is severely binding: While public firms tend to be larger and capture a larger share of exports, the data collected in Compustat nonetheless represent only a small fraction of all export transactions. To compare, Bernard et al. (2009) report that the 2000 export customs data record 23 million transactions--a number that, with 167,217 exporters, corresponds to 138 transactions per firm; in Compustat, we have identified 1,136 exporters in 2000 with an average of 3 transactions per exporter.9 Despite the large difference in magnitude, the Compustat export series seems to track aggregate exports reasonably well in recent years, with a correlation around 0.7.
Tables 1 and 2 detail the comparison of export flows by sector. We focus on exports of goods in table 1 and exports of services in table 2. This distinction also highlights the different official data sources used for comparison: We compare export flows of goods from Compustat to export shipments of goods from the Census's export statistics and Compustat services exports to the BEA's services export statistics.10 In particular, columns 4 and 5 of the tables report the average export flow (in millions of U.S. dollars) from Compustat to the average shipments from the official statistics.
Table 1: Exports of Goods: Comparing Compustat with Census Data
| Sector | Avg Revenue Share | Avg Exports | |||
|---|---|---|---|---|---|
| Compustat | Ec Census | Compustat | Census | Corr | |
| Food | 2.48 | 2.36 | 48.7 | 48824 | 0.94 |
| Beverage & Tobacco | 1.78 | 0.5 | 107.8 | 5715 | 0.92 |
| Textile Mills | 0.05 | 0.16 | 0.2 | 8339 | 0.2 |
| Textile Prod | 0.05 | 0.12 | 0.8 | 2536 | 0.61 |
| Apparel | 0.67 | 0.11 | 32.9 | 3487 | -0.57 |
| Leather | 0.23 | 0.02 | 4.9 | 2591 | -0.4 |
| Wood | 0.24 | 0.37 | 12.7 | 5554 | 0.5 |
| Paper | 1.22 | 0.69 | 51.7 | 20641 | 0.76 |
| Printing | 0.11 | 0.39 | 2 | 5464 | 0.33 |
| Petroleum & Coal | 5.77 | 2.11 | 263.9 | 61194 | 0.95 |
| Chemicals | 8.99 | 2.58 | 596.9 | 155020 | 0.96 |
| Plastics & Rubber | 0.43 | 0.81 | 14.3 | 24419 | 0.8 |
| Nonmetallic Prod | 0.56 | 0.44 | 34.9 | 8946 | 0.37 |
| Primary Metals | 1.47 | 0.87 | 60.9 | 46157 | 0.71 |
| Fabricated Metals | 0.76 | 1.24 | 27.4 | 32655 | 0.94 |
| Machinery | 3.02 | 1.33 | 215.2 | 114945 | 0.95 |
| Electronics | 8.45 | 1.46 | 512.6 | 121560 | -0.05 |
| Electrical Eq | 2.39 | 0.48 | 155.1 | 35198 | -0.5 |
| Transportation Eq | 11.38 | 2.91 | 791.1 | 195557 | 0.9 |
| Furniture | 0.21 | 0.31 | 2.5 | 3921 | 0.92 |
| Miscellaneous | 0.65 | 0.57 | 27.1 | 37519 | 0.92 |
| Publishing | 0.88 | 1.08 | 67.7 | 777 | 0.38 |
Note: Average export shipments from the Compustat customer segment and Census. Revenue shares are calculated over 2002, 2007, and 2012, from Compustat and the Economic Census. Last column shows the correlation between the export shipments reported in Compustat and those in the Census's export statistics.
Source: S&P Global Market Intelligence, Compustat North America, customer segment and U.S. Census Bureau.
As with aggregate data, Compustat flows are a small fraction of the sectoral aggregates. The Compustat coverage ratio is higher the larger the representativeness of the sector in the Compustat sample relative to the whole economy, which is gauged in columns 2 and 3. In particular, columns 2 and 3 contrast the average revenue share from the Economic Census to the average revenue share from the Compustat universe. In addition to the magnitudes, the last column evaluates the ability of Compustat data to capture aggregate trends and reports the correlation between the export flows from the two datasets. Sectors such as Petroleum & Coal, Transportation Equipment, and Information that tend to be heavily overrepresented in the Compustat universe relative to the whole economy not only account for a higher share of aggregate export flows, but also tend to follow aggregate trends quite closely, with a correlation above 0.9.
Table 2: Exports of Services, Selected Sectors: Comparing Compustat with BEA's Data
| Sector | Avg Revenue Share | Avg Exports | |||
|---|---|---|---|---|---|
| Compustat | Ec Census | Compustat | BEA | Corr | |
| Transportation | 2.38 | 2.28 | 70.80 | 69516 | 0.95 |
|
Air Transportation |
0.66 | 0.42 | 56.00 | 50222 | 0.96 |
| Information | 7.60 | 4.27 | 430.70 | 25905 | 0.83 |
|
Telecommunications |
3.75 | 1.94 | 181.30 | 9957 | 0.42 |
| Financial Services | 1.58 | 8.22 | 71.20 | 69136 | 0.83 |
| Insurance | 4.92 | 6.62 | 193.80 | 12827 | 0.78 |
| Legal Services | 0.01 | 0.89 | 1.00 | 7992 | 0.73 |
| Accounting Services | 0.04 | 0.43 | 0.40 | 1236 | 0.85 |
| Architectural & Engineering | 0.28 | 0.85 | 9.10 | 14065 | 0.63 |
| Management & Consulting | 0.26 | 0.61 | 6.70 | 31203 | 0.38 |
| Research & Development | 0.06 | 0.35 | 1.00 | 22219 | 0.85 |
| Advertising | 0.33 | 0.31 | 13.90 | 8112 | 0.29 |
Note: Average export shipments from the Compustat customer segment and BEA. Revenue shares are calculated over 2002, 2007, and 2012, from Compustat and the Economic Census. The last column shows the correlation between the export shipments reported in Compustat and those in BEA's export statistics.
Source: S&P Global Market Intelligence, Compustat North America, customer segment, U.S. Census Bureau, and BEA.
An even more interesting comparison applies to domestic shipments. Differently from exports, we lack a data source that records the universe of domestic shipments across all sectors. A special case is the Commodity Flow Survey (CFS), which collects data on a sample of shipments, including exports, originating from a set of establishments in selected sectors--mining, manufacturing, wholesale trade, and select retail and services. In contrast, data on total receipts are more widely available and are collected in the Economic Census every five years since 1992. With the ability to complement the limited time series from the Economic Census with additional data sources, we restrict our analysis to the manufacturing sector. In particular, the Manufacturers' Shipments, Inventories, and Orders (M3) survey and the Annual Survey of Manufactures (ASM) record total shipments from manufacturing establishments at higher frequencies. Table 3 summarizes the comparison of domestic and total shipments between Compustat and Census data for the manufacturing sector.
Table 3: Domestic and Total Shipments in Compustat and Census Data: Manufacturing
| Sector | Domestic | Total | ||||
|---|---|---|---|---|---|---|
| Compustat | CFS | Compustat | M3 | ASM | Corr | |
| Food | 76.9 | 639868 | 103 | 519 | 587472 | 0.98 |
| Beverage & Tobacco | 21.7 | 132048 | 87 | 110 | 125197 | 0.96 |
| Textile Mills | 1.2 | 28095 | 2 | 38 | 39281 | 0.75 |
| Textile Prod | 2.3 | 23976 | 2 | 26 | 28307 | -0.18 |
| Apparel | 31.8 | 17086 | 56 | 33 | 31491 | -0.93 |
| Leather | 6.3 | 4186 | 17 | 6 | 6536 | -0.72 |
| Wood | 9.3 | 85577 | 17 | 82 | 91171 | 0.22 |
| Paper | 42.7 | 164603 | 67 | 151 | 167791 | 0.85 |
| Printing | 2.4 | 85255 | 4 | 83 | 92122 | -0.68 |
| Petroleum & Coal | 28.6 | 688281 | 230 | 389 | 475945 | 0.91 |
| Chemicals | 375.2 | 648343 | 744 | 529 | 612530 | 0.96 |
| Plastics & Rubber | 14.4 | 195957 | 31 | 172 | 195754 | 0.86 |
| Nonmetallic Prod | 21 | 104337 | 36 | 91 | 103937 | 0.82 |
| Primary Metals | 51.7 | 236442 | 92 | 181 | 206566 | 0.65 |
| Fabricated Metals | 42.8 | 311494 | 57 | 261 | 298224 | 0.9 |
| Machinery | 144.2 | 295362 | 248 | 281 | 319756 | 0.86 |
| Electronics | 414.9 | 245099 | 828 | 328 | 372086 | -0.81 |
| Electrical Eq | 70.4 | 108946 | 152 | 104 | 117266 | 0.07 |
| Transportation Eq | 517.1 | 626501 | 1006 | 630 | 708096 | 0.75 |
| Furniture | 8.2 | 73034 | 9 | 64 | 72530 | -0.03 |
| Miscellaneous | 24.6 | 128515 | 42 | 118 | 136847 | 0.93 |
Note: Average shipments from the Compustat customer segment and Census data. The last column shows the average correlation between the total shipments reported in Compustat and those in Census (M3 and ASM).
Source: S&P Global Market Intelligence, Compustat North America, customer segment and U.S. Census Bureau.
Compustat shipments tend to be more in line with the statistics released in the M3 survey, as the industry coverage in the two datasets is roughly similar. In fact, data published from the M3 survey are based on a panel of approximately 5,000 reporting units that represent approximately 3,100 companies, while the Compustat customer segment contains, on average, about 4,000 records per year. The difference in magnitude with surveys more representative of economy-wide conditions continues to remain large, but sectors that track well aggregate exports seem also able to capture aggregate trends in total shipments.
Figure 3 leverages on the differences in sectoral shares to map Compustat data to aggregate flows for the manufacturing sector. Our weights build on the differences in export flows: To construct aggregate exports, each sector is scaled by the average share of exporters and by the average export shipment relative to the export statistics. Figure 3a highlights that Compustat export flows match aggregate exports quite closely.
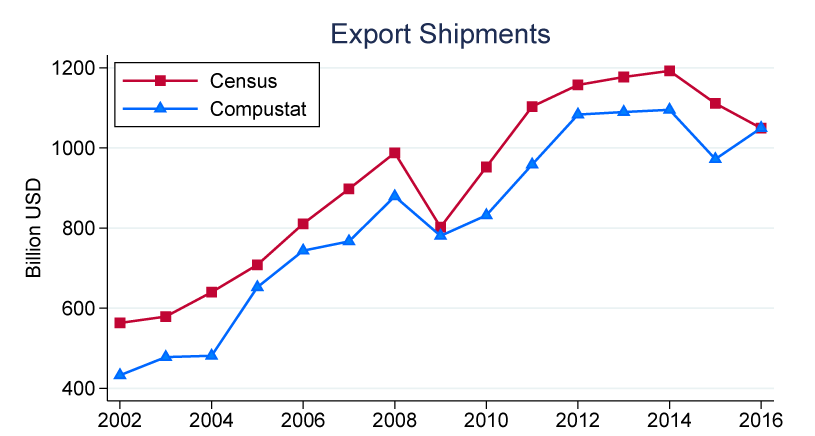
Note: Manufacturing export shipments from Compustat and Export Customs. Compustat shipments are based on the customers' foreign status, 2002 to 2016, and are scaled by the average number of exporters and export shares relative to the Export Statistics.
Source: S&P Global Market Intelligence, Compustat North America, customer segment and Census.
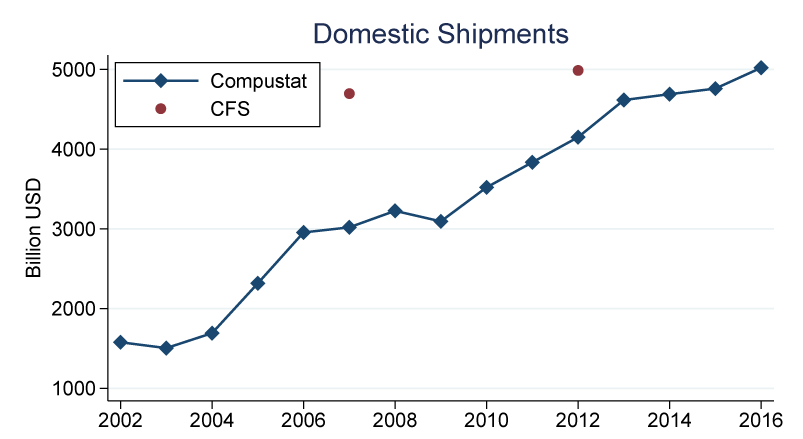
Note: Domestic manufacturing export shipments from Compustat and CFS. Compustat shipments are based on the customers' foreign status and are scaled by the average number of domestic firms and domestic revenue shares calculated from the Export Statistics.
Source: S&P Global Market Intelligence, Compustat North America, customer segment and Census.
We then exploit the export weights to create annual domestic shipments statistics for the manufacturing sector in figure 3b.11 While we are not directly targeting the average domestic flows from CFS, the Compustat customer segment data captures about two-thirds of the domestic transactions in terms of value in 2007--a share that increases to more than 80 percent in 2012.
In sum, while Compustat shipments represent, at face value, only a small fraction of economy-wide statistics, they seem informative of aggregate trends in the whole economy, in some cases coming at shorter lags than official statistics. In addition, because of data restrictions, the Compustat customer segment is a source of unique firm-level shipments, especially for the service sector, with many potential applications.12
References
Battaglia, Damon C., and John A. Sondheimer (2018). A Guide to BEA's Services Surveys. Washington: Bureau of Economic Analysis, https://www.bea.gov/system/files/2018-04/surveysu.pdf.
Bernard, Andrew B., J. Bradford Jensen, and Peter K. Schott (2009). "Importers, Exporters, and Multinationals: A Portrait of Firms in the U.S. that Trade Goods," in Timothy Dunne, J. Bradford Jensen, and Mark J. Roberts, eds., Producer Dynamics: New Evidence from Micro Data, National Bureau of Economic Research, Studies in Income and Wealth Volume 68. Chicago: University of Chicago Press, pp. 513–52.
Bernard, Andrew B., J. Bradford Jensen, Stephen J. Redding, and Peter K. Schott (2007). "Firms in International Trade," Journal of Economic Perspectives, vol. 21 (Summer), pp. 105–30.
Constantinescu, Cristina, Aaditya Mattoo, and Michele Ruta (2015). "Explaining the Global Trade Slowdown," VOX CEPR Policy Portal (January 18).
-- (2016). Global Trade Watch: Trade Developments in 2015. Washington: World Bank Group, March 9.
Fee, C. Edward, and Shawn Thomas (2004). "Sources of Gains in Horizontal Mergers: Evidence from Customer, Supplier, and Rival Firms," Journal of Financial Economics, vol. 74 (December), pp. 423–60.
Financial Accounting Standards Board (n.d.a). "Summary of Statement No. 14," https://www.fasb.org/summary/stsum14.shtml (accessed May 15, 2019).
-- (n.d.b). "Summary of Statement No. 131," https://www.fasb.org/summary/stsum131.shtml (accessed May 15, 2019).
1. The views expressed in the article are those of the author and do not necessarily reflect those of the Federal Reserve System. I would like to thank Ryan Decker and Jacob Williams for kindly sharing their data. Leland Crane and Aaron Flaaen provided helpful conversations. Return to text
2. See Financial Accounting Standards Board (n.d.a, n.d.b). Return to text
3. We require that, in a match, at least eight letters are common between the firm and the customer name. Return to text
4. Precisely, we are able to match 6,353 firm names that appear in the customer segment of the Compustat database. Return to text
5. In some cases, the customer's name includes the customer's location. Return to text
6. The share is even higher in terms of value--more than 90 percent--because the reported value for about 20,000 transactions is zero. Return to text
7. See, for example, Constantinescu, Mattoo, and Ruta (2015, 2016). Return to text
8. A classical reference is Bernard et al. (2007), who report that manufacturing exports, on average, are 14 percent of total shipments. Firms in our sample, however, tend to be bigger than the average manufacturing firms and, thus, tend to export a larger share of their output. Return to text
9. If we were to impute the missing number of transactions for the Compustat firms to match an average of 138 transactions, we would be able to account for more than half of total U.S. exports. Return to text
10. The services exports comparison is limited to selected sectors, based on a correspondence that we built between the BEA's categories and NAICS codes. Return to text
11. We derive the average domestic firm and revenue share as complements of the export shares. Return to text
12. BEA's services export estimates rely on a large range of survey, administrative, and other data. The International Investment and Trade Survey Act, which grants legal authority to the BEA's data collection, "specifies that the survey data may only be used for statistical and analytical purposes. Access to the data is limited to officials and employees (including consultants and contractors and their employees) of government agencies that are designated by the President to perform functions under the act. Certain other government agencies may be granted access to the data under the Foreign Direct Investment and International Financial Data Improvements Act of 1990, but only for limited statistical purposes. BEA is prohibited from granting another agency access to the data for tax, investigative, or regulatory purposes." For more information, see Battaglia and Sondheimer (2018). Return to text
Tito, Maria (2019). "Trade in Goods and Services: Measuring Domestic and Export Flows in Buyer-Supplier Data ," FEDS Notes. Washington: Board of Governors of the Federal Reserve System, June 26, 2019, https://doi.org/10.17016/2380-7172.2400.
Disclaimer: FEDS Notes are articles in which Board staff offer their own views and present analysis on a range of topics in economics and finance. These articles are shorter and less technically oriented than FEDS Working Papers and IFDP papers.