FEDS Notes
August 23, 2017
Model-Based Measures of ELB Risk 1
1. Introduction
The target range for the federal funds rate has increased a few times since its liftoff from the effective lower bound (ELB) in December 2015 and currently stands at 1 to 1-1/4 percent. According to standard macroeconomic models, ELB risk--how likely it is for the policy rate to be constrained by the ELB in the near- and medium-term future--has important implications for interest rate policy. When the economy is projected to enter a recession, a higher ELB risk calls for a more aggressive cut in the policy rate (Reifschneider and Williams, 2000; Adam and Billi, 2007; Nakata, 2016). When the economy is expanding after a prolonged period of being constrained by the ELB--like the U.S. economy today--a higher ELB risk calls for a more gradual increase in the policy rate (Nakov, 2008; Evans and others, 2015; Nakata, 2017).2 Accordingly, it is useful for central banks to quantify and monitor ELB risk.
In this note, I construct measures of ELB risk by combining survey-based projections of the U.S. economy with stochastic simulations of the FRB/US model, a large-scale model of the US economy maintained and made public by Federal Reserve staff, and I examine how the ELB risk measures have evolved in the past and how they are likely to evolve in the future.3
2. Model-Based Measures of ELB Risk
I define ELB risk at any given date as the probability that the federal funds rate will be constrained by the ELB for at least one quarter in the next three years. I consider three measures of ELB risk, each of which is associated with a projection of the U.S. economy from one of the following three sources: the Survey of Primary Dealers (SPD), the Survey of Professional Forecasters (SPF), and the Summary of Economic Projections (SEP). For each survey, I take the median projection of key macroeconomic variables as its baseline projection4 and simulate 20,000 alternative paths of the economy around that baseline projection using a version of the FRB/US model with a non-inertial Taylor rule and historical shocks implied by the FRB/US model.5 The ELB risk measure is then computed as the fraction of the simulated paths in which the federal funds rate hits the ELB for at least one quarter in the next three years.6
To use the FRB/US model to conduct stochastic simulations around the projection from each survey, the projection has to be at least at a quarterly frequency for the relevant projection horizon. Projections from the three surveys are either at an annual frequency or only partially at a quarterly frequency. I employ simple interpolation or extrapolation schemes to translate the survey projections into a quarterly frequency when necessary. In the remainder of the article, I will refer to these translated projections as the SPD-consistent, SPF-consistent, and SEP-consistent projections.7
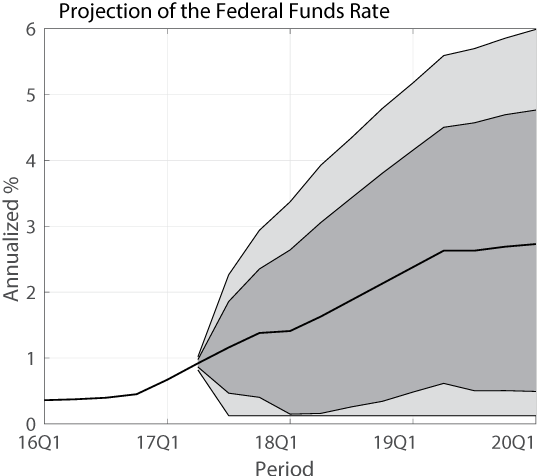
To give a clear idea about how ELB risk measures are constructed, figure 1 shows an example of FRB/US stochastic simulations around the SPD-consistent projection of the federal funds rate from 2017:Q2. The black line shows the projection of the federal fund rate consistent with the SPD through 2020:Q1. The fan chart shows the distribution of 20,000 paths of the federal funds rate generated by simulating the FRB/US model around the SPD-consistent projection, with dark- and light-gray areas indicating 70 percent and 90 percent confidence intervals, respectively. The ELB risk measure consistent with the SPD is 34 percent, meaning that 34 percent of the simulated paths touch the ELB at least once from 2017:Q2 to 2020:Q1.
3. ELB Risk since Liftoff
The left panel of figure 2 shows how the ELB risk measures have evolved since 2016:Q1.8 The solid black line is for the SPD-consistent ELB risk, the dashed red line is for the SPF-consistent ELB risk, and the dash-dot blue line is for the SEP-consistent ELB risk.
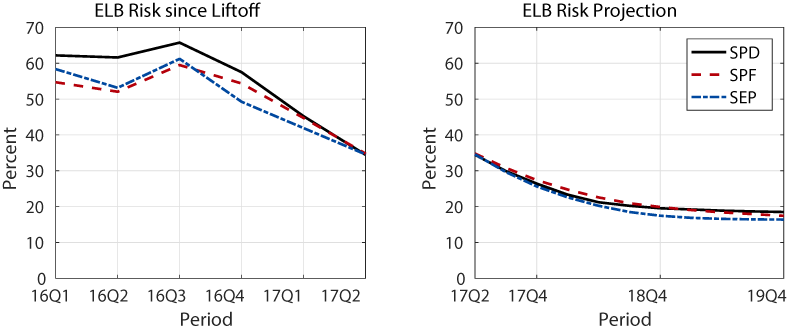
The three measures of ELB risk were above 50 percent most of the time during 2016.9 The risk measures peaked in 2016:Q3 and have come down steadily since then. As of 2017:Q2, the ELB risk measures are 34 percent, 35 percent, and 35 percent for the SPD-consistent, SPF-consistent, and SEP-consistent projections, respectively.
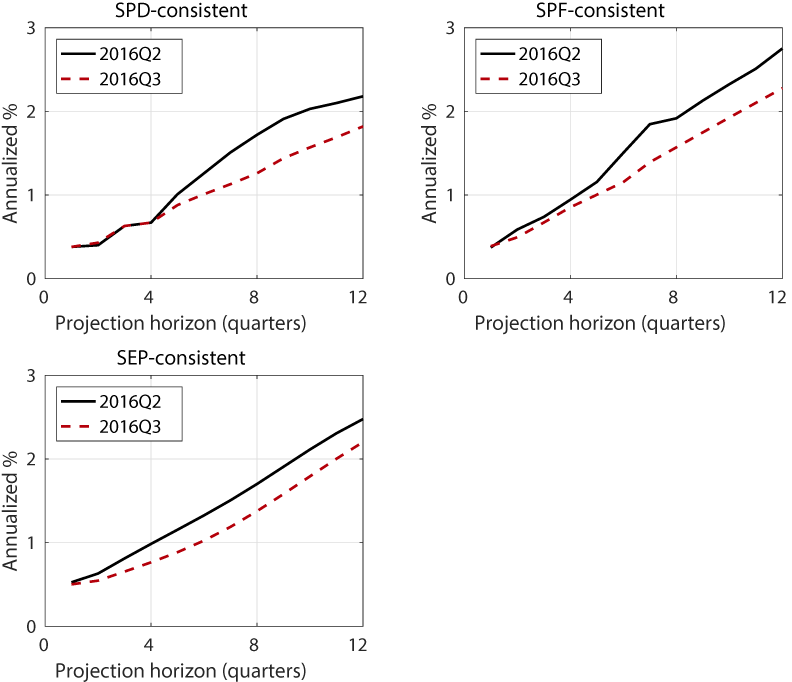
Note that ELB risk fluctuated during 2016 even though the actual federal funds rate remained constant in the range of 1/4 to 1/2 percent. These movements reflect the fact that the ELB risk measure depends not only on the current federal funds rate, but also on the projected path of the federal funds rate. When the projected path of the federal funds rate becomes flatter (steeper), ELB risk increases (decreases). For example, the projections of the federal funds rate flattened appreciably for all three surveys in 2016:Q3 from the previous quarter, as shown in figure 3.10 The ELB risk measures increased as a result, from 62 percent, 52 percent, and 53 percent in 2016:Q2 to 66 percent, 60 percent, and 61 percent in 2016:Q3 (for the SPD, SPF, and SEP measures, respectively).
4. Projections of ELB Risk
The right panel of figure 2 shows the projected paths of the ELB risk measures according to the most recent (2017:Q2) surveys. In this figure, for each survey, the ELB risk at any given date shows the model-implied probability that the federal funds rate will be at the ELB for at least one quarter during the subsequent three years if the economy has evolved according to the projection from the survey up to that time.
Because the federal funds rate is expected to rise, the ELB risk measures are expected to decline further from their current levels. In 2017:Q4, the ELB risk measures are 26 percent, 27 percent, and 26 percent for the SPD, SPF, and SEP, respectively. They are projected to eventually converge to their steady-state values which are in the range of 16 to 18 percent.11 From the peak levels of 2016:Q3, the current ELB risk measures are all more than halfway toward their steady-state values.
5. Discussion
5.A. Details Matter
The values of the ELB risk measures necessarily depend on the details of how the stochastic simulations are run to generate the distribution of the federal funds rate. For example, throughout this article, I have used the historical shocks from 1969:Q1 to 2015:Q4 implied by the FRB/US model to conduct stochastic simulations.12 However, the width of the fan chart depends on the sample period used to draw historical shocks. If I use a more recent sample that excludes the 1970s and 1980s--decades of elevated macroeconomic volatility--the standard deviation of historical shocks is smaller and thus the width of the fan chart will be narrower. As a result, the ELB risk measures will be lower, as captured by the comparison between figure 2 and the top panels of figure 4.
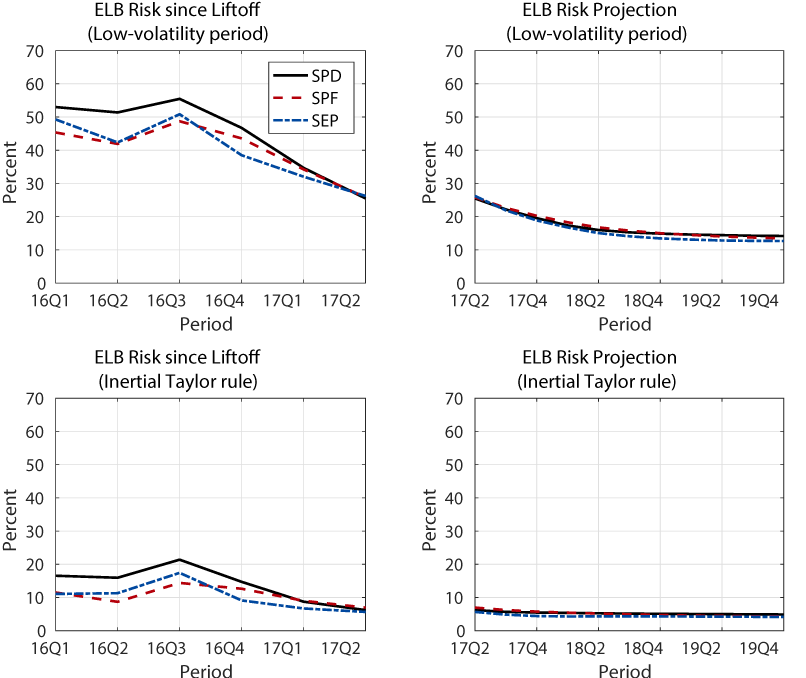
The ELB risk measures are also sensitive to the choice of policy rule. As mentioned, I have used a version of the FRB/US model with the non-inertial Taylor rule to capture the tendency of the Federal Reserve to cut interest rates aggressively when entering a recession, even though it often increases the policy rate gradually in the aftermath of a recession. If the standard FRB/US model with an inertial Taylor rule is instead used to conduct stochastic simulations, the distribution of the federal funds rate is narrower, and the ELB risk measure is smaller. The bottom panels of Figure 4 shows the evolution and the projection of the ELB risk measures under the inertial Taylor rule. The ELB risk measures under the inertial Taylor rule are substantially lower than the baseline measures computed under the non-inertial Taylor rule, as captured by the comparison between figure 2 and the bottom panels of figure 4. Under the inertial Taylor rule, the federal funds rate moves by less in response to shocks to the economy than under the inertial Taylor rule. Thus, the simulated federal funds rate path deviate less from the upward baseline path, making it less likely to hit the ELB.
While the levels of the ELB risk measures importantly depend on the details of stochastic simulations, the overall patterns are similar regardless of the details. ELB risk peaked in 2016:Q3, has steadily declined since then, and is expected to decline further in the future.
5.B. Comparison with an Independent Assessment of ELB Risk from the SPD
For some time, the SPD has asked its participants for the probability that they attach to the event that the federal funds rate returns to the ELB at some point from now to the end of the calendar year two or three years ahead. The precise forecast horizon implicit in this question ranges from two years and three quarters to three years and two quarters, depending on which part of the year the question is asked, but is always about three years. Thus, the answer to this question can be approximately seen as an independent assessment of the ELB risk as defined in this article.
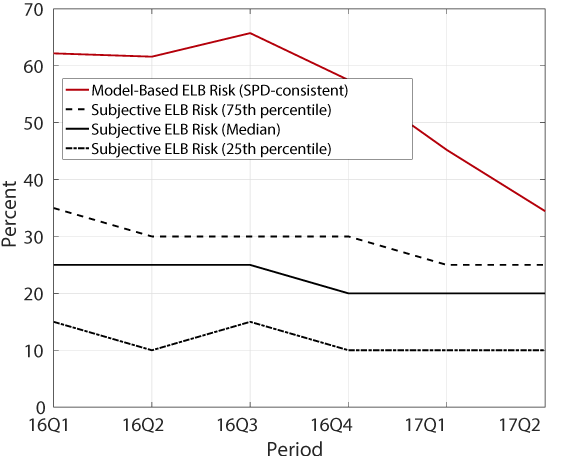
Figure 5 shows the evolution of this independent assessment of ELB risk by the primary dealers. The solid black line is the median estimate of ELB risk, and the dash-dot and dashed lines are the 25th and 75th percentiles, respectively. The primary dealers' assessment of the ELB risk is substantially lower than the model-based ELB risk measures, represented by the red line. However, consistent with the model-based measures, the primary dealers see a smaller chance of returning to the ELB this year than they did in 2016.
6. Concluding Remarks
In this article, I constructed three measures of ELB risk and examined how they have evolved since liftoff and how they are likely to evolve in the future. According to all three measures considered, ELB risk peaked in 2016:Q3, has come down steadily since then, and is expected to decline further going forward.
In standard macroeconomic models, the extent to which central banks should adopt risk-management approach depends importantly on how likely the federal funds rate will be constrained by the ELB in the near- and medium-term future. The model-based measures of ELB risk considered in this article can be a useful input in evaluating the stance of monetary policy in the recent past and determining policy rates in the future.
References
Adam, Klaus, and Roberto Billi (2007). "Discretionary Monetary Policy and the Zero Lower Bound on Nominal Interest Rates," Journal of Monetary Economics, vol. 54 (April), pp. 728-52.
Brayton, Flint, Thomas Laubach, and David Reifschneider (2014). "The FRB/US Model: A Tool for Macroeconomic Analysis," FEDS Notes 04-2014. Washington: Board of Governors of the Federal Reserve System (U.S.). https://www.federalreserve.gov/econresdata/notes/feds-notes/2014/a-tool-for-macroeconomic-policy-analysis.html.
Evans, Charles, Jonas Fisher, François Gourio, and Spencer Krane (2015). "Risk Management for Monetary Policy Near the Zero Lower Bound," Brookings Papers on Economic Activity, Spring, pp. 141-219, https://www.brookings.edu/wp-content/uploads/2015/03/2015a_evans.pdf.
Federal Reserve Bank of New York (2017). Primary Dealer Surveys. https://www.newyorkfed.org/markets/primarydealer_survey_questions.html.
Federal Reserve Board (2017). Federal Open Market Committee Summary of Economic Projections. https://www.federalreserve.gov/monetarypolicy/fomccalendars.htm.
Federal Reserve Bank of Philadelphia (2017). Survey of Professional Forecasters. https://www.philadelphiafed.org/research-and-data/real-time-center/survey-of-professional-forecasters/.
Johannsen, Benjamin, and Elmar Mertens (2016). "The Expected Real Interest Rate in the Long Run: Time Series Evidence with the Effective Lower Bound," FEDS Notes. Washington: Board of Governors of the Federal Reserve System, February 9, http://dx.doi.org/10.17016/2380-7172.1703.
Kiley, Michael (2015). "What Can the Data Tell Us About the Equilibrium Real Interest Rate?" Finance and Economic Discussion Series 2015-077. Washington: Board of Governors of the Federal Reserve System, http://dx.doi.org/10.17016/FEDS.2015.077.
Laubach, Thomas, and John C. Williams (2003). "Measuring the Natural Rate of Interest," Review of Economics and Statistics, vol. 85 (November), pp. 1063-70.
Nakata, Taisuke (2016). "Optimal Fiscal and Monetary Policy with Occasionally Binding Zero Bound Constraints," Journal of Economic Dynamics and Control, vol. 73 (December), pp. 220-40.
-------- (2017). "Uncertainty at the Zero Lower Bound," American Economic Journal: Macroeconomics, vol. 9 (July), pp. 186-221.
Nakov, Anton (2008). "Optimal and Simple Monetary Policy Rules with Zero Floor on the Nominal Interest Rate," International Journal of Central Banking, vol. 4 (June), pp. 73-127.
Reifschneider, David, and John C. Williams (2000). "Three Lessons for Monetary Policy in a Low-Inflation Era," Journal of Money, Credit and Banking, vol. 32 (November), pp. 936-66.
1. I would like to thank Tilda Horvath for her technical assistance with the FRB/US model, Paul Yoo for his research assistance, and Stephanie Aaronson, Hess Chung, Eric Engen, and Matthias Paustian for useful comments and insightful discussions. The views expressed in this article, and all errors and omissions, should be regarded as those solely of the author, and are not necessarily those of the Federal Reserve Board or the Federal Reserve System. Return to text
2. In these models, the possibility of hitting the ELB in the future creates headwinds to the economy by depressing the expectations of households and firms on future economic activities and makes it optimal for the central bank to be more accommodative. Return to text
3. See Brayton and others (2014) for an overview of the FRB/US model and how public can access it. Return to text
4. When I compute ELB risk in a past quarter, say 2016:Q1, I use real-time projections, as of 2016:Q1, of the economy from 2016:Q1 to 2019:Q4. Note that, while the SEP and the SPF are conducted once every quarter, the SPD is conducted eight times a year at a FOMC frequency. I use the projection from the SPD conducted at the final month of each quarter." Return to text
5. There is some inertia in the default interest rate rule in the FRB/US model. We use a non-inertial rule to capture the fact that policymakers typically cut interest rates aggressively in the face of a looming recession. In sticky-price models that account for the ELB, such aggressive interest rate cuts are consistent with the prescription of optimal commitment policy and other well-performing rules, such as the price-level targeting rule and the rule proposed in Reifschneider and Williams (2000), even though these policies prescribe a gradual rate increase in the aftermath of a recession. In section 5.A, I also compute the ELB risk using a standard FRB/US model with an inertial interest rate rule. Return to text
6. The ELB constraint is set to 12.5 basis points. Details of the stochastic simulations are available on request. Return to text
7. For the SPF--which provides projections for three-month Treasury bill rates, but does not provide projections for the federal funds rate--the projection of three-month Treasury bill rates was translated into the projection of the federal funds rate by the FRB/US equations linking the two rates. Return to text
8. I start my analysis from 2016:Q1 instead of earlier periods because my ELB risk measures are one by construction when the current nominal interest rate is at the ELB. Return to text
9. As stated earlier, the past ELB risk measures are based on stochastic simulations around the real-time projection of the economy." Return to text
10. In the SPD and SEP, the flattening of the path in 2016:Q3 reflects not only the revision in near- and medium-term economic conditions, but also a reduction in the projection of the long-run federal funds rate. The long-run federal funds rate projections in the SPD and SEP were 2.88 percent and 3.00 percent in 2016:Q3, respectively, down from 3.00 percent and 3.13 percent in 2016:Q2. The long-run federal funds rate projection has been on a declining path since the inception of these two surveys, consistent with the declining trend in the estimated long-run values of real interest rates from various statistical models, including those developed by Johannsen and Mertens (2016), Kiley (2015), and Laubach and Williams (2003). Return to text
11. The steady-state value of the ELB risk is the model-implied probability that the federal funds rate will be at the ELB for at least one quarter during the next three years, conditional on the economy being at its steady state today. This concept is distinct from the unconditional probability that the federal funds rate is at the ELB. To compute the steady-state ELB risk shown in figure 2, we begin stochastic simulations from a steady state consistent with the long-run projection of each survey. In all three surveys, the long-run federal funds rate is projected to be near 3 percent. Return to text
12. In this article, I follow a common practice in FRB/US stochastic simulations and shut down several shocks. A monetary policy shock in the interest-rate rule is one such shock that is shut down. Return to text
Nakata, Taisuke (2017). "Model-Based Measures of ELB Risk," FEDS Notes. Washington: Board of Governors of the Federal Reserve System, August 23, 2017, https://doi.org/10.17016/2380-7172.2058.
Disclaimer: FEDS Notes are articles in which Board staff offer their own views and present analysis on a range of topics in economics and finance. These articles are shorter and less technically oriented than FEDS Working Papers and IFDP papers.