FEDS Notes
May 18, 2018
Monetary Policy Surprises and Monetary Policy Uncertainty
Michiel De Pooter, Giovanni Favara, Michele Modugno, and Jason Wu1
Executive Summary
The current level of monetary policy uncertainty is low by historical standards. One important question is whether this low uncertainty--perhaps reflecting confidence among market participants--manifests in pronounced movements of medium- and long-term interest rates when a monetary policy surprise is delivered. This note provides empirical evidence suggesting the answer to this question is "yes": after a monetary policy surprise, the reaction of medium- and long-term interest rates is more pronounced when the level of monetary policy uncertainty is low. In explaining this result, we find that after a given monetary policy surprise, primary dealers--key intermediaries in interest rate markets--tend to adjust their positions in the U.S. Treasury market and their exposures to interest rates more when the prevailing level of policy uncertainty is low than when it is high.
Introduction
Federal Reserve communications has changed significantly over the past two decades and have become increasingly transparent.2 Through the early 1990s, monetary policy decisions were not announced to the public. Today, the FOMC uses a variety of tools to communicate its economic outlook, policy decisions, and views about the policy path--including FOMC statements and minutes, post-meeting press conferences, the Summary of Economic Projections (SEP), as well as testimonies and speeches.
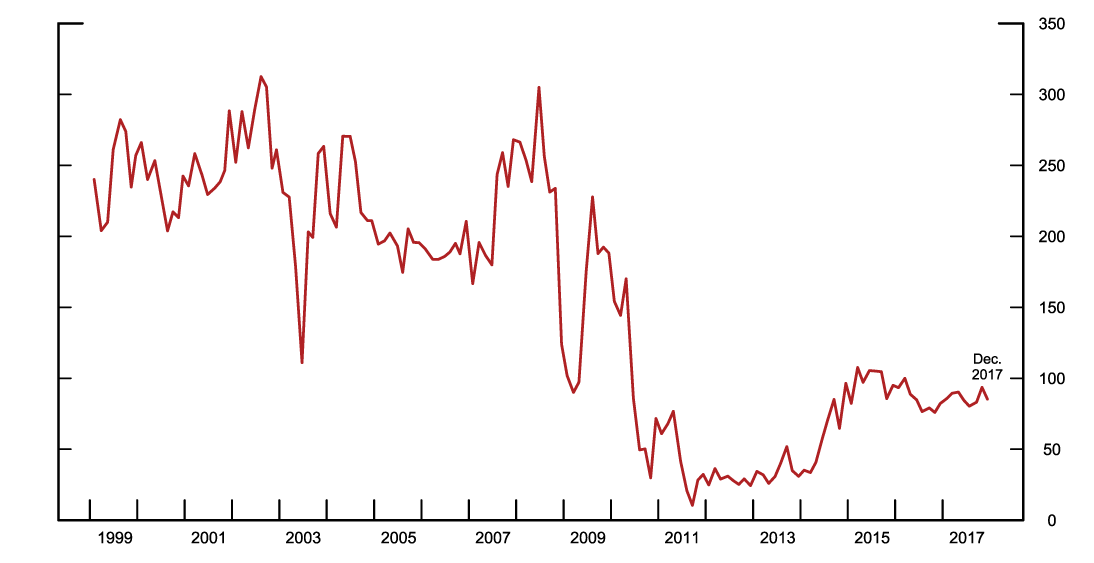
In part reflecting these changes, the perceived uncertainty about the path of monetary policy has changed noticeably over time. Figure 1 shows one measure of this uncertainty: the width of the federal funds rate one year ahead implied by derivative prices.3 As is evident, monetary policy uncertainty fluctuated pronouncedly in the early 1990s and 2000s, reached its nadir following the financial crisis--when the federal funds rate was at the zero lower bound and forward guidance was in effect--and moved up some in recent years as the FOMC has begun to lift interest rates away from the zero lower bound. Despite some increases in recent years, the prevailing level of uncertainty is still quite low by historical standards.
Even with abundant transparency, the market has nonetheless been surprised at times by monetary policy announcements--these surprises could originate from specific words in the statement language, SEP, or other communications material.4
This note examines how the reaction in interest rates to monetary policy surprises depends on the prevailing level of uncertainty surrounding the path of monetary policy. We find that medium- and long-term interest rates respond more to policy surprises when uncertainty is low. To explain these findings, we conjecture that market participants are more confident about the future path of monetary policy actions--and therefore willing to take riskier positions--when monetary policy uncertainty is low; in such circumstances, the pass-through of monetary policy surprises to interest rates is sizeable as market participants have to adjust their exposures whenever a surprise materializes. Consistent with this conjecture, we find that primary dealers--the most important financial intermediaries in interest rate markets--adjust their interest rate positions and Value-at-Risks (VaRs) more upon a monetary policy surprise when uncertainty is low than when uncertainty is high. To the best of our knowledge, we are the first to empirically evaluate this conjecture.
This analysis helps inform the debate on the effects of monetary policy communications. In principle, the more guidance a central bank provides to the public about the way its policy is likely to evolve, the lower the uncertainty about the path of policy and the greater the likelihood that interest rates move in a manner consistent with the intentions of the central bank. The results in this note suggests, however, that there is some risk to this strategy: assuming that policy surprises are unavoidable even under the most careful and deliberate communications strategy--perhaps for the reasons outlined by Stein (2014)--low monetary policy uncertainty may, through a risk-taking mechanism, manifest in sizeable market reaction to these surprises.5
Empirical Framework
The empirical framework in this note follows Gürkaynak, Sack, and Swanson (2005), Gilchrist, Lopez-Salido and Zakrajsek (2015), and Hanson and Stein (2015), among others. Monetary policy surprises in these papers are measured by changes in short-term interest rates (typically the two-year nominal Treasury yield) in a narrow time window around FOMC policy announcements. Since no other economic news is typically released during these time windows, changes in short-term interest rates can reasonably be attributed to policy communications that were not anticipated by market participants.6
For the remainder of this note, we use changes in the two-year nominal Treasury yield during a 60-minute window around FOMC announcements as our proxy for monetary policy surprises.7 We then study the impact of these monetary policy surprises on medium and long-term yields on U.S. nominal Treasury and Treasury Inflation-Protected Securities (TIPS). We are interested in the role that the level of monetary policy uncertainty plays in these regressions.
We employ the following regression framework: $$$$ \Delta f_d^m = \alpha + \beta \Delta {mp}_d + \gamma {Uncertainty\ }_{ d-1} + \delta \Delta {mp}_d \times {Uncertainty\ }_{ d-1} + \Omega_{d-1} + \varepsilon_d \ , $$$$ where d is the (second) day of a scheduled FOMC meeting; $$\Delta f_d^m$$ is the two-day change from d-1 to d+1 in the nominal or real Treasury yield, with maturity m equal to either 5- or 10-year; $$\Delta{mp}_d$$ is the 60-minute change in the two-year Treasury yield around the FOMC policy announcement -- our measure of monetary policy surprises; $${Uncertainty\ }_{d-1}$$ is the one-year ahead measure of monetary policy uncertainty implied by federal funds futures and Eurodollar futures options shown in Figure 1, measured on the day before an FOMC meeting.
This regression framework posits that the monetary policy surprise $$\Delta{mp}_d$$ affects yields directly through the parameter β, and that this relationship varies with the level of monetary policy uncertainty through the parameter δ. The vector $$\Omega_{d-1}$$ denotes a conditioning information set available the day before the FOMC meeting; it includes the level of the two-year Treasury yield--which controls for the possibility that the level of interest rates affects monetary policy uncertainty--as well as the VIX, and the Baker, Bloom, and Davis (2016) index of economic policy uncertainty--which are included to assuage the concern that the response of interest rates to monetary policy surprises may also depend on the level of economic and political uncertainty.8
We compile a list of monetary policy announcement days starting in 1999, the first year TIPS securities provide a reliable measure of real yields, through December 2017.9 Therefore, our sample includes a total of 152 scheduled policy announcements during the conventional (January 1999 to December 2008), unconventional (January 2009 to November 2015) and post zero lower bound monetary policy regime (December 2015 to December 2017).10
Results
Table 1 reports the estimates of the response of nominal and real yields to a monetary policy surprise, when the one-year ahead measure of monetary policy uncertainty is low, medium, or high--that is $${Uncertainty\ }_{d-1}$$ is equal to the value corresponding to the 25th percentile (81 basis points), median (183 basis points) and 75th percentile (234 basis points) of its distribution, respectively.11 Columns 1 and 2 use the 5- and 10-year nominal rate as dependent variables, respectively; columns 3 and 4 use the TIPS-implied real rates at those two horizons.
The estimated effects suggest that positive monetary policy surprises, or "tightening" surprises, are associated with an increase in nominal and real rates, but this increase is muted during periods of high monetary policy uncertainty. Based on columns 2 and 4, for example, a 10 basis point monetary policy surprise (approximately a two standard deviation move) is associated with roughly a 7 and 9 basis point increase in 10-year nominal and real rates, respectively, when the level of monetary uncertainty is at its median value. The response of nominal and real rates falls, however, to about 4 basis points, when the uncertainty about monetary policy is at the upper quartile of its distribution.
Table 1: Response of U.S. Treasury nominal and real yields to monetary policy surprises
| Dependent Variable | ||||
|---|---|---|---|---|
| Nominal Yields | Tips Yields | |||
| 5-year | 10-year | 5-year | 10-year | |
| (1) | (2) | (3) | (4) | |
| Low Uncertainty | 1.502*** (6.03) |
1.419*** (4.02) |
2.374*** (7.86) |
1.999*** (6.62) |
| Medium Uncertainty | 0.891*** (6.79) |
0.755*** (4.98) |
1.158*** (8.58) |
0.969*** (7.34) |
| High Uncertainty | 0.591*** (4.48) |
0.428*** (3.39) |
0.561*** (5.11) |
0.462*** (4.79) |
| Observations | 152 | 152 | 152 | 152 |
| R-squared | 0.33 | 0.25 | 0.53 | 0.45 |
NOTE: Reported coefficients denote the two-day response, around FOMC dates, of nominal and real U.S. Treasury yields (with five- and ten-year maturity) to monetary policy surprises for various levels of monetary policy uncertainty. Monetary policy surprises are proxied by the 60-minute change in the two-year nominal yield surrounding (15 minutes prior and 45 minutes after) FOMC announcements. Monetary policy uncertainty refers to the uncertainty, prevailing the day before FOMC dates, for the federal funds rate one-year ahead as implied by derivative prices. Low/Medium/High uncertainty corresponds to the lower, median and upper quartile of the monetary policy uncertainty historical distribution. Sample period is January 1999 to December 2017. ***, ** and * indicate statistical significance at 1%, 5%, and 10% level, respectively. t-ratios, based on robust standard errors, are shown in parenthesis below the estimated coefficients.
These results are consistent with the literature arguing that monetary policy surprises, as measured by high-frequency movements in short-term interest rates, have large effects on long-term interest rates (Gilchrist, Lopez-Salido, and Zakrajsek, 2015; Gertler and Karadi, 2015; Hanson and Stein, 2015; Nakamura and Steinsson, forthcoming). Our findings complement these existing studies by showing that the pass-through of monetary policy surprises to longer-term yields depends on the prevailing level of monetary policy uncertainty. The appendix at the end of this note shows that these results are robust to several alternative specifications, including the use of forward rates instead of yields as dependent variables; alternative measures of monetary policy surprises; and the exclusion of FOMC meetings with decisions and communications related to the Fed's LSAP programs.
Table 2 decomposes the changes in the nominal rate into a change in the expected short rate over 5- and 10-years (columns 1 and 2, respectively) and a change in term premium (columns 3 and 4). This decomposition is useful to assess whether low monetary policy uncertainty heightens the pass-through of policy surprises to expected future short rates or to the compensation demanded by investors for their exposure to interest rate risk on long-term securities.12
Table 2: Response of expected future nominal rates and term premia to monetary policy surprises
| Dependent Variable | ||||
|---|---|---|---|---|
| Expected rates | Term premium | |||
| 5-year | 10-year | 5-year | 10-year | |
| (1) | (2) | (3) | (4) | |
| Low Uncertainty | 0.526*** (5.35) |
0.472*** (5.55) |
0.631*** (6.11) |
0.755*** (5.68) |
| Medium Uncertainty | 0.301*** (3.41) |
0.260*** (3.82) |
0.363*** (7.53) |
0.420*** (7.04) |
| High Uncertainty | 0.190* (1.74) |
0.156* (1.89) |
0.231*** (5.03) |
0.255*** (4.81) |
| Observations | 152 | 152 | 152 | 152 |
| R-squared | 0.28 | 0.29 | 0.33 | 0.31 |
NOTE: Reported coefficients denote the two-day response, around FOMC dates, of future expected rates and term premiums for nominal U.S. Treasury yields (with five- and ten- year maturity) to monetary policy surprises for various levels of monetary policy uncertainty. Expected rates ad term premiums are estimated using the Kim and Wright (2005) model. Monetary policy surprises are proxied by the 60-minute change in the two-year nominal yield surrounding (15 minutes prior and 45 minutes after) FOMC announcements. Monetary policy uncertainty refers to the uncertainty, prevailing the day before FOMC dates, for the federal funds rate one-year ahead as implied by derivative prices. Low/Medium/High uncertainty corresponds to the lower, median and upper quartile of the monetary policy uncertainty historical distribution. Sample period is January 1999 to December 2017. ***, ** and * indicate statistical significance at 1%, 5%, and 10% level, respectively. t-ratios, based on robust standard errors, are shown in parenthesis below the estimated coefficients.
As shown in Table 2, the response of nominal rates to monetary policy surprises reflects predominantly changes to term premiums. For example, when uncertainty is at its 25th percentile, the effects in columns 3 and 4 suggest that the response of 5- and 10-year term premium, respectively, is about one-and-a-half times larger than those of the expected short rate (shown in columns 1 and 2). These results are consistent with those of Hanson and Stein (2015), who argue that a tightening surprise causes long-term yields to rise because yield-oriented investors sell long-term bonds, above and beyond what is required by the revelation of news about the expected path of policy. Similar to the results in Table 1, the higher monetary policy uncertainty, the smaller the responses--when uncertainty is at its 75th percentile, a 10 basis point tightening shock solicits a 2.5 basis point increase in the 10-year term premium, which is a bit less than half of the response--4.2 basis points--when uncertainty is at its median value.
Why are the effects of monetary policy surprises large when the level of uncertainty is low?
To explain the above findings, we explore the effects of monetary policy surprises on market participants, focusing on primary dealers--the most important intermediaries in interest rates markets and for which risk exposure data is available. Our hypothesis is that when uncertainty is low, dealers are positioned more aggressively in interest rate markets, and find themselves having to adjust their exposures substantially when a monetary policy surprise realizes.
To test this hypothesis, we focus on two related but distinct measures of risk-taking: changes in the duration-weighted net position of primary dealers in U.S. Treasury securities, and changes in the interest rate Value-at-Risk (VaR).13 The former captures the directional exposure of primary dealers in cash U.S. Treasury securities and forward contracts; the latter is a broader, "tail loss" measure of the interest rate trading book, encompassing both cash and derivative positions under interest rate trading desks.
Table 3: Response of broker dealers' net U.S. Treasury positions and interest rate VaR to monetary policy surprises
| Net position | Interest rates VaR | |
|---|---|---|
| 5-day change | 5-day change | |
| (1) | (2) | |
| Low Uncertainty | -0.033** (-2.41) |
-2.198* (-1.92) |
| Medium Uncertainty | -0.022** (-2.03) |
-1.578*** (-2.81) |
| High Uncertainty | 0.006 (1.00) |
-1.433** (-2.43) |
| Observations | 105 | 54 |
| R-squared | 0.15 | 0.19 |
NOTE: Reported coefficients denote the five-day changes, around FOMC dates, of primary dealers' duration-weighted net positions to U.S. Treasury securities (column 1) and interest rate Value-at-Risk (column 2) to monetary policy surprises for various levels of monetary policy uncertainty. Monetary policy surprises are proxied by the 60-minute change in the two-year nominal yield surrounding (15 minutes prior and 45 minutes after) FOMC announcements. Monetary policy uncertainty refers to the uncertainty, prevailing the day before FOMC dates, for the federal funds rate one-year ahead as implied by derivative prices. Low/Medium/High uncertainty corresponds to the lower, median and upper quartile of the monetary policy uncertainty historical distribution. Sample period is January 2005 to December 2017 in column 1 and January 2010 to December 2017 in column 2. ***, ** and * indicate statistical significance at 1%, 5%, and 10% level, respectively. t-ratios, based on robust standard errors, are shown in parenthesis below the estimated coefficients.
We use the same regression framework employed earlier to derive the results in Tables 1 and 2, but now replacing the dependent variable with the 5-day change around the day of a monetary policy announcement in either the average dealer's net position in Treasury securities or in the average interest rate VaR. When the dependent variable is the VaR, we also include the 5-day change in the interest rate volatility as measured by the MOVE index as additional control variable, as VaR could increase mechanically as interest rate volatility increases.
If our hypothesis is valid, a positive monetary surprise should be associated with a negative change in net positions as dealers pull back their duration exposures. Similarly, dealers would also reduce their overall exposures in interest rates, leading to a decline in VaR. These reactions should be higher when policy uncertainty is low. Table 3 shows that this is indeed the case. In column 1, when policy uncertainty is at its 25th percentile, a 10 basis points monetary tightening surprise leads to a 33 basis points decline in the average net positions, but that decline falls to 22 basis points as policy uncertainty increases towards its median value, and becomes insignificant when the policy uncertainty is at its 75th percentile. Column 2 shows that when uncertainty is at its 25th percentile, 10 basis points monetary surprise is associated with decline of roughly 22 percent (one-and-a-half standard deviation) in the average interest rate VaR. Again, the decline is muted as policy uncertainty increases.14
Conclusions
This notes provides evidence that medium and long-term interest rates respond more to monetary policy surprises when the prevailing level of uncertainty about the path of monetary policy is low. This evidence points to a non-trivial tradeoff for central banks' communications. On the one hand, clear communication enhances policy effectiveness by moving interest rates in a way the central bank intends. On the other hand, communications aimed to cement market expectations about the future path of policy may lead to large changes in long-term interest rates and thus financial conditions when a policy surprise materializes, upending the central bank's intentions.
References
Baker, S.R., N. Bloom, and S. Davis (2016), "Measuring Economic Policy Uncertainty", Quarterly Journal of Economics, Vol. 131. (No. 4), pp. 1593-1636.
Gertler, M., P. Karadi (2015), "Monetary Policy Surprises, Credit Costs, and Economic Activity", American Economic Journal: Macroeconomics, Vol 7. (No. 1), pp. 44-76.
Gilchrist, S., D. López-Salido, and E. Zakrajšek (2015), "Monetary Policy and Real Borrowing Costs at the Zero Lower Bound", American Economic Journal: Macroeconomics, Vol 7. (No. 1), pp. 77-109.
Gűrkaynak, R. S., B. Sack, and E. T. Swanson (2005), "Do Actions Speak Louder Than Words? The Response of Asset Prices to Monetary Policy Actions and Statements", International Journal of Central Banking, May, pp. 55-93.
Hanson, S. E. and J. C. Stein (2015), "Monetary policy and long-term real rates", Journal of Financial Economics, Vol. 115 (No. 3), pp. 429-448.
Iercosan, D., A. Kumbhat, M. Ng, and J. Wu (2017), "Trading activities at systematically important banks, part 1: recent trends in trading performance," FEDS Notes, Washington: Board of Governors of the Federal Reserve System, July 10, 2017, https://doi.org/10.17016/2380-7172.2023.
Kim, D and J H. Wright (2005), "An Arbitrage-Free Three-Factor Term Structure Model and the Recent Behavior of Long-Term Yields and Distant-Horizon Forward Rates", FEDS Working Papers 2055-33.
Mallaby, S. (2017), "Why the Fed Should Surprise Us More", Wall Street Journal, June 23, 2017.
Nakamura, E. and J. Steinsson (forthcoming), "High Frequency Identification of Monetary Non-Neutrality: The Information Effect," Quarterly Journal of Economics.
Stein, J. C. (2014), "Challenges for Monetary Policy Communications", speech delivered at the Money Marketers of New York University, New York, May 6.
Wynne, M. A. (2013), "A Short History of FOMC Communications", Federal Reserve Bank of Dallas Economic Letters, Vol. 8 (No. 8).
APPENDIX
Robustness
To assess the robustness of the results in Tables 1 and 2, this Appendix reports a battery of alternative empirical tests.
Table A1 uses the one-year forward nominal and real rates, ending in five- and ten-year-ahead, as dependent variables. As shown, the reaction of forward rates to monetary policy surprises follows the same pattern of yields documented in Table 1: nominal and real forwards rates increase following monetary policy surprises, but the increase is muted when the one-year ahead measure of monetary policy is higher.
Tables A2 and A3 check that the main results are not driven by unconventional monetary policy announcement, by excluding meetings with news related to the Fed's LSAP program. As shown, the responses of both yields and term premiums are essentially unchanged even after excluding 26 FOMC meetings between 2009 and 2015 with news related to QE1, QE2 and QE3.
Table A4 uses a different time window to measure changes in nominal and real yields. In our baseline specification we use two-day changes in 5- and 10-year yields around an FOMC meeting to account for the possibility that the full reaction of longer-term yields to an FOMC announcement may not be instantaneous (as documented, for example, by Gűrkaynak, Sack, and Swanson, 2005). As shown, our main results are qualitatively and quantitatively similar if we use, instead, the 60-minute changes in five- and ten-year yields around the policy announcements.
Finally, Tables A5 and A6 assess the robustness of the main results to two alternative measures of monetary policy surprises. In Table A5, the policy surprise is computed using the change in the two-year Treasury yields in a tighter window of 30-minute around an FOMC announcement, as opposed to a 60-minute windows as in the baseline specification. In Table A6, we use the monetary policy surprise of Nakamura and Steinsson (forthcoming), which is based on the 30-minute change surrounding FOMC announcements of the first principle component of interest rates at different maturities spanning the first year of the term structure. In all instances, the main findings that the response of medium and long-term yields to monetary policy surprises is muted during periods of high monetary policy uncertainty continue to hold.
Table A1: Response of U.S. Treasury forward rates to monetary policy surprises
| Dependent Variable | ||||
|---|---|---|---|---|
| Nominal 1-year forward | Tips 1-year forward | |||
| ending in | ending in | |||
| 5-year | 10-year | 5-year | 10-year | |
| (1) | (2) | (3) | (4) | |
| Low Uncertainty | 1.856*** (4.35) |
0.976* (1.94) |
2.513*** (5.67) |
1.157*** (4.11) |
| Medium Uncertainty | 0.930*** (5.14) |
0.456** (2.22) |
1.130*** (6.24) |
0.576*** (4.77) |
| High Uncertainty | 0.474*** (3.25) |
0.201 (1.23) |
0.449*** (4.10) |
0.290*** (2.81) |
| Observations | 152 | 152 | 152 | 152 |
| R-squared | 0.25 | 0.11 | 0.40 | 0.19 |
NOTE: Reported coefficients denote the two-day response, around FOMC dates, of one-year forward nominal and real U.S. Treasury rates ending in 5 and 10 years ahead to monetary policy surprises, for various levels of monetary policy uncertainty. Monetary policy surprises are proxied by the 60-minute change in the two-year nominal yield surrounding (15 minutes prior and 45 minutes after) FOMC announcements. Monetary policy uncertainty refers to the uncertainty, prevailing the day before FOMC dates, for the federal funds rate one-year ahead as implied by derivative prices. Low/Medium/High uncertainty corresponds to the lower, median and upper quartile of the monetary policy uncertainty historical distribution. Sample period is January 1999 to December 2017. ***, ** and * indicate statistical significance at 1%, 5%, and 10% level, respectively. t-ratios, based on robust standard errors, are shown in parenthesis below the estimated coefficients.
Table A2: Response of U.S. Treasury nominal and real yields to monetary policy surprises excluding LSAP meetings
| Dependent Variable | ||||
|---|---|---|---|---|
| Nominal Yields | Tips Yields | |||
| 5-year | 10-year | 5-year | 10-year | |
| (1) | (2) | (3) | (4) | |
| Low Uncertainty | 1.262*** (5.12) |
1.085*** (4.14) |
1.670*** (8.08) |
1.438*** (6.66) |
| Medium Uncertainty | 0.759*** (5.88) |
0.557*** (4.55) |
0.815*** (9.01) |
0.671*** (7.97) |
| High Uncertainty | 0.545*** (4.09) |
0.331*** (2.62) |
0.450*** (4.69) |
0.344*** (4.06) |
| Observations | 126 | 126 | 126 | 126 |
| R-squared | 0.29 | 0.18 | 0.42 | 0.36 |
NOTE: Reported coefficients denote the two-day response, around FOMC dates, of nominal and real U.S. Treasury yields (with five- and ten-year maturity) to monetary policy surprises for various levels of monetary policy uncertainty. FOMC dates exclude 26 FOMC meetings between 2009 and 2015 with news related to QE1, QE2 and QE3. Monetary policy surprises are proxied by the 60-minute change in the two-year nominal yield surrounding (15 minutes prior and 45 minutes after) FOMC announcements. Monetary policy uncertainty refers to the uncertainty, prevailing the day before FOMC dates, for the federal funds rate one-year ahead as implied by derivative prices. Low/Medium/High uncertainty corresponds to the lower, median and upper quartile of the monetary policy uncertainty historical distribution. Sample period is January 1999 to December 2017. ***, ** and * indicate statistical significance at 1%, 5%, and 10% level, respectively. t-ratios, based on robust standard errors, are shown in parenthesis below the estimated coefficients.
Table A3: Response of expected future nominal rates and term premia to monetary policy surprises, excluding LSAP meetings
| Dependent Variable | ||||
|---|---|---|---|---|
| Expected rates | Term premium | |||
| 5-year | 10-year | 5-year | 10-year | |
| (1) | (2) | (3) | (4) | |
| Low Uncertainty | 0.473*** (4.09) |
0.405*** (4.47) |
0.494*** (5.24) |
0.577*** (4.91) |
| Medium Uncertainty | 0.264*** (2.81) |
0.217*** (3.04) |
0.287*** (6.46) |
0.321*** (6.12) |
| High Uncertainty | 0.175 (1.57) |
0.137 (1.63) |
0.199*** (4.29) |
0.212*** (4.00) |
| Observations | 126 | 126 | 126 | 126 |
| R-squared | 0.23 | 0.23 | 0.26 | 0.24 |
NOTE: Reported coefficients denote the two-day response, around FOMC dates, of future expected rates and term premiums for nominal U.S. Treasury yields (with five- and ten- year maturity) to monetary policy surprises for various levels of monetary policy uncertainty. FOMC dates exclude 26 FOMC meetings between 2009 and 2015 with news related to QE1, QE2 and QE3. Expected rates and term premiums are estimated using the Kim and Wright (2005) model. Monetary policy surprises are proxied by the 60-minute change in the two-year nominal yield surrounding (15 minutes prior and 45 minutes after) FOMC announcements. Monetary policy uncertainty refers to the uncertainty, prevailing the day before FOMC dates, for the federal funds rate one-year ahead as implied by derivative prices. Low/Medium/High uncertainty corresponds to the lower, median and upper quartile of the monetary policy uncertainty historical distribution. Sample period is January 1999 to December 2017. ***, ** and * indicate statistical significance at 1%, 5%, and 10% level, respectively. t-ratios, based on robust standard errors, are shown in parenthesis below the estimated coefficients.
Table A4: 60-minute changes of U.S. Treasury nominal and real yields around FOMC announcements to monetary policy surprises
| Dependent Variable | ||||
|---|---|---|---|---|
| Nominal Yields | Tips Yields | |||
| 5-year | 10-year | 5-year | 10-year | |
| (1) | (2) | (3) | (4) | |
| Low Uncertainty | 1.404*** (9.18) |
1.032*** (4.80) |
1.758*** (9.04) |
1.208*** (4.86) |
| Medium Uncertainty | 1.069*** (17.44) |
0.766*** (8.98) |
1.558*** (10.07) |
1.075*** (5.42) |
| High Uncertainty | 0.905*** (24.50) |
0.635*** (12.69) |
1.022*** (15.32) |
0.693*** (11.01) |
| Observations | 153 | 153 | 112 | 127 |
| R-squared | 0.87 | 0.64 | 0.84 | 0.63 |
NOTE: Reported coefficients denote the 60-minute changes, around FOMC dates, of nominal and real U.S. Treasury yields (with five- and ten-year maturity) to monetary policy surprises for various levels of monetary policy uncertainty. Monetary policy surprises are proxied by the 60-minute change in the two-year nominal yield surrounding (15 minutes prior and 45 minutes after) FOMC announcements. Monetary policy uncertainty refers to the uncertainty, prevailing the day before FOMC dates, for the federal funds rate one-year ahead as implied by derivative prices. Low/Medium/High uncertainty corresponds to the lower, median and upper quartile of the monetary policy uncertainty historical distribution. Sample period is January 1999 to December 2017. ***, ** and * indicate statistical significance at 1%, 5%, and 10% level, respectively. t-ratios, based on robust standard errors, are shown in parenthesis below the estimated coefficients.
Table A5: Response of U.S. Treasury nominal and real yields to monetary policy surprises using alternative measure of policy surprises
| Dependent Variable | ||||
|---|---|---|---|---|
| Nominal Yields | Tips Yields | |||
| 5-year | 10-year | 5-year | 10-year | |
| (1) | (2) | (3) | (4) | |
| Low Uncertainty | 1.475*** (5.00) |
1.367*** (3.43) |
2.507*** (6.08) |
2.064*** (5.34) |
| Medium Uncertainty | 0.900*** (6.24) |
0.746*** (4.36) |
1.206*** (6.71) |
0.970*** (5.76) |
| High Uncertainty | 0.617*** (4.45) |
0.440*** (2.90) |
0.567*** (4.02) |
0.432*** (3.46) |
| Observations | 152 | 152 | 152 | 152 |
| R-squared | 0.24 | 0.18 | 0.44 | 0.36 |
NOTE: Reported coefficients denote the two-day response, around FOMC dates, of nominal and real U.S. Treasury yields (with five- and ten-year maturity) to monetary policy surprises for various levels of monetary policy uncertainty. Monetary policy surprises are proxied by the 30-minute change in the two-year nominal yield surrounding (10 minutes prior and 20 minutes after) FOMC announcements. Monetary policy uncertainty refers to the uncertainty, prevailing the day before FOMC dates, for the federal funds rate one-year ahead as implied by derivative prices. Low/Medium/High uncertainty corresponds to the lower, median and upper quartile of the monetary policy uncertainty historical distribution. Sample period is January 1999 to December 2015. ***, ** and * indicate statistical significance at 1%, 5%, and 10% level, respectively. t-ratios, based on robust standard errors, are shown in parenthesis below the estimated coefficients.
Table A6: Response of U.S. Treasury nominal and real yields to monetary policy surprises using Nakamura and Steinsson (forthcoming) measure of policy surprises
| Dependent Variable | ||||
|---|---|---|---|---|
| Nominal Yields | Tips Yields | |||
| 5-year | 10-year | 5-year | 10-year | |
| (1) | (2) | (3) | (4) | |
| Low Uncertainty | 3.679*** (4.56) |
2.552** (2.08) |
4.183*** (5.09) |
3.443*** (4.85) |
| Medium Uncertainty | 1.474*** (5.48) |
0.964** (2.62) |
1.397*** (5.83) |
1.083*** (5.22) |
| High Uncertainty | 0.746*** (3.00) |
0.440 (1.51) |
0.477** (2.57) |
0.305* (1.67) |
| Observations | 105 | 105 | 105 | 105 |
| R-squared | 0.29 | 0.19 | 0.30 | 0.28 |
NOTE: Reported coefficients denote the two-day response, around FOMC dates, of nominal and real U.S. Treasury yields (with five- and ten-year maturity) to monetary policy surprises for various levels of monetary policy uncertainty. Monetary policy surprises are proxied by the Nakamura and Steinsson (forthcoming) measure, which is the 30-minute change surrounding FOMC announcements (15 minutes prior and 15 minutes after) of the first principle component of interest rates at different maturities spanning the first year of the term structure. Monetary policy uncertainty refers to the uncertainty, prevailing the day before FOMC dates, for the federal funds rate one-year ahead as implied by derivative prices. Low/Medium/High uncertainty corresponds to the lower, median and upper quartile of the monetary policy uncertainty historical distribution. Sample period is February 2000 to March 2014. ***, ** and * indicate statistical significance at 1%, 5%, and 10% level, respectively. t-ratios, based on robust standard errors, are shown in parenthesis below the estimated coefficients.
1. The authors thank Andreas Lehnert, Beth Klee, Min Wei, and Egon Zakrajsek for helpful comments and suggestions. The views expressed in this note are those of the authors and do not necessarily reflect those of the Federal Reserve System. Return to text
2. For an overview of how FOMC communications have evolved over the past two decades see, e.g. Wynne (2013). Return to text
3. The width of the confidence interval for the federal funds rate is computed from the term structures for the expected federal funds rate--derived from federal funds futures--and implied volatility--derived from Eurodollar futures options. The latter is adjusted for the level difference in volatility between federal funds futures options and Eurodollar options. The measure shown is the distance between the 5th and the 95th percentiles of the implied federal funds rate distribution at the one-year horizon. Return to text
4. For example, during the "taper tantrum", in the summer of 2013, the surge in interest rates and the outflow of funding to various asset classes started when then-Chairman Bernanke first mentioned the possibility of tapering bond purchases in May 2013, and reversed only after the Fed communicated at the September FOMC its intention to delay tapering. One view to explain these sizeable market reactions is that participants could not separate the discussion of tapering from beliefs about the expected path of future short term interest rates. Another view is that the market equilibrium reflects trading between investors with different beliefs. Return to text
5. Stein (2014) argues that the market is a collection of actors with different beliefs, and the Committee's reaction function is not entirely predetermined but it naturally evolves over time. Market's conjectures about how the Committee will behave, and the Committee's signals about its intentions with respect to the future path of policy are therefore natural drivers of market reaction to policy decisions. Return to text
6. This is a plausible assumption, as FOMC announcements have mostly occurred at either 12.30p.m., 2:00pm or 2:15p.m., while major macroeconomic data are usually released at either 8:30a.m.or 10:00a.m., and corporate news is typically released after 4:00p.m. Return to text
7. Movements in the two-year yield capture news about the change in the policy rate itself and the expected path of the policy rate. In a robustness check, alternative measures of "target" and "path" shocks of Gűrkaynak, Sack, and Swanson (2005) replaced the two-year yield; the results presented below, however, were not significantly affected. Return to text
8. Two alternative measures of monetary policy uncertainty are: (1) the standard deviation across Blue Chip forecasts of the federal funds rate at horizons of two-quarter and one-year ahead, and (2) the standard deviation of the implied distribution of the federal funds rate at fixed-calendar horizons from the Federal Reserve Bank of New York's Survey of Primary Dealers. Both measures, however, have some limitations. The Blue Chip-based measure of monetary policy uncertainty is only available at the beginning of the month. Since there may be several weeks between the date of the surveys and the date of an FOMC meeting, this measure is not well suited to gauge monetary policy uncertainty the day prior to each FOMC meeting. The uncertainty measure from the Survey of Primary Dealers is typically available a week before the FOMC meeting. However, this series only has limited history which prevents us from including it in the regressions. Return to text
9. The beginning of the sample also coincides with the first year (May 1999) the FOMC started releasing a post-meeting statement at each meeting regardless of the policy action taken. Return to text
10. In a robustness check, following Hanson and Stein (2015) we also excluded some policy announcements after 2009 that contained significant news about the Fed's large-scale asset purchases (LSAPs), as long-term rate movements on these dates may be affected by other factors than the typical ones associated with conventional FOMC announcements. As shown in the Appendix, the main results are robust to such an exclusion. Return to text
11. These effects are calculated as $$\hat{\beta} + \hat{\delta} \times {Uncertainty\ }_{d-1}$$, where $$\hat{\beta}$$ and $$\hat{\delta}$$ are the estimated regression coefficients. Return to text
12. Term premiums are estimated using the Kim and Wright (2005) model. Return to text
13. The net position data is available for 22 primary dealers and can be found at https://www.newyorkfed.org/markets/pridealers_listing.html. The VaR data is captured by onsite supervisors at the ten Large Institution Supervision Coordinating Committee (LISCC) banks; see Iercosan et al. (2017) for details about the data. The metric used here is the interest rate VaR for the average LISCC bank. Return to text
14. One standard deviation in the log changes of the VaR is roughly 15 percent. Return to text
De Pooter, Michiel, Giovanni Favara, Michele Modugno, and Jason Wu (2018). "Monetary Policy Surprises and Monetary Policy Uncertainty," FEDS Notes. Washington: Board of Governors of the Federal Reserve System, May 18, 2018, https://doi.org/10.17016/2380-7172.2176.
Disclaimer: FEDS Notes are articles in which Board staff offer their own views and present analysis on a range of topics in economics and finance. These articles are shorter and less technically oriented than FEDS Working Papers and IFDP papers.