FEDS Notes
January 11, 2023
New Insights from N-CEN: Liquidity Management at Open-End Funds and Primary Market Concentration of ETFs
Fang Cai, Grace Chuan, Kevin Henry, Chaehee Shin, and Tugkan Tuzun1
1. Introduction
Structural vulnerabilities associated with open-end funds have received increasing attention among academics and regulators over the past few years. Despite the effort by policymakers to enhance the liquidity risk management practices at these funds,2 evaluating the availability, use and effectiveness of liquidity management tools continues to be a challenging task in assessing vulnerabilities in open-end funds, largely because comprehensive data on open-end funds' access to liquidity management tools remain scarce.
To improve our understanding of liquidity management practices at open-end funds, we explore a new dataset based on the SEC's N-CEN filings. In 2016, the SEC introduced Form N-CEN for registered investment companies as part of its reporting modernization effort (along with N-PORT).3 The form is to be filed once a year, no later than 75 days from the close of the fiscal year for which the form is being filed.
N-CEN contains census-type information about the investment company itself, the funds it operates, strategies employed, organization of the fund(s) as well as details of all service providers, hence allowing one to gather information about different facets that affect a fund's operations. Our focus here is N-CEN's new, updated questions on funds' liquidity management activities, which help us build a better understanding of the long-run usage of various liquidity tools by the funds. We also study information from N-CEN on gross creation and redemption volumes for exchange-traded funds (ETFs), by authorized participants (APs). Monitoring of these activities can provide insight into how ETF primary markets evolve over time as ETFs continue to increase their presence in financial markets.
Our main findings are as follows. Over our sample period of 2018-2021, we find zero usage of swing pricing—a major liquidity management tool widely adopted in Europe—by U.S. open-end funds, which is largely attributed to operational obstacles in the U.S. fund industry. Roughly half of funds had access to at least one line of credit from a bank or a syndicate of banks, and around 20% of these funds drew down on the line. Two percent of open-end funds engaged in interfund lending and three percent in interfund borrowing: money market funds (MMFs) were often the largest and the most patient lenders, and mutual funds the most frequent and the largest borrowers.
For ETFs, there is a high degree of concentration of APs, especially for fixed income ETFs and ETFs that hold international securities. Primary market activity is concentrated to about four active APs per ETF. We also find that nonbank APs' share of total creation and redemption of both U.S. and international equity ETFs has been growing since 2018.
2. Data
We source the individual fund-level data from the SEC's N-CEN filings in XML format, submitted by SEC-registered investment companies.4 The data are filed annually, based on the fiscal year ends that differ across funds.
For our analysis, we transform these filings to a calendar-year quarterly basis, using each filer's quarters that mark its fiscal year start and end. In the end, the final dataset covers filings of 274 unique fund families from 2018Q1 to 2021Q2. The number of unique open-end funds on average per quarter is 11,667 funds, comprising of 9,183 mutual funds, 2,045 ETFs, and 439 MMFs.
3. Liquidity Management Tools and Usage by U.S. Open-end Funds
There are three liquidity management tools available to U.S. open-end funds that are reported on N-CEN: swing pricing, credit lines, and interfund lending and borrowing arrangements.5 While low-frequency and unsynchronized reporting make it challenging to track quarterly developments, N-CEN provides new insights into the long-run usage of various liquidity tools by these funds.6
3.1 Swing Pricing
Swing pricing is a mechanism to apportion the costs of share redemptions or purchases on the transacting shareholders. Under the current fund pricing convention, fund investors have the right to transact their shares at the end-of-day fixed net asset value (NAV) of the fund portfolio. As a result, the price that a transacting shareholder receives does not take into account the corresponding transaction costs that may arise, because portfolio adjustments associated with shareholder transactions typically take place over multiple business days following the transaction requests. Thus, the costs of providing liquidity to transacting shareholders are borne by the non-transacting investors who remain in the fund, which dilutes the value of their shares.
Swing pricing allows fund managers to adjust the fund NAV up or down by a "swing factor" to account for the price impact and transactions costs associated with redemptions or new share purchases. It is considered a key tool to mitigate first-mover advantage in open-end funds (e.g., Jin et. Al., 2022).
Swing pricing has been widely adopted in Europe. In the United States, it was authorized by the SEC's liquidity management rule in 2016 (the amendments that permit funds to use swing pricing became effective in November 2018). However, no U.S. mutual fund has reported use of swing pricing so far on N-CEN.
The zero usage of swing pricing is largely due to operational barriers faced by fund managers.7 Funds, intermediaries, and service providers have not yet been able to work through operational issues in the current infrastructure. For instance, U.S. funds find it difficult to obtain timely information on their daily flows by 4pm to predict the factor of the swing adjustments that they should implement. On November 2, 2022, the SEC released a proposal to amend the 2016 rules that would require all mutual funds to use swing pricing and report details of such usage on N-PORT. In particular, to help operationalize the swing pricing requirement, the proposal includes a new "hard close" requirement for flow orders to be received by a fund before it sets its share price (usually at 4 pm ET).8
3.2 Credit Lines
Many open-end funds maintain credit lines with banks to prepare for times of stress when it becomes strenuous to meet redemption needs (Cai and Shin, 2021). Table 1 shows new insights from N-CEN about how widespread this practice is overall and across different types of open-end funds.
Table 1. Access to Credit Lines and Usage by Open-end Funds
| Average Across Sample Period (2018-2021) | Total Number of Funds | Number of Funds with Credit Line | Share of Funds with Credit Line (%) | Number of Funds that Used Credit Line | Share of Funds that Used the Line (%) |
|---|---|---|---|---|---|
| All OEFs | 11,667 | 5,541 | 47.3 | 1,104 | 19.9 |
| MFs | 9,183 | 5,046 | 54.8 | 1,015 | 20.0 |
| ETFs | 2,045 | 311 | 14.9 | 72 | 24.3 |
| MMFs | 439 | 185 | 42.0 | 17 | 8.7 |
Note: This table reports statistics for an average year-quarter during the sample period. Total number of funds for “All OEFs” is not equal to the sum of that for “MFs,” “ETFs,” and “MMFs” because each is based on average across the sample period. “Share of Funds with Credit Line” calculates the share based on number of funds. “Funds with Credit Line” refers to funds that had at least one credit line with a bank or a syndicate of banks. “Funds that Used Credit Line” refers to funds that drew down on at least one credit line. “Share of Funds that Used the Line” calculates the share based on number of funds with at least one credit line.
Source: SEC form N-CEN, authors’ calculation.
Across the sample period of 2018Q1-2021Q2, about half of all open-end funds had access to at least one credit line facility.9 Across fund types, mutual funds and MMFs had the largest shares of funds with a credit line, at 55% and 42%, respectively. Only 15% of ETFs had a credit line during the same period, consistent with the fact that ETFs tend to be less structurally vulnerable to redemption risks than other types of open-end funds.10
Over the sample period, there was a steady demand to draw down on credit lines. Out of all open-end funds that had at least one credit line, around 20% drew down on at least one credit line, on average. Interestingly, ETFs exhibited the highest share of drawdowns at 24% while only 9% of MMFs drew down on the credit line.
Table 2 summarizes additional findings from N-CEN on size of credit lines, including committed and used, and duration of outstanding lines, including some information that are available at the individual fund-level.11 At the aggregate level, committed credit lines comprised 0.45% of the aggregate total net assets of funds that had at least one credit line, consistent with previous findings from Cai and Shin (2021). Most credit line facilities are shared by multiple funds within the same fund family because individual fund net flows are hard to predict and a fund family usually manages a diverse spectrum of funds with different investment styles and clienteles, thereby enabling risk-pooling. In our data, an average of 51 funds share a credit line facility with an average of $443 million of commitment during our sample period.
Table 2. Size and Duration of Credit Lines to Open-end Funds
| Industry-level | Facility-level | (Sharing) Fund-level | ||
|---|---|---|---|---|
| Average Across Sample Period (2018-2021) | Aggregate Committed Credit Lines as a Share of TNA | Average Size of Committed Credit Line Facility ($Mil) | Average Size of Credit Line Drawdowns ($Mil) | Outstanding Days |
| All OEFs | 0.45% | 442.9 | 12.3 | 34 |
| MFs | . | . | 13.3 | 27 |
| ETFs | . | . | 5.0 | 106 |
| MMFs | . | . | 2.7 | 25 |
Note: “TNA” refers to the aggregate of total net assets of funds sharing a credit line facility. Usage of a shared credit line facility is usually apportioned based on multiple factors including the requesting fund’s TNA and the amount requested.
Source: SEC form N-CEN, authors’ calculation.
At the individual fund-level, an average fund drew down $12 million from a credit line in a quarter and the amount was outstanding for 34 days. Mutual funds were the largest borrowers while ETFs borrowed for the longest period, at 106 days.12
3.3 Interfund Lending and Borrowing
Another new aspect of information from N-CEN on liquidity management practices by open-end funds is interfund lending. Interfund lending and borrowing is an arrangement for funds belonging to the same fund family to lend liquidity to each other for temporary or emergency purposes. In general, under the Investment Company Act of 1940, open-end funds are prohibited from interfund lending and borrowing arrangements. However, individual fund families can apply for exemption to the SEC after meeting certain conditions.13
Naturally, there are benefits and costs to this program. The main benefit of interfund lending is that it can help funds meet the need for cash upon investor redemption and hence mitigate runs and lower liquidity costs of funds. On the other hand, the cost is born by the affiliated lending fund: the borrowing fund's delay in repayment to the lending fund could result in opportunity costs that may include a lost investment opportunity and/or additional borrowing costs, and there is also a risk that the borrowing fund could be completely unable to repay the loan when due. From N-CEN, we are able to learn about which types of funds are the beneficiaries vs. the cost-bearers, with additional information on magnitudes of the loans and for how long the loans are outstanding.
Table 3 shows summary statistics on access to interfund lending arrangements and usage. Overall, only two and three percent of all open-end funds lent and borrowed via these arrangements during our sample period, and an average loan lent was about $15 million with three outstanding days. The composition of lenders and borrowers reveals that MMFs are the largest and the most patient lenders in interfund lending, while mutual funds are the most frequent and the largest borrowers. These findings are consistent with our expectation that MMFs have the largest cash and cash-equivalent holdings to lend, and other types of funds hold relatively more illiquid securities which will sometimes entail an urgent need for cash.14
Table 3. Access to Interfund Lending/Borrowing and Usage by Open-end Funds
| Interfund Lending | ||||
|---|---|---|---|---|
| Average Across Sample Period (2018-2022) | Share of Funds that Lend (%) | Average Loan Amount ($Mil) | Average Loan as a Share of TNA (%) | Outstanding Days of a Loan |
| All OEFs | 1.8 | 14.7 | 0.4 | 2.6 |
| MFs | 2.2 | 8.4 | 0.5 | 2.2 |
| ETFs | 0.0 | . | . | . |
| MMFs | 1.7 | 23.6 | 0.3 | 3.1 |
| Interfund Borrowing | ||||
|---|---|---|---|---|
| Average Across Sample Period (2018-2022) | Share of Funds that Borrow (%) | Average Loan Amount ($Mil) | Average Loan as a Share of TNA (%) | Outstanding Days of a Loan |
| All OEFs | 3.1 | 14.9 | 0.9 | 2.7 |
| MFs | 3.9 | 15.0 | 0.9 | 2.7 |
| ETFs | 0.03 | 5.1 | 1.7 | 2.3 |
| MMFs | 0.2 | 1.1 | . | 1.7 |
Note: "Share of Funds that Lend" and "Share of Funds that Borrow" calculate the share based on number of funds. "TNA" refers to the fund's total net assets. In calculating "Average Loan as a Share of TNA," we proxy a fund's TNA with the monthly average net assets, for MFs and ETFs, and daily average net assets for MMFs, as reported on N-CEN. Information on TNA is missing for MMFs that rely on interfund borrowing.
Source: SEC form N-CEN, authors' calculation.
Most of the within-type, cross-sectional distributions are highly skewed to the right: some funds engage in larger amounts of interfund lending, up to $40 million and up to 1.5% as a share of their total assets, and some funds face longer outstanding days on the loans they made, up to 5 days (not shown). Additionally, funds that rely on interfund borrowing also show a higher reliance on another type of liquidity tool, namely, credit lines: around 80% of the funds that engaged in interfund borrowing simultaneously had at least one credit line while only 46% of funds that did not engage in interfund borrowing had at least one credit line.
4. ETFs and Primary Market Concentration
ETFs are often considered less susceptible to redemption risks than open-end mutual funds, largely due to the in-kind redemption feature of ETFs. In-kind redemption essentially transfers the cost of liquidity from an ETF to the redeeming market participant. While most ETFs' liquidity management practices are less in focus because of in-kind creation and redemption, ETFs play an important role in the liquidity of the broader financial system through APs' primary market activities (e.g., SEC, 2019, and Arora et al., 2020).15
Form N-CEN data provide a view into the concentration of the ETF primary market. Previous work has shown, for different points in time, that the number of contracted APs—firms signed up to create and redeem shares of an ETF—greatly exceeds proxies for the number of active APs, especially for the number of APs that account for most creation and redemption volume.16 In our analysis, we show primary market concentration for various asset classes using the most recent N-CEN data. Understanding the concentration of the ETF primary market can aid in the assessment of market functioning issues that may arise in the future, both for ETFs and the asset classes they reference. We also identify whether an AP is bank-affiliated to track institutional trends in ETF primary market activity.
Table 4 illustrates several features of the ETF primary markets for ETFs' fiscal year 2021 reporting. First, AP concentration is lowest for U.S. equity ETFs compared to other asset classes, as evidenced by the average number of active APs and lowest share of gross creation and redemption volume executed by the Top 3 APs. AP concentration is higher for fixed income ETFs, especially for high yield bonds, reflecting a higher degree of specialization needed to trade those assets. These findings are consistent with prior studies of ETF creation and redemption data.17
Table 4. Primary Market Statistics for U.S.-Listed ETFs
| Asset Class | Average Number of APs | Average Number of Active APs | Average Share of Gross Creation and Redemption | ||
|---|---|---|---|---|---|
| Top 3 APs for All ETFs | Top 3 APs for 10 Largest ETFs | Bank APs for all ETFs | |||
| U.S. Equities | 23 | 6 | 85% | 52% | 73% |
| International Equities | 25 | 4 | 90% | 94% | 89% |
| All Fixed Income | 28 | 4 | 93% | 77% | 90% |
| U.S. Corporate Bonds (IG+HY) | 29 | 5 | 92% | 74% | 90% |
| U.S. IG Corp. Bonds | 34 | 5 | 91% | 76% | 89% |
| U.S. HY Corp. Bonds | 29 | 4 | 95% | 91% | 90% |
| Commodities | 22 | 4 | 95% | 94% | 73% |
| Levered & Inverse ETFs | 19 | 4 | 91% | 89% | 75% |
Note: Based on FY 2021 data reported on Form N-CEN. Bloomberg attribute data for asset class, geographic focus, strategy and use of leverage were used to categorize ETFs. AUM data designating 10 Largest ETFs in each category as of August 15, 2022.
Source: Bloomberg Finance LP, Bloomberg Terminals (Open, Anywhere, and Disaster Recovery Licenses), SEC form N-CEN, authors' calculation.
Second, banks' share of creation and redemption activity is consistent with overall concentration in most asset classes. Banks account for the lowest share of U.S. equity ETF creation and redemption as compared to other asset classes, which again reflects the fact that other types of market participants are significant liquidity providers in the U.S. equity market. Banks account for a significantly higher share of fixed income ETF creation and redemption, reflecting their significant, long-term presence in the fixed income markets. Interestingly, AP concentration is high for commodity ETFs and levered/inverse ETFs, though banks' share of creation and redemption for those ETFs is comparatively low.
We also note some interesting findings regarding AP participation over time. While N-CEN data reveal only four years of primary market activity, some trends are worth observing over time as more data become available. Figures 1 and 2 show, for selected asset classes, the average number of active bank APs per ETF and bank APs' overall share of gross creation and redemption, respectively. First, for both U.S. and international equity ETFs, the average number of active bank APs declined over time and bank APs' overall share of equity creation and redemption declined. This trend is more pronounced for U.S. equities. With respect to international equities, this is an interesting trend to observe going forward given that banks have certain advantages such as greater balance sheet capacity to handle collateral requirements and operational efficiencies derived from global securities depositories.18 Banks appear to have maintained their share of fixed income ETF creation and redemption.
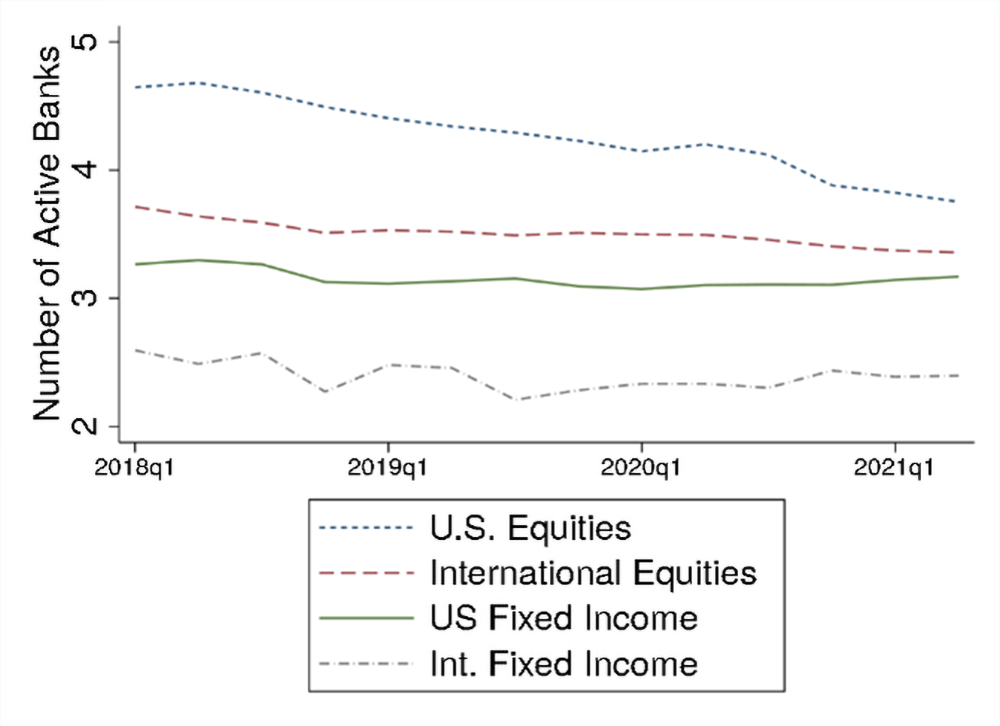
Note: The figures are based on FY 2018-FY 2021 data reported on Form N-CEN. Bloomberg attribute data for asset class and geographic focus were used to categorize ETFs.
Source: Bloomberg Finance LP, Bloomberg Terminals (Open, Anywhere, and Disaster Recovery Licenses), SEC form N-CEN, authors’ calculations.
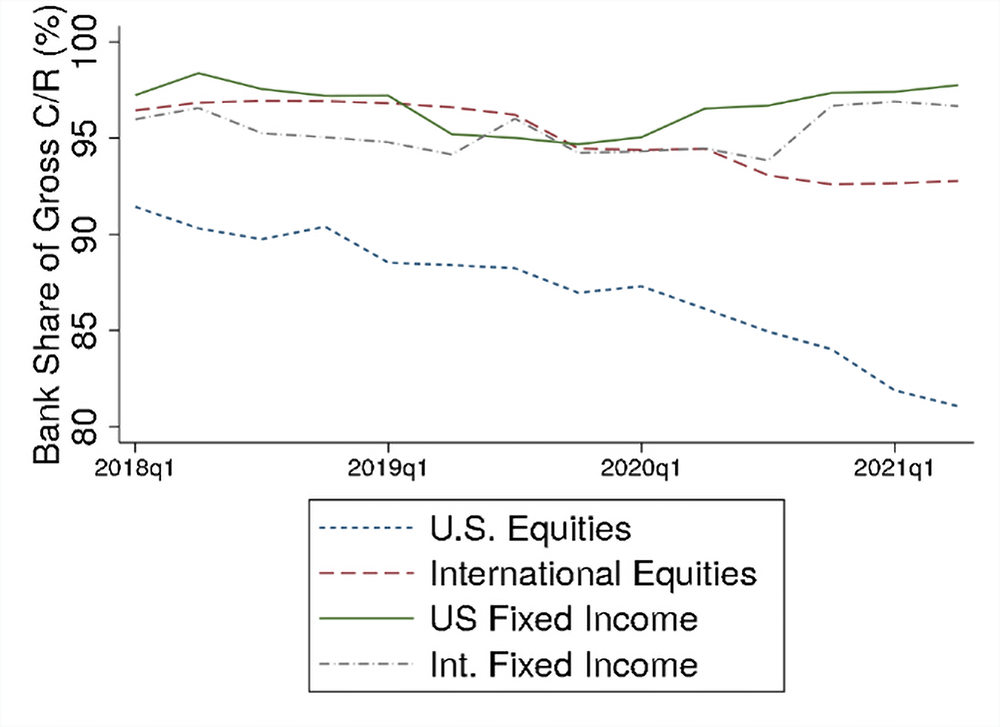
5. Conclusion
This note looks into a new dataset based on SEC's N-CEN filings to shed light on liquidity management practices at open-end funds, including swing pricing, lines of credit, and interfund lending. While N-CEN filings are helpful in monitoring long-term trends and cross-sectional differences in funds' access and usage of these tools, the low frequency and asynchronous reporting limit our ability to identify funds' usage of liquidity management tools around stress events. Moreover, there is no coverage of some other liquidity management tools, such as redemption fees and notice periods. The amendments to N-CEN and N-PORT in the SEC's recent proposal, if adopted, would be an important step to enhance the timeliness and transparency of fund reporting and disclosure. Closing the data gaps would enable regulators to better monitor funds' liquidity mismatch and their risk management from a financial stability perspective.
References
Agarwal, Vikas and Haibei Zhao, 2019, "Interfund Lending in Mutual Fund Families: Role in Liquidity Management," Review of Financial Studies, vol. 32 (10), pp. 4079 - 4115.
Arora, Rohan, Sébastien Betermier, Guillaume Ouellet Leblanc, Adriano Palumbo, Ryan Shotlander, 2020, "Concentration in the market of authorized participants of US fixed-income exchange-traded funds," Bank of Canada Staff Analytical Note 2020-27.
Cai, Fang, and Chaehee Shin, 2021, "Bank Borrowings by Asset Managers: Evidence from U.S. Open-End Mutual Funds and Exchange-Traded Funds," FEDS Notes. Washington: Board of Governors of the Federal Reserve System. https://doi.org/10.17016/2380-7172.2887
Financial Stability Oversight Council (FSOC), 2016, "Update on Review of Asset Management Products and Activities."
Investment Company Institute, 2016, "Evaluating Swing Pricing: Operational Considerations,". https://www.ici.org/system/files/attachments/ppr_16_evaluating_swing_pricing.pdf (PDF)
Investment Company Institute, 2020, "Experiences of US Exchange-Traded Funds During the COVID-19 Crisis". https://www.ici.org/doc-server/pdf%3A20_rpt_covid2.pdf (PDF)
Merwin, Samantha, Shreya Adiraju, and Alec Woodworth, 2019, "iShares Investigates: The ETF Ecosystem, Part 2 – Authorized participants by the numbers,". https://www.blackrock.com/corporate/literature/investor-education/ishares-investigates-authorized-participants-market-makers-part-2-en-us.pdf
Securities and Exchange Commission (SEC) Subcommittee on ETFs and Bond Funds, 2019, "Report on the Design of Exchange-Traded Funds and Bond Funds—Implications for Fund Investors and Underlying Security Markets Under Stressful Conditions."
1. The views expressed here are strictly those of the authors and do not necessarily represent the views of the Federal Reserve Board or the Federal Reserve System. Return to text
2. See, for example, Securities and Exchange Commission (SEC), 2016, Final Rule: Investment Company Liquidity Risk Management Programs (PDF); Financial Stability Board (FSB), 2017, Policy Recommendations to Address Structural Vulnerabilities from Asset Management Activities (PDF); International Organization of Securities Commissions (IOSCO), 2018, Recommendations for Liquidity Management for Collective Investment Schemes. Return to text
3. See SEC, 2016, Final Rule: Investment Company Reporting Modernization (PDF). Compliance dates were December 1, 2018 for larger entities and June 1, 2019 for smaller entities. Larger entities refer to funds that together with other investment companies in the same "group of related investment companies" have net assets of $1 billion or more as of the end of the most recent fiscal year of the fund. Return to text
4. Types of funds reporting on N-CEN include mutual funds, MMFs, ETFs, and unit-investment trusts. Return to text
5. Other possible liquidity management tools not reported in N-CEN include redemption fees, notice periods, extended settlement periods, redemptions in-kind, withdrawal limits, and temporary suspensions on redemptions. Funds may also manage fund portfolio liquidity risk with means such as holding certain amounts of the fund's portfolio in highly liquid investments, setting minimum cash reserves, etc. Return to text
6. For the same reasons, N-CEN provides only limited perspective on open-end funds' usage of liquidity tools at the onset of Covid outbreak: each investment company files N-CEN ending on different fiscal years and the filed information is aggregated over the fiscal year without any quarterly breakdown. On a rolling window basis that pools information from the overlapping filers in each year-quarter, the only piece of evidence on funds' higher usage of liquidity tools around the Covid outbreak is a slight increase in the share of funds with access to a credit line in 2020Q1, followed by a decrease in subsequent quarters. Return to text
7. See, for example, Investment Company Institute (2016). Return to text
8. See SEC, 2022, Proposed Rule: Open-End Fund Liquidity Risk Management and Swing Pricing (PDF). Currently, if a fund were to engage in swing pricing, it would only be required to report on Form N-CEN if the fund engaged in swing pricing during a given year and, if so, the swing factor upper limit established by the fund. The amendments would remove the reporting requirement on Form N-CEN and replace it with a new reporting requirement on Form N-PORT that would require information about the number of times the fund applied a swing factor during the month and the amount of each swing factor applied. Funds would also be required to report more information about their liquidity service providers on N-CEN. Return to text
9. A credit line facility can either be from one bank or a syndicate of banks: in our data, 21% of them took the form of syndicate loans, and an average of 10 banks comprised a syndicate. Return to text
10. See, for example, FSOC (2016). Return to text
11. Due to missing or sparsely populated data for some variables, certain information is only available at individual fund- or facility-level while other information is only available at the aggregate industry-level. Return to text
12. Within-type heterogeneity is also substantial: for instance, the days outstanding for mutual funds ranged from a minimum of 1 day to a maximum of 366 days. Return to text
13. Conditions usually stipulate that there is no better outside option for borrowing; that if a fund is borrowing, it cannot borrow more than a certain share of its net assets; and that, when a fund is lending, it cannot lend to another fund more than a certain share of its own assets. In March 2020, the SEC issued a temporary order to all open-end funds, with or without exemptive orders on interfund lending, to engage in interfund lending to navigate the market volatility at the time. Return to text
14. Agarwal and Zhao, (2019) also find that equity funds benefit from interfund lending programs by reducing cash holdings and avoiding runs, and it comes at the cost of MMFs experiencing more significant investor outflows after participating in the interfund lending program. Return to text
15. Some ETFs' liquidity management practices are vital to their operation, for example ETFs that own portfolios of bank loans. Other ETFs employ a mix of cash and in-kind creation and redemption, depending on their portfolios. Return to text
16. See Merwin et al. (2022) and Arora et al. (2020). Return to text
17. See Merwin et al. (2022), Arora et al. (2020) and Aquilina et al. (2019). Return to text
18. See Investment Company Institute (2020) for a discussion of collateral required in ETF creation and redemption. Return to text
Cai, Fang, Grace Chuan, Kevin Henry, Chaehee Shin, and Tugkan Tuzun (2022). "New Insights from N-CEN: Liquidity Management at Open-End Funds and Primary Market Concentration of ETFs," FEDS Notes. Washington: Board of Governors of the Federal Reserve System, January 11, 2023, https://doi.org/10.17016/2380-7172.3226.
Disclaimer: FEDS Notes are articles in which Board staff offer their own views and present analysis on a range of topics in economics and finance. These articles are shorter and less technically oriented than FEDS Working Papers and IFDP papers.