FEDS Notes
February 27, 2019
Who is Being Trained in Economics? A New Interactive Website for Exploring the Race, Ethnicity, and Gender of Economics Majors at U.S. Colleges and Universities
Amanda Bayer, Bo Yeon Jang, and David Wilcox
Women, African Americans, Hispanics, Native Americans, and other groups are greatly underrepresented in the field of economics. As of 2015-16, only 31 percent of assistant professors and 15 percent of full professors in economics departments in the U.S. were women. Similarly, African Americans and Hispanics made up only four percent of full professors and eight percent of assistant professors despite constituting 30 percent of the overall U.S. population.1
These imbalances trace back to the undergraduate level, where women receive only about 30 percent of degrees in economics awarded by U.S. institutions and underrepresented minorities (defined here to encompass blacks or African Americans, Hispanics or Latinos, and Native Americans) less than 15 percent. The share of women and underrepresented minorities among undergraduate students in economics has shown little net movement over the past quarter century, while other fields, including the sciences and mathematics, have achieved substantially better representation with regard to both gender and race/ethnicity.2
To induce and inform conversations about the profound demographic imbalances that persist in undergraduate economics, we worked with colleagues at the Federal Reserve Bank of New York to build an interactive website that allows visitors to explore data on who is being trained in economics at each college and university in the U.S.3 The site, "Who is Being Trained in Economics? The Race, Ethnicity, and Gender of Economics Majors at U.S. Colleges and Universities," is now available at https://www.newyorkfed.org/data-and-statistics/data-visualization/diversity-in-economics.
This note provides a brief users guide for the new interactive resource. A working paper posted earlier to the Federal Reserve's public website, Bayer and Wilcox (2017), provides additional details on the underrepresentation of women and historically underrepresented minorities in the economics major, describes the adverse consequences of that underrepresentation, and recommends steps for instructors, university administrators, textbook authors, students, and others to take to improve the situation within individual institutions and across the profession.4
A brief tour of the website
The website comprises five tabs. The Overview tab provides a brief introduction to the issue at hand and the functionalities of the website. The Scatterplots, Tables, and Scorecards tabs present the data in three interactive formats. Information on methodology, data, and the motivating paper is available in the About the Data tab.
All tables and figures present data on the rates at which students within different groups and schools major in economics for the five-year period from 2011 through 2015.5 Comparing these rates across demographic groups provides a measure of the degree of demographic imbalance, which is consistent across campuses of different sizes and compositions. If majoring rates were equal across genders and racial and ethnic groups at a given institution, the group of economics majors would be perfectly representative of the campus-wide population. The tables and figures present data on all 566 U.S. colleges and universities awarding bachelors degrees in economics, at the institution level and for various grouping of institutions.6
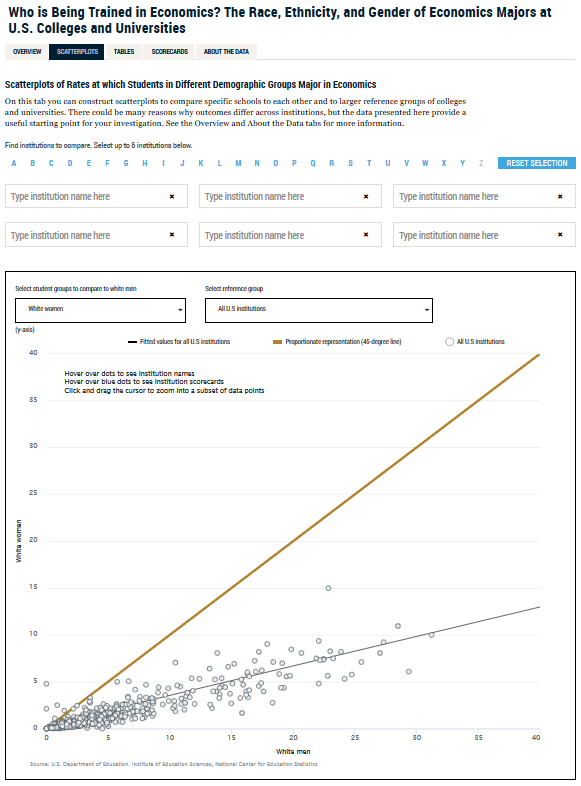
The Scatterplots tab provides a visual introduction to the data. Users can plot the rate at which white women, underrepresented minority women, or underrepresented minority men major in economics against the majoring rate of white men, institution by institution in a large interactive scatterplot. Non-Hispanic white men serve as the reference group, because this group is overrepresented in most departments and offers a convenient measure of the scale of the undergraduate economics major at each institution.7 Users can select up to six specific institutions, either via typing or through an alphabetical menu, to highlight within the scatterplot as blue dots. Positioning the cursor over the dot for a selected institution causes basic data about the institution to appear in a pop-up window. Users can also choose from among seven possible reference groups of institutions; observations for these peer institutions are plotted as grey dots.8
Certain elements appear in all scatterplots. First, all scatterplots include a 45-degree line, representing hypothetical points where students in the selected demographic group major in economics at the same rate as white men do; if the composition of the economics major at every institution perfectly replicated the composition of its campus-wide population, all observations would lie along these 45-degree lines. In contrast, the thin black line depicts the results from a simple linear regression using the actual data points for all U.S. institutions, and, in all three cases, the black fitted lines lie well below the 45-degree line, indicating that students in all three comparison groups--underrepresented minority men, white women, and underrepresented minority women--major in economics at much lower rates, on average, than do white men. In general, U.S. institutions tend to perform better in the inclusion of underrepresented minority men and worse in the inclusion of women, particularly underrepresented minority women.
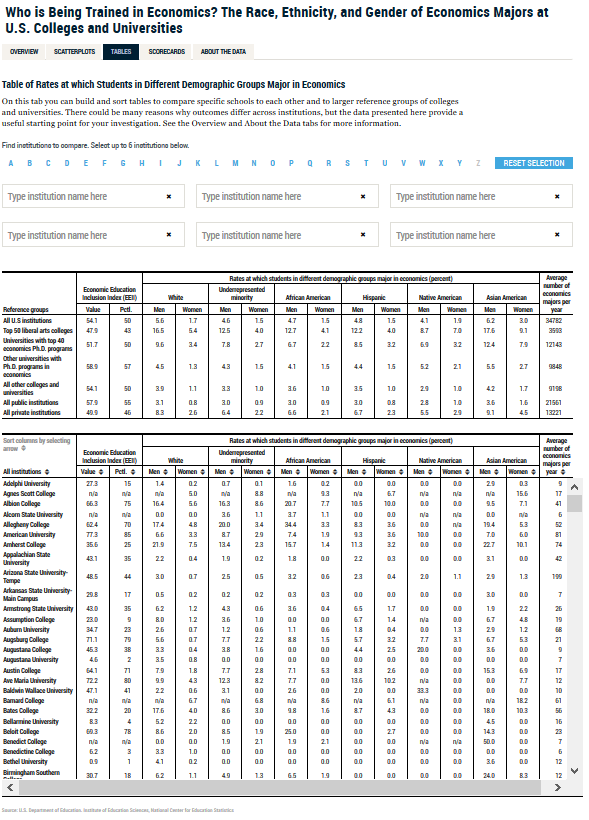
The Tables tab offers more detailed and disaggregated data in three sortable tables. The first table displays the average values for the seven reference groups of institutions available in the Scatterplots tab. The second table shows data for up to six user-selected institutions, while the third presents the full dataset of 566 institutions. Each table provides majoring rates for African American, Hispanic, Native American, and Asian American men and women in addition to the data on white and underrepresented minority men and women displayed in the Scatterplots Tab. Also included are values and percentiles for the Economic Education Inclusion Index (EEII) proposed in Bayer and Wilcox (2017). This index is constructed as the unweighted average of underrepresented groups' rates of majoring in economics relative to that of white men. By isolating the majoring rate for white men in the denominator, the index clearly indicates whether an institution replicates or resists the national pattern, and, by tracking major race/ethnicity by gender subgroups separately in the numerator, the index rewards progress towards inclusion of each group. The EEII can be used as a summary (but noisy) indicator of the overall inclusiveness of a given institution's economics program.
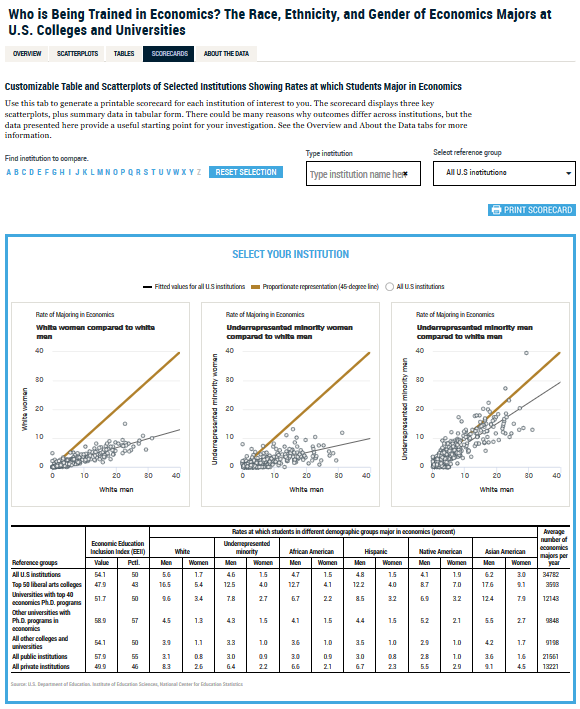
The Scorecards tab combines elements from the Scatterplots and Tables tabs to create a compact summary of an individual institution's performance in terms of inclusion. The user may select a single institution and a reference group from among the seven possible groups of reference institutions in the dataset. Three smaller charts plot the majoring rates of white women, underrepresented minority women, and underrepresented minority men against majoring rates for white men. These charts highlight the selected institution with a blue dot, and show the observations for the reference institutions using grey dots. Below the figures is a summary table containing data for the selected institution and all seven groups of peer institutions. The constructed scorecard can be printed using the "Print Scorecard" button for easy sharing; electronic copies of the scorecard, suitable for transmission by email, can be created by "printing" to a PDF file.
Conclusion
In our conversations with faculty and administrators around the country, we are struck by how many individuals are not aware of the basic facts regarding the demographic composition of economics students--even the students at their own institutions. Our main priority in designing this website is to build awareness of the state of diversity and inclusion in undergraduate economics. Greater salience should--we hope--generate additional inquiry by faculty, administrators, students, and others about the reasons for the profound imbalances that persist in undergraduate student engagement in economics. Most important, awareness is a precursor to action and the changes that can make undergraduate institutions and the economics profession more inclusive.
Bibliography
Bayer, Amanda, and Cecilia Elena Rouse (2016) "Diversity in the Economics Profession: A New Attack on an Old Problem" Journal of Economic Perspectives 30(4) 221-42.
Bayer, Amanda, and David Wilcox (2017) "The Unequal Distribution of Economic Education: A Report on the Race, Ethnicity, and Gender of Economics Majors at U.S. Colleges and Universities" Finance and Economics Discussion Series 2017‑105. Washington: Board of Governors of the Federal Reserve System, https://doi.org/10.17016/FEDS.2017.105.
1. Bayer and Rouse (2016) pp. 222 and 223. Return to text
2. Ibid, p. 224. Return to text
3. The team at the Federal Reserve Bank of New York was led by Dona Wong, and included Andrew Giannelli, Christine Sommo, Krista Schmidt, Charlene Raytek, Alan Chong, Clyde Goffe and Rouel Lanche. Return to text
4. Relative to the working paper posted to the Federal Reserve's public website, the dataset underlying the interactive website described in this note has been updated to incorporate revised data for 2015. Return to text
5. For example, if 100 underrepresented minority women graduated from a particular college in this time period and three of them majored in economics, the corresponding rate would be 3 percent. In calculating the rates at which students graduate with a major in economics, the numerator includes all students in the IPEDS completions dataset who have a "first" or "second" major in economics, which encompasses IPEDS Classification of Instructional Program codes for "Economics, General," "Agricultural Economics," "Applied Economics," "Econometrics and Quantitative Economics," "Development Economics and International Development," "International Economics" and "Economics, Other." The denominator counts each student only once and is equal to the number of bachelors degrees awarded. Return to text
6. These 566 institutions are the set of public or private not-for-profit, Title-IV participating four-year institutions that reported at least 25 U.S. citizen or permanent resident graduates with a major in economics between 2011 and 2015. The dataset includes all women's colleges, historically black colleges and universities (HBCUs), and Hispanic-serving institutions (HSIs) that satisfy these conditions. Return to text
7. At some institutions--particularly women's colleges, HBCUs, and HSIs--the use of white men as the reference group is not practicable. Bayer and Wilcox (2017) provide alternative metrics for these institutions. Return to text
8. The seven possible groups are: all U.S. institutions, top 50 liberal arts colleges, universities with top 40 economics PhD programs, universities with economics PhD programs not in the top 40, colleges and universities that neither have economics PhD programs nor are liberal arts colleges, all public institutions, and all private institutions. Return to text
Bayer, Amanda, Bo Yeon Jang, and David Wilcox (2019). "Who is Being Trained in Economics? A New Interactive Website for Exploring the Race, Ethnicity, and Gender of Economics Majors at U.S. Colleges and Universities," FEDS Notes. Washington: Board of Governors of the Federal Reserve System, February 27, 2019, https://doi.org/10.17016/2380-7172.2329.
Disclaimer: FEDS Notes are articles in which Board staff offer their own views and present analysis on a range of topics in economics and finance. These articles are shorter and less technically oriented than FEDS Working Papers and IFDP papers.