FEDS Notes
March 19, 2021
Non-Financial Corporate Credit and Recessions
Stephanie E. Curcuru and Mohammad R. Jahan-Parvar1
The global financial crisis of 2008-09 (GFC) followed an extended period of growth in non-financial corporate (NFC) sector debt. NFC debt resumed its climb a few years after the GFC, and the pace of growth picked up in 2020, as firms took on debt to cover revenue lost during the pandemic or to build up precautionary liquidity buffers (Figure 1). For advanced economies, the aggregate ratio of non-financial corporate credit to nominal GDP (henceforth NFC credit) neared a historically-high level of 100 percent of GDP in 2020:Q2. A natural question is whether these high levels of NFC debt will heighten the severity of pandemic-related recessions.
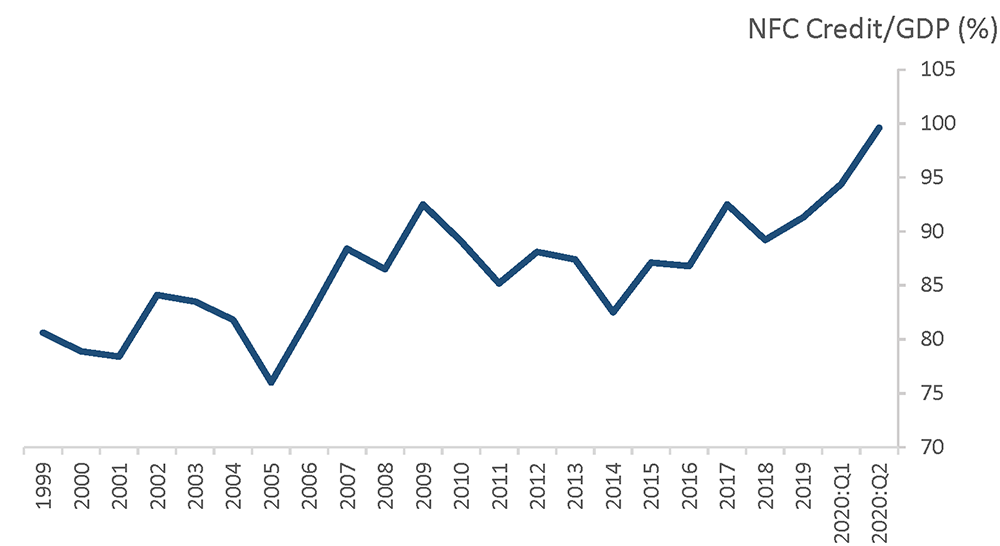
Source: Bank for International Settlements, BIS Data Bank, https://dbsonline.bis.org/.
In this note, we study whether high corporate credit levels increase the likelihood of recessions or the severity of recessions once they occur. While several studies have found a link between expansions in bank credit and financial crises (e.g., Schularick and Taylor 2012) or household debt and the severity of economic downturns (e.g., Mian et al. 2017 and Gomes et al. 2019), less is known about the relationship between NFC credit expansions and recessions.
We use 12 advanced economies in our analysis, listed in Table 1 along with summary statistics.2 Our data on NFC credit is from the Bank for International Settlements (BIS). To measure credit growth we construct the NFC credit-to-GDP gap, which is the difference between the level of the NFC credit-to-GDP ratio and its trend.3 We define credit expansions as five or more consecutive quarters of positive changes in the NFC credit gap. Using this definition, we identify 50 credit expansions in our sample. The average length of the NFC credit expansions in our sample is about 18 quarters, and on average the credit gap increases by 10 percentage points over that time. Our recession dates are from Haver Analytics, which collects data reported by national authorities. Our sample includes 43 recessions with an average length of 7 quarters.4 Finally, to measure recession depth we use seasonally-adjusted real GDP data reported by Haver Analytics. On average, real GDP contracts about 2 percent during the recessions in our sample. Our sample period runs from 1952 to 2020:Q2, though for some countries the sample period is shorter because of data availability.
Table 1: Summary Statistics
| Country | Expansions* | Recessions** | ||||
|---|---|---|---|---|---|---|
| Number | Average length (quarters) | Average Change in Gap (ppts.) | Number | Average length (quarters) | Average depth*** (%) | |
| Austria | 2 | 8.0 | 5.9 | 2 | 5.0 | -2.3 |
| Australia | 5 | 18.8 | 11.7 | 2 | 6.0 | -1.9 |
| Canada | 6 | 14.5 | 9.3 | 3 | 7.7 | -3.3 |
| France | 6 | 13.2 | 6.8 | 6 | 6.3 | -0.2 |
| Germany | 4 | 19.0 | 5.6 | 4 | 9.0 | -2.0 |
| Italy | 3 | 32.7 | 13.8 | 3 | 10.0 | -4.3 |
| Japan | 3 | 28.0 | 19.8 | 5 | 6.2 | -2.7 |
| Spain | 3 | 13.7 | 12.6 | 1 | 23.0 | -8.8 |
| Sweden | 4 | 20.8 | 20.2 | 2 | 9.0 | -5.3 |
| Switzerland | 4 | 7.8 | 6.3 | 2 | 7.0 | -1.8 |
| United Kingdom | 4 | 20.5 | 9.6 | 3 | 8.3 | -2.9 |
| United States | 6 | 23.8 | 5.7 | 10 | 4.3 | -1.7 |
| Sample | 50 | 18.3 | 10.1 | 43 | 7.0 | -2.4 |
*Expansions are five or more quarters of positive changes in the NFC credit/GDP gap. Source: Bank for International Settlements, BIS Data Bank, https://dbsonline.bis.org/.
**Source: Haver Analytics.
***Depth is the percent decline in real GDP from the quarter before the start of the recession to the minimum value during the recession. Source: Haver Analytics.
NFC Credit Expansions Are Not Reliable Recession Predictors
We first investigate whether NFC credit expansions make recessions more likely. Of the 43 recessions in our sample, 26 start during credit expansions or within 6 months after the end of expansions. However, the global credit expansion and subsequent output contraction of the GFC accounts for a large share of these recessions.5 Excluding the GFC, about half of the recessions – 17 of the 32 non-GFC recessions in our sample – are associated with a credit expansion (Table 2).
Table 2: Recession Length and Depth Statistics
| N | Length* (quarters) | Depth** (%) | |||||
|---|---|---|---|---|---|---|---|
| Mean | Median | Max | Mean | Median | Min | ||
| All Recessions | 43 | 7.0 | 6.0 | 23.0 | -2.4 | -1.5 | -8.8 |
| Excluding GFC | 32 | 7.0 | 7.0 | 15.0 | -1.4 | -1.2 | -5.2 |
| of which associated with NFC expansion*** | 17 | 6.8 | 6.0 | 14.0 | -1.5 | -1.5 | -5.2 |
We use a logit model to assess whether the NFC credit gap is an effective predictor of recessions. The logit model specification is:
$$$$ (1) \ \ \ \ logit(o^i_t) = \alpha^i_0 + \sum_{j=0}^k \beta^i_j{GAP}^i_{t-j} + \varepsilon^i_t, $$$$
where $$p^i_t$$ is the probability of a recession in country $$i$$, in year $$t$$, and $$logit(o^i_t) = \ln(\frac{p^i_t}{1-p^i_t})$$ is the log of the odds ratio, and $$GAP$$ is the NFC credit gap.6 We estimate the model for lags $$k$$ ranging between 0 (contemporaneous) and 12 quarters. The model captures cross-country predictive effects, in other words, whether credit gaps in a set of countries have implications for recessions in other countries.
To evaluate the model performance, we compute the area under the receiver operating characteristic (AUROC) curve. The AUROC statistic indicates the ratio of true positives to false positives implied by the model. A model which always correctly predicts whether an economy will be in a recession has AUROC=1, while a model which has an equal number of true and false positives has AUROC=0.5.
Table 3 Panel A reports the AUROCs from the logit model. The AUROCs are all between 0.64 and 0.65 and the t-statistics in square brackets show that the null hypothesis that AUROC = 0.50 is rejected at the 1 percent level. These results suggest that the NFC credit gap-based model produce true positives 64 to 65 percent of the time, and false positives 35 to 36 percent of the time. In panel B we repeat the exercise on the sub-sample that excludes the GFC. The AUROCs are slightly lower than their full-sample counterparts, producing true positives between 62 and 65 percent of the time. So our model based on NFC credit gaps performs only modestly better than a coin flip, and thus is not a reliable predictor of recessions.
Table 3: Effectiveness of NFC Credit Gap in Predicting Recession Occurrence
Panel A: Full Sample
| 0 Lags | 1 Lag | 4 Lags | 8 Lags | 12 Lags | |
|---|---|---|---|---|---|
| AUROC | 0.651 | 0.648 | 0.652 | 0.653 | 0.651 |
| [9.220] | [8.809] | [9.108] | [8.988] | [8.506] | |
| N | 2137 | 2125 | 2089 | 2041 | 1993 |
Panel B: Excluding GFC
| 0 Lags | 1 Lag | 4 Lags | 8 Lags | 12 Lags | |
|---|---|---|---|---|---|
| AUROC | 0.649 | 0.627 | 0.628 | 0.625 | 0.626 |
| [7.433] | [6.184] | [6.368] | [6.087] | [5.920] | |
| N | 1561 | 1549 | 1513 | 1465 | 1417 |
Estimates of equation (1) in the text. The sample in Panel B ends in 2007.
Student’s -t statistics testing the null hypothesis of AUROC = 0.5 in square brackets.
NFC Credit Expansions Do Not Increase the Severity of Recessions
We next investigate whether recessions in the wake of NFC credit expansions are longer or deeper than other recessions. Excluding the GFC, the average length of recessions which occur during NFC credit expansions or within 6 months after the end of an expansion is 6.8 quarters, slightly less than the average recession length of 7.0 quarters (Table 2). Further, the average decline in real GDP in recessions associated with credit expansions is -1.5 percent, close to the sample average -1.4 percent. Therefore, on average, recessions following credit expansions are neither longer nor much deeper than other recessions. This is in contrast to Jordà, Schularick, and Taylor (2013) which finds a significant link between the intensity of bank credit expansions and the severity of subsequent recessions.
The two scatterplots in Figure 2 further illustrate the relationship between changes in the NFC credit gap and the length of recessions in Panel A, and depth in Panel B. The figures show the change in the gap during the three years before the start of each recession along the x-axis, and either the recession length or depth on the y-axis. Table 4 reports the results of OLS regressions fitted to these data, with the line estimates shown on the figures. Larger credit expansions as measured by the change in the NFC credit gap in the three years preceding the recession are associated with shorter recessions, as the regression slope is negative though not statistically significant. This is also true when we exclude the GFC from the sample. The regressions on recession depth show that in the full sample larger increases in the gap during the expansion are associated with slightly deeper recessions in the full sample.7 This result is driven by the GFC, however, as the slope is slightly positive when we exclude GFC observations. The results are robust to alternative definition of recessions based on business cycle turning points.8 In sum, our analysis suggests that recessions closely following credit expansions are not longer than other recessions, and that outside of the GFC the size of the credit expansion does not have a statistically significant effect on the severity of a subsequent recession.
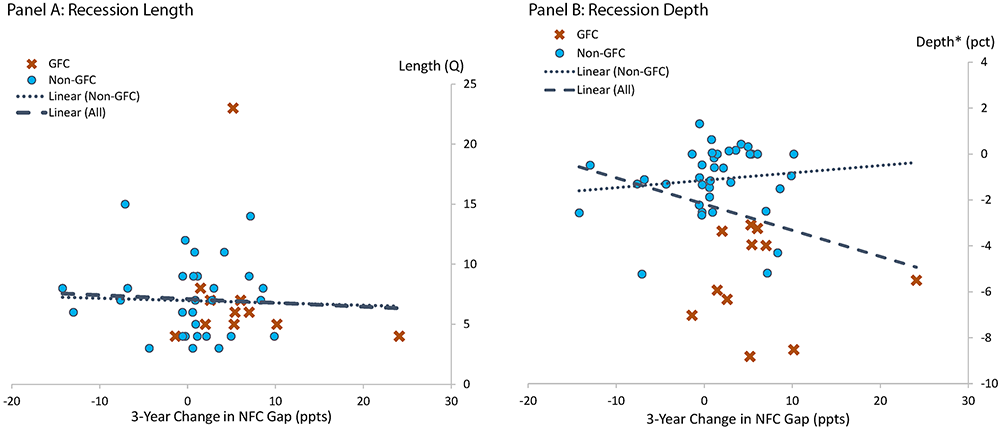
See Table 1 for variable definitions. Depth is the percent decline in real GDP from the quarter before the start of the recession to the minimum value during the recession. OLS regression lines fitted to the data also shown on the chart.
Table 4: Recession Regression Results
| Dependent Variable Independent Variable Sample | Length 3-Yr $$\Delta$$ gap All Recessions | Length 3-Yr $$\Delta$$ gap Excluding GFC | Depth 3-Yr $$\Delta$$ gap All Recessions | Depth 3-Yr $$\Delta$$ gap Excluding GFC |
|---|---|---|---|---|
| $$\alpha$$ | 7.11** | 6.98** | -2.18** | -1.35** |
| (0.61) | (0.58) | (0.38) | (0.28) | |
| $$\beta$$ | -0.03 | -0.02 | -0.11* | 0.004 |
| (0.09) | (0.10) | (0.06) | (0.05) | |
| R2 | 0.003 | 0.001 | 0.086 | 0.000 |
| N | 43 | 32 | 43 | 32 |
Estimates of the model: $${Depvar}^i_t = \alpha + \beta {Indvar}^i_t + \varepsilon_t$$.
See Table 1 for variable definitions. Standard errors in parentheses.
** and * indicate significance at the 1 percent and 5 percent levels, respectively.
Shifting the focus to all credit expansions, not just those closely followed by recessions, we examine what happens to output at the end of credit expansions. Of the 38 non-GFC credit expansions in our sample, half (19) have a recession occur during the expansion or within 6 months after the expansion ends (Table 5). So the GFC pattern where NFC expansions were followed by recessions does not hold more generally, as our data show that recessions are not an inevitable outcome of NFC expansions.
Table 5: NFC Credit Expansion Length and Gap Change Statistics
| N | Length* (quarters) | Gap Change** (ppts) | |||||
|---|---|---|---|---|---|---|---|
| Mean | Median | Max | Mean | Median | Min | ||
| All NFC Expansions | 50 | 18.3 | 16 | 45 | 10.0 | 8.6 | 36.5 |
| Excluding GFC | 38 | 18.8 | 16 | 45 | 9.2 | 8.1 | 25.3 |
| of which associated with recession*** | 19 | 19.6 | 16 | 42 | 7.5 | 7.5 | 20.4 |
Digging deeper into the relationship between the size of expansions and future changes in output, the scatter plot in Figure 3 plots the size of each credit expansion against the change in real GDP over the year following the boom. Table 6 reports the coefficients from fitting an OLS regression through these data points. The slope of the regression line is positive but not statistically significant. Thus our analysis suggests the bigger NFC credit expansions do lot lead to greater real GDP declines – in fact, bigger booms may lead to bigger growth.
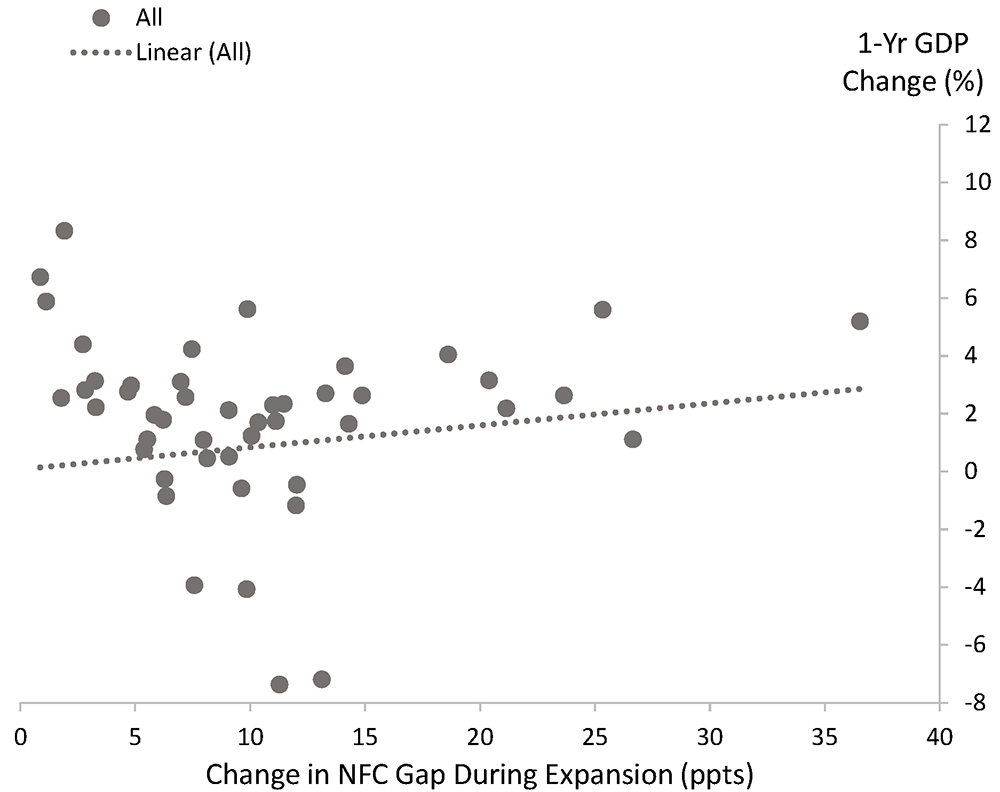
See Table 1 for variable definitions. The change in real GDP during the year following the end of the credit expansion is plotted on the y axis.
Table 6: Credit Expansion Regression Results
| Dependent Variable Independent Variable Sample | 1-Yr $$\Delta$$ GDP Expansion $$\Delta$$ gap All Credit Expansions | 1-Yr $$\Delta$$ GDP Expansion $$\Delta$$ gap Excluding GFC |
|---|---|---|
| α | 0.07 | 0.14 |
| (1.24) | (1.65) | |
| β | 0.08 | 0.07 |
| (0.10) | (0.15) | |
| R2 | 0.012 | 0.007 |
| N | 50 | 38 |
Estimates of the model: $${Depvar}^i_t = \alpha + \beta {Indvar}^i_t + \varepsilon_t$$.
See Table 1 for variable definitions. The dependent variable is the change in real GDP during the year following the end of the credit expansion. Standard errors in parentheses.
Implications for Pandemic-Related Recessions
Our analysis shows that NFC credit expansions are not reliable predictors of subsequent recessions, and do not make recessions longer or deeper if they occur. We find that only about half of recessions closely follow NFC credit expansions, and the opposite is also true – only about half of expansions are followed by recessions. In other words, the global aggregate credit expansion and subsequent recession which occurred during the GFC is not typical. An important implication of our results is that the record NFC debt levels arising from the 2020 global pandemic do not necessarily suggest that pandemic-driven recessions which are ongoing in many countries will be unusually severe. In fact, as shown in Figure 4, countries with larger NFC credit expansions through the second quarter of 2020 did not experience materially deeper recessions during the first several quarters of the pandemic-related shutdowns. As suggested in Mian et al. (2017) and Gomes et al. (2019) among others, increases in household debt, which grew only modestly through 2020:Q2, likely plays a more important role in recession severity.
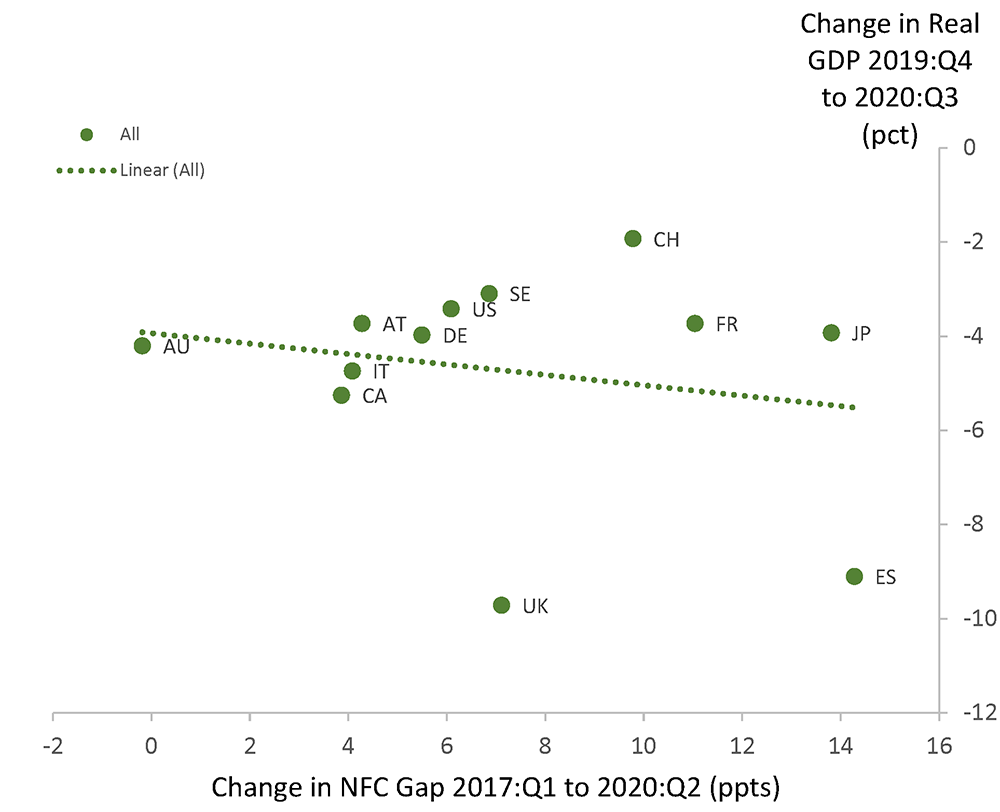
See Table 1 for variable definitions.
References
Gomes, J., M., Grotteria, M., and Wachter, J., 2019. Foreseen Risks, NBER Working Paper No. 25277.
Harding, D., and A. Pagan, 2002. Dissecting the cycle: a methodological investigation. Journal of Monetary Economics 49 (2), 365-381.
Hodrick, R. J., Prescott, E. C., 1997. Postwar U.S. business cycles: An empirical investigation. Journal of Money, Credit and Banking 29 (1), 1–16.
Jordà, Ò., M. Schularick and A.M. Taylor, 2013. When Credit Bites Back. Journal of Money, Credit and Banking, Supplement to 45 (2), 3-28.
Mian, A., A. Sufi, and E. Verner, 2017. Household Debt and Business Cycles Worldwide, The Quarterly Journal of Economics, 132(4), 1755–1817.
Schularick, M., Taylor, A. M., 2012. Credit booms gone bust: Monetary policy, leverage cycles, and financial crises, 1870-2008. American Economic Review 102 (2), 1029–1061.
1. We thank Noah Feldman, Jamil Rahman, and Jiwook Yoo for excellent research assistance. The analysis and conclusions set forth are those of the authors and do not indicate concurrence by other members of the staff or the Board of Governors of the Federal Reserve System. Return to text
2. Country selection based on availability of NFC credit data. Return to text
3. We construct the NFC credit/GDP gaps using a Hodrick and Prescott (1996) filter with the smoothing parameter, λ, set equal to 400,000 to identify the trend and cyclical component in the NFC credit/GDP series published by the BIS. Return to text
4. We exclude the recession associated with German reunification. Return to text
5. Australia is the only country in our sample that did not experience a recession during the GFC. Return to text
6. The error terms, $$\varepsilon^i_t$$ are assumed to have i.i.d. standard normal distributions. Return to text
7. Real GDP does not contract in a number of recessions in our sample because the official recession dates in several countries take into account factors such as unemployment in addition to changes in real GDP. Return to text
8. Our results are nearly identical when we define recessions using the Bryen-Boschen procedure described by Harding and Pagan (2002), which identifies cyclical peaks and troughs of real output based on local maxima and minima. Return to text
Curcuru, Stephanie E., and Mohammad R. Jahan-Parvar (2021). "Non-Financial Corporate Credit and Recessions," FEDS Notes. Washington: Board of Governors of the Federal Reserve System, March, 19, 2021, https://doi.org/10.17016/2380-7172.2877.
Disclaimer: FEDS Notes are articles in which Board staff offer their own views and present analysis on a range of topics in economics and finance. These articles are shorter and less technically oriented than FEDS Working Papers and IFDP papers.