FEDS Notes
March 24, 2023
Nonresidential construction spending is likely not as weak as it seems1
Eirik Brandsaas, Daniel Garcia, Joseph Nichols, and Kyra Sadovi
Unlike any other major component of GDP, private investment in nonresidential structures excluding drilling and mining (henceforth "NRS") has steadily declined since the start of 2020. Figure 1 shows the evolution of GDP as well as the main components of private domestic final demand since 2019. In the first half of 2020, spending declined across the board, reflecting the pause in economic activity in the early days of the pandemic. Thereafter, spending in all sectors – except NRS – began to recover. By the third quarter of 2022, NRS is estimated to have declined almost 25 percent from its value in 2019, whereas all other major sectors remained at a level similar or markedly higher than the pre-pandemic level.
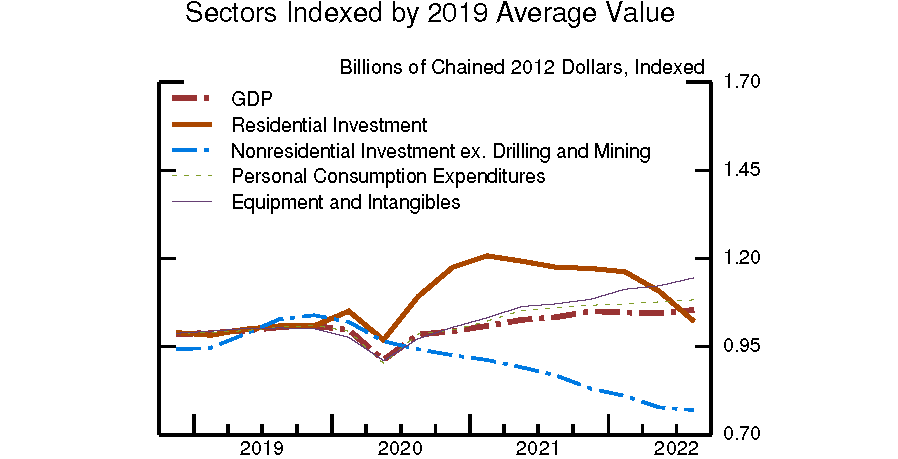
At first glance, the weak trajectory of spending in nonresidential structures is not necessarily surprising. Some of the recent weakness is plausibly explained by weak demand for new office space, though the office sector accounted for only about 15 percent of NRS spending in 2019.2 More broadly, spending on NRS tends to remain weak following a recession in part reflecting the long time it takes to plan and build nonresidential construction (Green, 1997; Millar, Oliner, & Sichel, 2016).
That said, this recession has been atypical in a number of ways, and we argue that recent patterns in nonresidential investment present a puzzle. Real spending on nonresidential structures has steadily declined for three years despite several sector-specific indicators showing at least partial recovery after 2020. Our goal in this note is to document this puzzle and then explore potential explanations, with the preponderance of evidence suggesting that actual NRS spending is likely not as weak as measured spending.
We do this by estimating a model of NRS spending based on sector-specific indicators and find measured spending in 2022Q3 is about 20 percent lower than predicted by the model. We then examine the measurement of nominal and real NRS spending in the official statistics. We argue that actual NRS spending is likely not as weak as measured spending, owing to the interaction of measurement issues with the extraordinary runup in construction costs in the sector.
The recovery in spending indicators
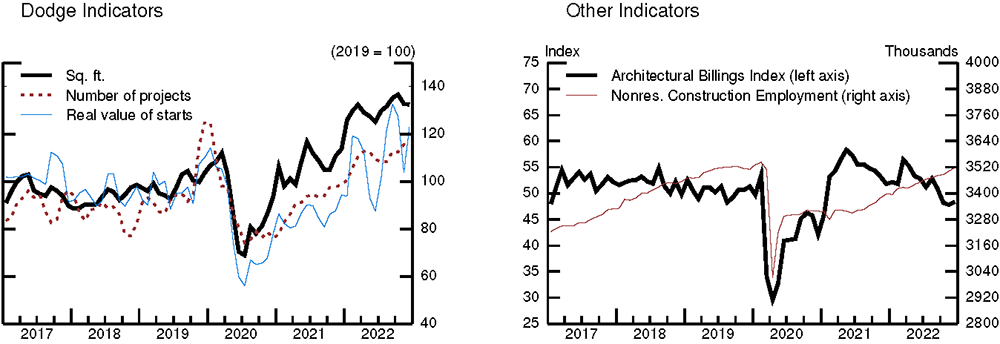
The steady decline in NRS spending since early 2020 is surprising considering the recovery in various sector-specific indicators, shown in Figure 2. The left panel shows the number, square footage, and real dollar value of new nonresidential projects, based on estimates from Dodge Data & Analytics (DDA), a data analytics firm specializing in the construction industry. After a sharp but brief decline in the first half of 2020, these indicators began to recover, reaching by 2022Q3 levels similar to or above their respective 2019 levels. The recovery in these indicators of new projects is noteworthy. First, as will be discussed shortly, the U.S. Census Bureau uses some indicators from DDA as an input to estimate nominal NRS spending. Second, the DDA aggregates shown in the left panel of Figure 2 are helpful in predicting NRS spending.
Left Figure:
Note: 3-month moving averages of seasonally adjusted series for nonresidential buildings. The real value of starts is the nominal value deflated using BEA prices. Source: DDA, BEA, and authors’ calculations.
Right Figure:
Note: Nonresidential employment for building construction and specialty trade workers. Source: CES and American Institute of Architects.
The right panel of Figure 2 shows other indicators of NRS spending. Employment in nonresidential construction remains below its pre-pandemic level, but it posted solid gains in both 2021 and 2022. The Architecture Billings Index (ABI), a leading indicator of nonresidential spending (see e.g. Baker & Saltes 2005), also suggested an at least partial recovery in spending. The ABI, a diffusion index summarizing what percentage of architecture firms report increases in billings, crashed in 2020 but surged in 2021 and remained at a level consistent with growth for most of 2022.3
In the wake of the Great Recession, all these indicators had remained weak for some time, consistent with the slow recovery in NRS investment. The puzzle we discuss is why do we see a similarly weak path of NRS investment during the current cycle despite much stronger signals from these indicators.
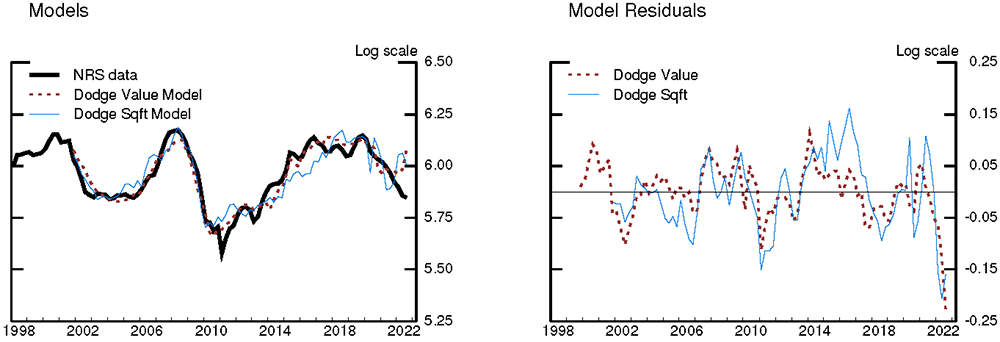
To quantify this puzzle, we estimate a model of real non-drilling NRS. We estimate a simple descriptive model, so we opt for a relatively parsimonious specification.4 The model is based on contemporaneous and lagged data from Dodge as well as NRS construction employment from the Current Employment Statistics (CES). For the Dodge data, we estimate two separate models using two related indicators: the real dollar value of Dodge starts (deflated using BEA NRS prices) and aggregate square feet of building construction projects.
$$$$ {log}(NRSexDM_t )= \beta + \sum_{l=0}^{7} \gamma_t log(Dodge_{t-l})+ \sum_{l=0}^{3} \delta_l log(ConstrEmplNRS_{t-l}) + \epsilon_t $$$$
We estimate both models using all available data from 2002 through 2019. We use the estimated coefficients to predict NRS in each quarter (see Figure 3 below) through 2022Q3. In the pre-pandemic period, we see a very strong overlap between measured and predicted NRS, for both models using alternative Dodge indicators. Currently, the model residuals (right panel) are larger than the largest residuals observed pre-pandemic. Indeed, the models suggest the measured level of real NRS investment could be about 20 percent too low, suggesting that the level of GDP would be about 40 basis points too low.
Left Figure:
Source: For NRS data, the BEA; DDA; and authors’ calculations.
Right Figure:
Note: Model predicted values and residuals estimated using data from 2002 to 2019.
Measurement of real spending on nonresidential structures
The fact that indicators for real investment predict much higher spending than measured suggests that actual NRS investment may not be as weak as the published statistics suggest. To better understand why actual NRS spending may not be as weak, we now discuss details of the official measurement of real spending on NRS. 5 The nonresidential sector is comprised of different subsectors such as offices, warehouses and malls, hospitals, and manufacturing structures like factories. The Bureau of Economic Analysis (BEA) estimates real output for each subsector by dividing nominal output by sector-specific deflators, mainly producer price indexes (PPIs) developed by the Bureau of Labor Statistics (BLS). The measurement of nominal output is based on a construction spending survey conducted by the U.S. Census Bureau (Census). The estimate of nominal output is based on both responses from responding firms as well as imputations for non-responding firms. We now discuss potential issues with both nominal output (related to imputed spending) and the sectors' deflator that might explain the gap between predicted spending by our model and measured spending.
To measure nominal private nonresidential construction, the Census surveys a stratified sample of construction projects obtained from Dodge Data & Analytics (DDA) data, and project managers then report on the value of work ("value-in-place") done each month from project start to completion.6 The Census has to impute a large fraction of spending – in 2021, about 70 percent – to account for nonresponding projects.7 For non-responding projects, monthly imputed spending is based on time-to-build patterns for responding projects, subject to a cap on imputed spending.8 Over time, imputation rates tend to fall as more projects eventually respond and the estimates of nominal spending are revised to reflect these late responses.
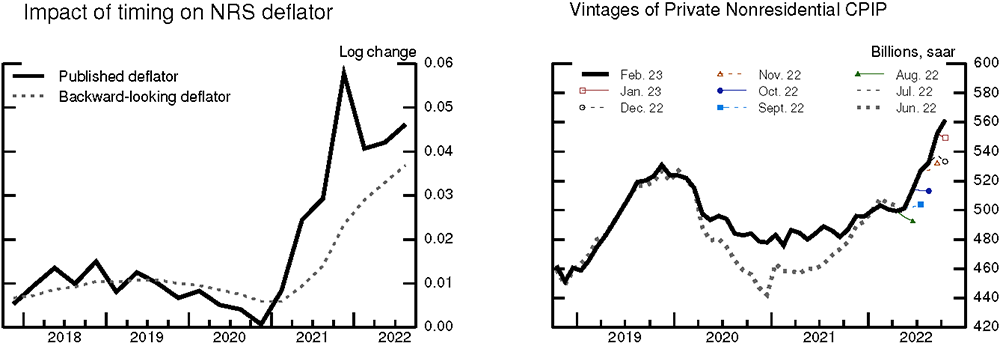
The Census considers a non-responding project as completed once imputed construction costs reach 101.5 percent of their original estimated cost. This imputation cap might lead to underestimates of spending if many imputed projects are experiencing cost overruns larger than in recent history. The prices of inputs used in construction increased rapidly in the last few years, as measured by the BEA's NRS deflator; see Figure 4, left panel.9 The NRS deflator is estimated to have risen about 33 percent from 2019Q4 to 2022Q4, well above the 13 percent increase registered from 2016Q4 to 2019Q4. In an annual survey of contractors, 84 percent mentioned that costs had been higher than expected in 2022, vs 33 percent in 2019.10 Therefore, it is possible the cap on cost overruns for non-responding projects, interacted with a strong increase in prices of inputs used in construction, could lead to underestimates of nominal spending.
Left Figure:
Note: Backward-looking deflator is a weighted average of the NRS deflator using 2021 time-to-build weights. Source: BEA, Census, and authors’ calculations.
Right Figure:
Source: Census.
Since we do not know how binding the imputation cap is, either now or before the pandemic, we cannot quantify the magnitude of this potential source of bias. That said, recent revisions in the Census' estimate of the nominal value of private nonresidential construction, which can be driven by a decline in the share of imputations, have been consistently positive. If the imputation cap is binding more strongly than before the pandemic, we might expect that over time, as more projects respond and the share of imputations declines, the level of nominal spending would revise up.
The right panel of Figure 4 shows Census' estimates of private nonresidential construction spending at different points in time. Over the past year, revisions have tended to be strongly positive, especially during the annual revision with the May 2022 report (released in July 2022). This annual revision included a 7.1, 4.7, and 5.2 percent upward revision to the level of construction spending in the 2020Q4, 2021Q1 and 2021Q2, respectively. More recently, the releases in January and February 2023 have revised up the October level by about 5 percent. These are large revisions, and we find the recent upward pattern across monthly releases striking. That said, we note Census' estimates of construction spending often revise significantly and generally seem to have a slight positive slant.11
We also consider whether issues with the timing of actual cost increases and the price indexes the BEA uses to deflate nominal spending could explain some of the excess weakness in real NRS spending.12 The BEA uses various price indexes to deflate different categories of nominal NRS spending, primarily new construction PPIs published by the BLS, which together are used to deflate about two thirds of nonresidential private spending. To measure changes in output costs for these PPIs, the BLS estimates changes in contractor markups and changes in prices of inputs (materials and labor) required to build constant-quality structures. Quarterly changes in input prices reflect current market prices and are based on analysis by a professional cost-estimating firm.13
We find it plausible that actual costs have risen less quickly than measured costs, due to the ability of builders to lock in prices in advance. That is, while construction in each quarter is deflated with the deflator that same quarter, at least some of the materials and other inputs were likely acquired in previous quarters or at prices negotiated in previous quarters. For instance, in a 2022 survey of contractors, 23 percent reported they had stockpiled items before winning contracts and 67 percent had accelerated purchases after winning contracts, in response to supply-chain issues.14
To quantify this potential source of bias, we assume that all costs are locked in at the start of the project and construct a backward-looking weighted average of the NRS deflator using time-to-build weights from the 2020-2021 Survey of Construction Length of Time Statistics (red line, left panel of Figure 4).15 Adjusting nominal NRS spending by this alternative backward-looking deflator, we find that real NRS spending in 2022Q3 was about 17 percent lower than in 2019Q4, compared to the 23 percent decline in the published statistics. We would expect this measurement issue on the real level of spending to be transitory. That is, going forward, once input price pressures subside, deflator growth would moderate more quickly than actual cost increases, since the latter are more backward-looking.
Conclusion
We have shown evidence that the reported estimates of nonresidential investment in 2021 and 2022 have been understated. Indeed, models based on sector-specific indicators suggest real nonresidential investment could be about 20 percent higher in the third quarter of 2022 than in the published statistics. The measurement issues likely have arisen due to the unprecedented increase in construction costs during the pandemic. Nominal spending is heavily imputed, and the imputation methodology does not allow for significant cost overruns. Also, the price indexes used to deflate nominal spending may have risen faster than some actual costs, given the ability of builders to lock in prices in advance. Over time, we would expect these measurement issues to abate, as the share of imputations declines and cost pressures ease.
References
Baker, K., & Saltes, D. (2005). Architecture billings as a leading indicator of construction. Business Economics, 40, 67-73.
Green, R. K. (1997). Follow the Leader: How Changes in Residential and Non‐residential Investment Predict Changes in GDP. Real Estate Economics, 25, 253-270.
Millar, J. N., Oliner, S. D., & Sichel, D. E. (2016). Time-to-plan lags for commercial construction projects. Regional Science and Urban Economics, 59, 75-89.
1. The authors thank Bonnie Kegan for sharing her expertise on the Census Bureau's methodology for calculating nominal output in the construction industry. The analysis and conclusions set forth are those of the authors and do not indicate concurrence by other members of the research staff or the Board of Governors. Return to text
2. Also, spending on warehouses and manufacturing structures may have been boosted by changes related to the pandemic. Return to text
3. The ABI is calculated as the percentage of firms reporting a significant increase plus half the percentage of firms reporting no change. A level of 50 is consistent with an equal share of firms reporting increases as decreases. For more information, see https://content.aia.org/sites/default/files/2016-04/Designing-Construction-Future_3-14.pdf Return to text
4. We have experimented with various specifications such as estimating models of nominal output or including lags of the ABI and find similar patterns. Return to text
5. For more information, see the BEA National and Income Product Accounts handbook chapter 6: https://www.bea.gov/resources/methodologies/nipa-handbook Return to text
6. The Census also makes an adjustment for projects not covered by Dodge. See for more details: https://www.census.gov/construction/c30/methodology.html Return to text
7. The Census mentions "A major source of nonsampling error in the published estimates is due to the need to impute data for nonrespondents and for late and inconsistent reports. For the final value-in-place estimates, the 2021 average imputation rate for private nonresidential construction was 69 percent and the average unit response rate for 2021 was 24 percent." See more information here: https://www.census.gov/construction/c30/pdf/reliability.pdf
Return to text
8. Census estimates the cost of the imputed project based on the initial reported project cost and the relationship over the previous five years between initial and final costs in the surveyed sample. Return to text
9. We define the BEA NRS deflator as the ratio of nominal NRS spending to real NRS spending as published by the BEA. Equivalently, this NRS deflator is the weighted average of the different price indexes used to deflate nominal output in each of the nonresidential subsectors, with the weights given by each subsector's share of NRS output. Return to text
10. See https://www.agc.org/news/2022/01/12/construction-firms-foresee-growing-demand-most-types-projects-74-percent-firms-plan-hire-2022 Return to text
11. Based on data from 2006 to 2020, we find that the interquartile range of revisions 3-months ahead (potentially including annual revisions) is from -3 to 4 percent. The interquartile range for revisions 1-year ahead is from -6 to 5 percent, while for 3-years ahead is from -9 to 10 percent. In each case, the median and average revision is slightly positive, about 1-2 percent. The authors thank Felix Galbis-Reig for the analysis of CPIP revisions. Return to text
12. It's also possible that shifts in time-to-build might partly explain lower nominal NRS spending, though the impact would have to be well outside the historical range of variation to be significant. Return to text
13. For more information, see https://www.bls.gov/ppi/factsheets/producer-price-index-nonresidential-building-construction-initiative.htm Return to text
14. See question 7 here: https://www.agc.org/sites/default/files/users/user21902/2022_Outlook_National_0.pdf Return to text
15. The survey reports the distribution of the value put in place each month from start to completion for private nonresidential construction projects by value. For instance, the survey reports that only 26 percent of total value is allocated within the first 3 months of the project and 72 percent within the first year. Return to text
Brandsaas, Eirik, Daniel Garcia, Joseph Nichols, and Kyra Sadovi (2023). "Nonresidential construction spending is likely not as weak as it seems," FEDS Notes. Washington: Board of Governors of the Federal Reserve System, March 11, 2023, https://doi.org/10.17016/2380-7172.3283.
Disclaimer: FEDS Notes are articles in which Board staff offer their own views and present analysis on a range of topics in economics and finance. These articles are shorter and less technically oriented than FEDS Working Papers and IFDP papers.