FEDS Notes
October 04, 2017
Own-Account IT Equipment Investment
David M. Byrne, Carol A. Corrado1, and Daniel E. Sichel2 3
This note considers a puzzle: why has information technology (IT) equipment investment in the National income and Product Accounts (NIPAs) been so weak since 2007 at the same time that financial reports indicate massive increases in capital expenditures by IT service companies? While many factors could explain this discrepancy, we consider the increasing prevalence of businesses purchasing components and building their own IT equipment—so-called own-account investment. We believe that this equipment is not fully captured in the NIPA measure of investment, and we provide a rough calculation to demonstrate that IT equipment investment could be noticeably higher than reflected in official measures.4
First, some relevant background on U.S. national income accounting. Gross domestic product (GDP), the featured indicator of the production of goods and services, includes both market production and some non-market production.5 An example of non-market production included in GDP is the value of software produced within establishments for internal use, known as own-account software investment. The inclusion of non-market production captures important economic activity and mitigates distortions introduced to GDP when households or firms shift between obtaining goods and services in the market and producing for themselves. For example, if own-account software were not measured, GDP would decrease if establishments shifted from purchasing software to producing own-account software.
Similar distortions could be important for IT equipment given reports that large firms such as Google and AT&T sometimes design and build their own computing and communications systems. That is, they undertake own-account investment in IT equipment.6 To highlight the potential importance of own-account IT equipment investment, we construct an augmented investment measure using information from BEA input-output tables.
Capital expenditure has soared in the information sector
Capital expenditure by IT service companies—as shown in financial reports—has surged since 2010 (figure 1). This rise coincides with the ongoing battle over the market for "cloud" services, which provide to firms a network of off-site IT resources accessed through the Internet.7 The increase in capital expenditure by leading cloud companies (the cross-hatched region) is comparable to the frenzied late-1990s increase in capital expenditures by top telecommunications service providers (the gray region). At roughly $100 billion in 2016, capital expenditures by major U.S. IT service companies now substantially exceeds their spending at the height of the IT boom.8
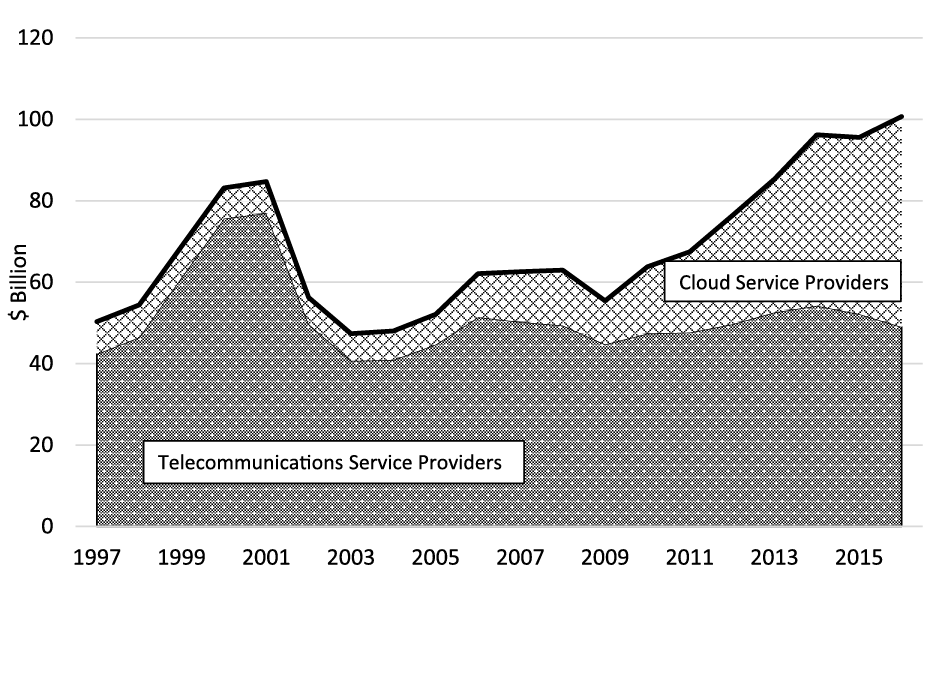
Source. Authors' tabulation of company financial filings available at http://www.sec.gov/edgar. Note. Included cloud service providers meet Cisco definition of hyperscale. Included telecommunications service providers are AT&T, Verizon, Sprint, T-Mobile US, Century Link and related companies. See endnote 8 for detail.
But IT investment has been tepid in the NIPAs
IT equipment investment in the NIPAs spiked in the late 1990s, capturing the surge in IT service company capital expenditures. In contrast, NIPA investment has not tracked the more recent increase in capital expenditure reported in company financial filings (Figure 2). (Note that both series are presented relative to GDP for scale, but not all capital expenditure by U.S. companies counts as GDP because only a portion occurs within the United States.)
Figure 2. Capital Expenditure, Selected U.S. IT Service Providers and NIPA Nominal IT Equipment Investment
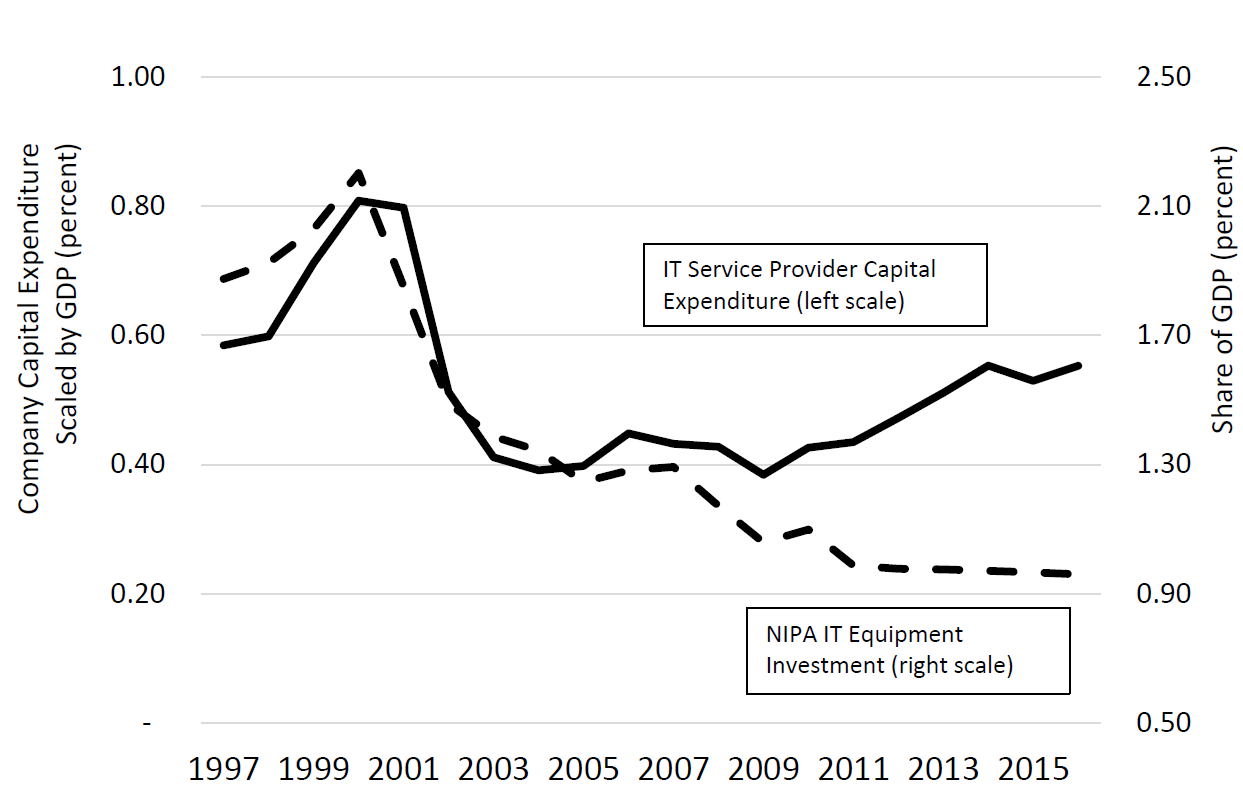
Source. Bureau of Economic Analysis Fixed Asset Tables, availble at https://bea.gov/iTable/index_FA.cfm. Authors' tabulation of company financial reports available at http://www.sec.gov/edgar. Note. IT equipment investment includes communications equipment, computers and peripherals. Included cloud service providers meet Cisco definition of hyperscale. Telecommunications service providers include AT&T, Verizon, Sprint, T-Mobile US, Century Link and related companies. See endnote 8 for detail.
Although the stark difference in the recent contour of these series is surprising, NIPA IT investment need not move in tandem with capital expenditures by IT service firms; several factors could account for differences between the two series:
- Capital expenditure includes non-IT equipment, structures, and other capitalized spending. For example, IT service firms invest in generators, transmission towers, and rights to portions of the wireless spectrum.9
- The financial filings of IT service firms report global capital expenditures. A shift in the share of foreign investment may lead the two series to diverge.
- NIPA IT investment weakness could arise as firms in other sectors purchase IT services from cloud providers rather than equipping their own data centers. Investment in non-cloud data centers has in fact declined since 2015 according to Synergy Research Group, a high-tech consultancy.10 Overall nominal private IT equipment investment outside of the IT services industries rose 2.9 percent per year, on average, from 2009 to 2015.11
Own-account equipment investment may help explain the divergence
While all of these factors could have played a role, we focus on a shift toward own-account equipment investment that may have contributed to the divergence between the series in figure 2. We infer this shift from a simple observation: an increasing quantity of electronic components go into the IT service sector but final electronics do not come out. The input-output (I-O) tables published by Bureau of Economic Analysis (BEA) indicate that the IT service sector used nearly $60 billion of electronic components as intermediate inputs in 2015 and produced no final electronics for sale.12 We therefore conjecture that these electronic components are used to build own-account equipment. Intermediate use of electronics in the IT service sector rose 9 percent per year on average—roughly doubling—from 2007 to 2015 (figure 3).13 In contrast, investment in IT equipment was roughly unchanged between 2007 and 2015.
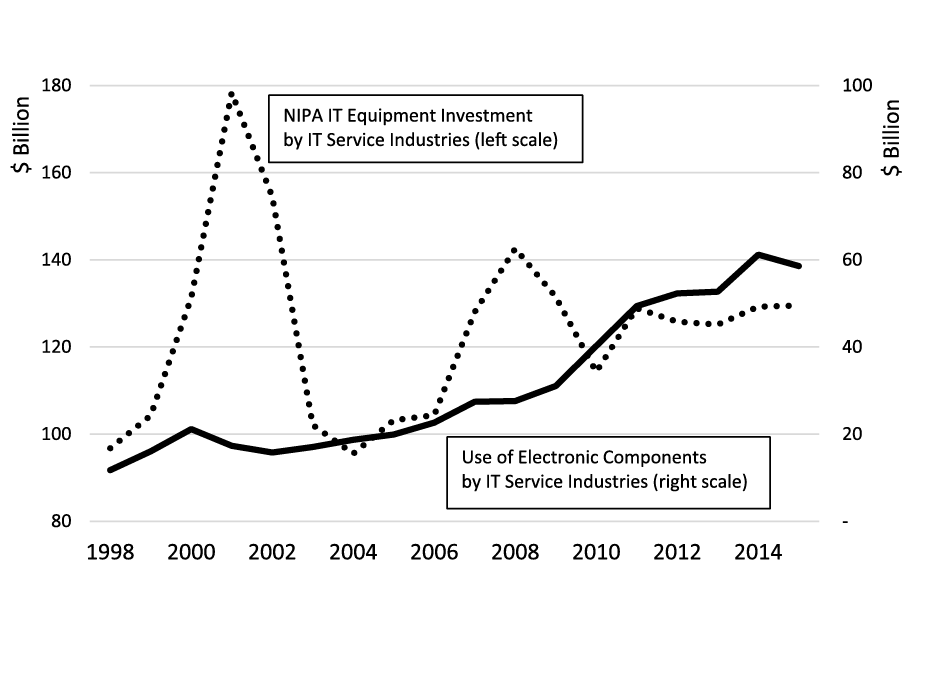
Source. Bureau of Economic Analysis Fixed Asset Tables available at https://bea.gov/iTable/index_FA.cfm and Input-Output (IO) Accounts available at http://bea.gov/industry. Note. IT service industries include BEA input-output industry groups 511 (Publishing industries, except internet (includes software)), 513 (Broadcasting and telecommunications), 514 (data processing, internet publishing, and other information services), and 5415 (computer systems design and related services).
How different would GDP be if own-account investment were included?
To assess the potential importance of own-account investment, we undertake a back-of-the-envelope calculation. In particular, we hypothesize that the value of the non-market production of equipment is equal to the amount of expenditure on the purchased components.14 For example, according to the BEA I-O tables, in 2015, the IT service sector used $58 billion in output from the Computer and Electronic Product manufacturing subsector (NAICS 334) as intermediate inputs (figure 3).
Folding this estimate into IT equipment investment changes the picture considerably. While the official series of nominal private IT equipment investment fell $13 billion from 2007 to 2015, the augmented measure rose $18 billion, a difference of 1.9 percentage points of growth (average annual rate) in this period.15 Accounting for own-account IT investment in the IT services sector would raise the 2015 level of overall GDP 0.3 percent and add 0.1 percentage point to the growth rate of GDP from 2007 to 2015.
Although these augmented investment estimates should be viewed cautiously, the key takeaway from this analysis is that IT equipment investment appears to have responded substantially more to recent advances in computing and communications technology than official measures indicate (figure 4). The alternative series indicates that IT equipment investment is now well above its pre-recession peak and is in the neighborhood of investment recorded in the IT boom.16 To the extent that the recent rise in own-account investment in equipment has led official estimates to understate investment, other measures would be understated as well, including the capital stock, GDP, and the contribution of IT capital services to labor productivity growth. Careful estimation of own-account investment in equipment, especially IT equipment, would be a worthwhile refinement to the NIPAs.
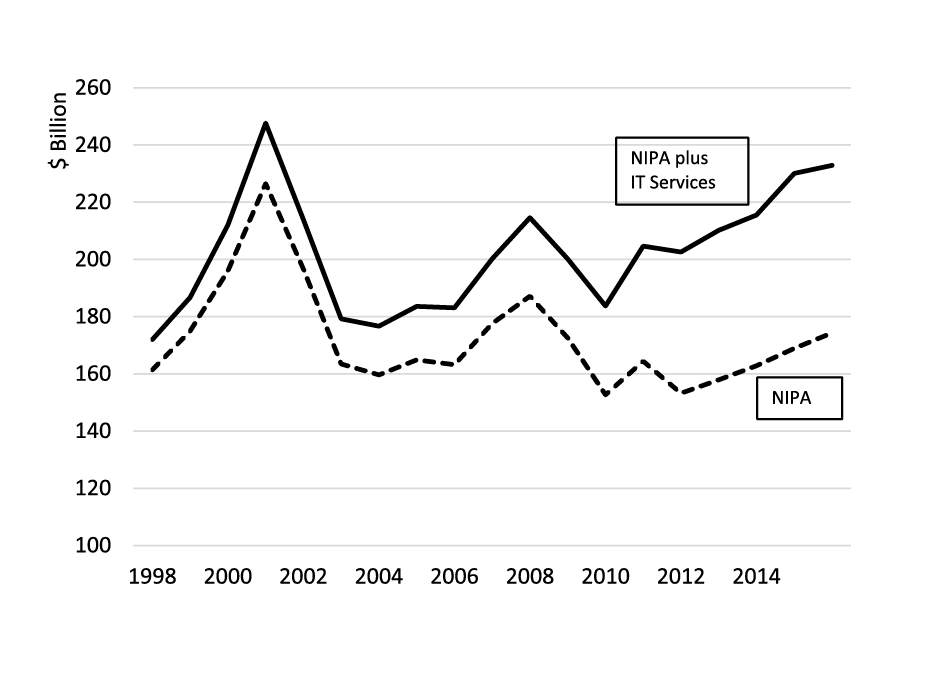
Source. Authors' elaboration of data from Bureau of Economic Analysis Fixed Asset Tables available at https://bea.gov/iTable/index_FA.cfm and Input-Output (IO) Accounts available at http://bea.gov/industry.
1. The Conference Board and Center for Business and Public Policy, McDonough School of Business, Georgetown University. Return to text
2. Department of Economics, Wellesley College and National Bureau of Economic Research. Sichel is grateful for financial support for price measurement research from the Bureau of Economic Analysis and the National Telecommunications & Information Administration. Return to text
3. The authors would like to thank Gilbert Cette, Marshall Reinsdorf, and Dave Wasshausen for helpful discussions on the topic of this note. Return to text
4. The analysis in this note is an excerpt from our paper, "The Rise of Cloud Computing: Minding Your P's, Q's, and K's" presented at "Measuring and Accounting for Innovation in the 21st Century", sponsored by the Conference on Research in Income and Wealth of the National Bureau of Economic Research, March 10-11, 2017, in Washington D.C. Return to text
5. "Measuring the Economy: A Primer on GDP and the National Income and Product Accounts," Bureau of Economic Analysis, December 2015. Available at https://bea.gov/national/pdf/nipa_primer.pdf. Return to text
6. Google and Facebook, for example, design electronics for their data centers, including servers, switches, and data storage equipment. (See "Facebook and Google Try Self Help," Wall Street Journal, August 25, 2013.) Industry contacts informed us that some major cloud providers commonly have those designs fabricated under contract by other companies, but add software essential to the operation of the device within the data center. Under this arrangement, the output of the contract manufacturer would be recorded as electronic components (e.g. circuit boards), rather than final electronics and would be recorded as intermediate inputs in the Bureau of Economic Analysis input-output tables, rather than investment. Return to text
7. A more precise definition of the cloud is provided by the National Institute of Standards and Technology: "Cloud computing is a model for enabling ubiquitous, convenient, on-demand network access to a shared pool of configurable computing resources that can be rapidly provisioned and released with minimal management effort or service provider interaction." (Mell and Grance, 2011) For discussion of the competition for the cloud services market, see "Tech's High-Stakes Arms Race: Costly Data Centers," Jay Green, Wall Street Journal, April 7, 2017. Return to text
8. Cloud service companies in the figures include U.S.-headquartered companies meeting Cisco Systems Inc.'s "hyperscale" definition: "To be a hyperscale cloud operator, a company must meet [one of] the following criteria defined in terms of annual revenues: More than US $1 billion in annual revenue from infrastructure as a service (IaaS), platform as a service (PaaS), or infrastructure hosting services (for example, Amazon/AWS, Rackspace, Google); more than US $2 billion in annual revenue from software as a service (SaaS) (for example, Salesforce, ADP, Google); more than US $4 billion in annual revenue from Internet, search, and social networking (for example, Facebook, Yahoo, Apple); or more than US $8 billion in annual revenue from e-commerce/payment processing (for example, Amazon, Alibaba, eBay)." (Cisco Global Cloud Index: Forecast and Methodology, 2015-2020 (2016 White Paper) available at https://www.cisco.com/c/dam/en/us/solutions/collateral/service-provider/global-cloud-index-gci/white-paper-c11-738085.pdf) These hyperscale companies include Adobe Systems Inc., Amazon.com Inc., Amazon Web Services, Apple Inc., Automatic Data Processing Inc., eBay Inc., Facebook Inc., Google Inc., International Business Machines Corp., Intuit Inc., LinkedIn Corp., Microsoft Corp., Oracle Corp., Rackspace Hosting Inc., Salesforce.Com Inc., Twitter Inc., Yahoo! Inc. (Post in Cisco Communities website by Shruti Jain, Cisco senior analyst (user shjain), November 30, 2016. Available at https://communities.cisco.com/thread/74190.) Telecom service providers are AT&T, Verizon, Sprint, T-Mobile US, Century Link, and predecessor companies. Return to text
9. For example, Google's capital expenditure spiked in 2010 when the company purchased a building with 3 million square feet of office space in Manhattan. ("Google buys giant New York building for $1.9 billion", Wired Magazine, December 22, 2010.) Return to text
10. See "Data Center Infrastructure Market is Low Growth, but Public Cloud Blossoms," Synergy Research Group, September 18, 2017. Available at https://www.srgresearch.com/articles/data-center-infrastructure-market-low-growth-public-cloud-blossoms. Return to text
11. Another possibility is that the intermediate inputs of electronics are used for investment in structures, such as radio transmission towers. (This possibility was suggested by Marshall Reinsdorf.) NIPA estimates of non-residential structures investment are largely based on the Census Bureau's Value of Construction Put in Place Survey (VIP). The VIP includes the cost of materials in the estimates of the value of construction. The type of construction shown in the VIP that would appear to be most likely to clearly reflect any use of electronic intermediates is communications structures. Investment in non-residential communications structures hovered close to $17 billion from 2010 to 2014, then rose by $4 billion in 2015. This increase in structures investment could account for at most a small share of the increase in intermediate electronics use from 2010 to 2015. Further, we conjecture that the portions of the communications infrastructure for which electronics accounted for a significant share of intermediate inputs would not be recorded as non-residential structures investment; the VIP survey indicates that "cost and installation of production machinery" is excluded from the measure of construction. Return to text
12. We define the IT service sector to be the following BEA industry groups in their annual input-output tables: publishing industries, except internet (includes software) (511), broadcasting and telecommunications (513), data processing, internet publishing, and other information services (514), and computer systems and design services (5415). Return to text
13. Interestingly, purchases of electronic components in telecommunications services rises faster than it does in cloud services, the opposite of the relative pattern of increases in capital expenditures recorded in figure 1. Recall that the classification system used by BEA (NAICS, the North American Industry Classification System) defines industries as sets of establishments which share a common primary activity. Establishments of cloud services companies can be difficult to distinguish from modern telecommunications switching centers. For example, Google's New York City headquarters is a major "carrier hotel" where telecommunications companies bridge their fiber networks. Also, some cloud services firms have begun building submarine cables and other portions of the long-haul communications network. Accordingly, we suspect that the purchases of electronic components by telecommunications and cloud service industries largely reflect the same underlying phenomena. See "Will the Submarine Cable Boom Drive More Revenue to Colos?" Data Center Knowledge, February 16, 2017. (http://www.datacenterknowledge.com/archives/2017/02/16/will-new-submarine-cables-boost-data-center-provider-revenue/ ) Accessed August 17, 2017. Return to text
14. Our estimate may understate own-account investment to the extent that associated value-added from software and equipment assembly and installation is omitted. However, the NIPAs contain imputed values for own-account software investment, as well as for some design and assembly and installation services. Return to text
15. Casting a wider net and imputing IT equipment investment throughout the private economy by counting all intermediate use of electronics outside of manufacturing would raise the 2015 level of investment an additional $40 billion but would yield a broadly similar contour for investment. Return to text
16. Note that the increment to investment in these nominal calculations is additive to any mis-statement caused by bias in price indexes. Return to text
Byrne, David, Carol A. Corrado, and Daniel E. Sichel (2017). "Own-Account IT Equipment Investment," FEDS Notes. Washington: Board of Governors of the Federal Reserve System, October 4, 2017, https://doi.org/10.17016/2380-7172.2071.
Disclaimer: FEDS Notes are articles in which Board staff offer their own views and present analysis on a range of topics in economics and finance. These articles are shorter and less technically oriented than FEDS Working Papers and IFDP papers.