FEDS Notes
May 20, 2026
Population Growth and Labor Market Fragility: Lessons from Domestic and International Experiences
François de Soyres, Johannes Fleck, William Peterman, Avani Pradhan, and David Ratner1
Labor market indicators such as employment growth and the unemployment rate are commonly used to assess the cyclical position of the economy (NBER Business Cycle Dating Committee). However, deciphering trend from cycle in these indicators is notoriously difficult and can be especially delicate when underlying trends in the economy shift rapidly.2 For example, employment growth, in particular, is intimately linked to trend labor force growth. Shifts in trend labor force growth typically happen only gradually and so rapid changes in employment growth usually provide a reliable cyclical signal.
However, recent work by Murray and Vidangos (2026) documents a pronounced slowdown in trend labor force growth which has pushed down the "breakeven" pace of employment growth—the monthly employment increase consistent with a stable unemployment rate—close to zero.3 Thus, even in such an economy that is growing at potential, monthly employment gains will often be negative, which, in historical contexts, would have been widely seen as a sure sign of an economic downturn.
This raises the question of whether slow population growth—accompanied by near-zero employment growth—could render the labor market more cyclically fragile or susceptible to shocks. For example, more frequent episodes of outright employment declines, even if modest, could disproportionately weigh on household and firm sentiment, potentially triggering recessionary dynamics. Given limited precedents of such an environment in the aggregate U.S. economy, this note examines evidence from U.S. state-level experiences across both state and national recessions since 1980, as well as international historical episodes in other countries. Overall, the evidence suggests that labor markets are not systematically more sensitive to recessionary shocks when population and trend labor force growth are low. That said, our evidence does not conclude that the current labor market is on solid footing, rather just that the confluence of low population growth and near-zero employment growth is not by itself necessarily indicative of weakness.
1. State-level Recessionary Experiences
We turn first to examining differences in labor market outcomes across states with different population growth at the onset of recessions since 1980.4 In particular, prior to each of the national recessions from 1980 to 2007 (i.e. 1980, 1990, 2001, and 2007), we calculate the lagging three-year population growth rate. We then contrast the labor market experiences for states in the fastest and slowest quintiles of population growth.5
Figure 1 establishes two things necessary for the comparison to be relevant for the current U.S. experience. First, the left panel establishes that state-level population growth is indeed closely related to labor force (left set of bars) and employment growth (right set of bars).6 In particular, the left panel shows that, in the year before recessions, on average, the slowest-population-growth states (black bars) have very slow labor force growth and payroll employment growth compared to the fastest-growth states (red bars). The roughly 2 percentage point gap in employment growth between the two buckets of states is primarily accounted for by the same gap in population growth (not shown).
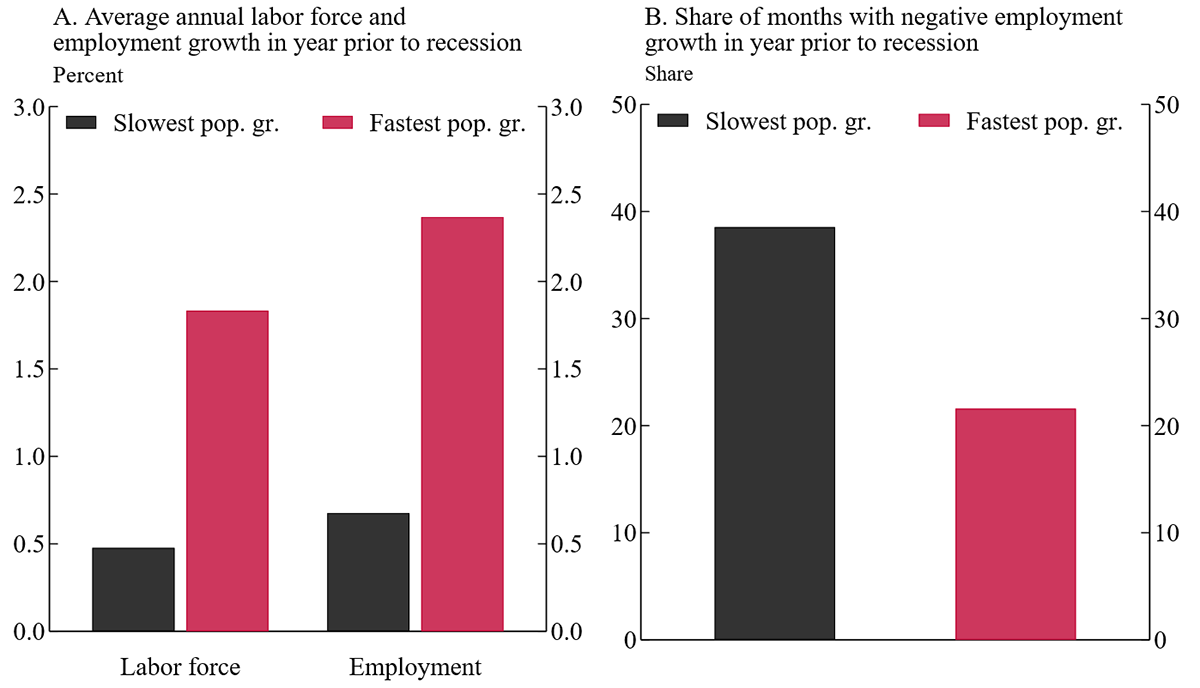
Note: Key identifies in order from left to right. Labor force from BLS’s Local Area Unemployment Statistics and employment from BLS’s Current Employment Statistics data.
Source: BLS data via Haver Analytics, Authors’ calculations.
The right panel shows that slow-growth states experienced declines in employment in about 40 percent of months, nearly twice the share experienced in the fastest growing states.7 Thus, states with the slowest population growth have two characteristics (relative to states with the fastest population growth) that may be expected for the U.S. labor market with slow population growth even with a stable unemployment rate: (i) relatively slow employment growth, and (ii) a higher share of months with negative employment growth.
Turning next to the question of how unemployment dynamics during a business cycle are affected by low labor force growth, Figure 2 plots each group's average unemployment rate change during recessions. Despite experiencing starkly different population, labor force, and employment outcomes, the unemployment rate dynamics are remarkably similar, both before and during the recession.8 Thus, it does not appear that states with slower labor force growth at the onset of recessions (black dashed line) experience different recessionary dynamics in the unemployment rate.
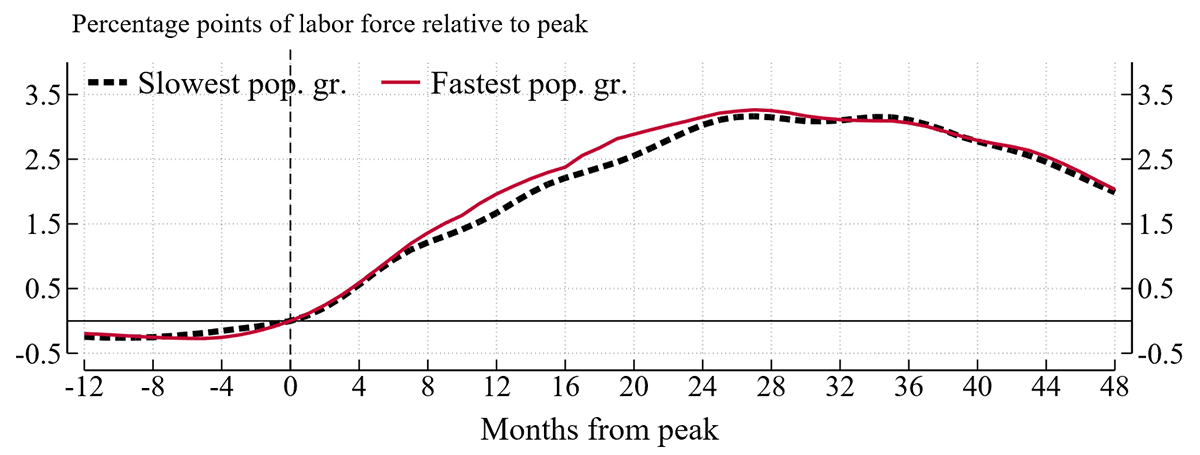
Note: Unemployment from BLS’s Local Area Unemployment Statistics.
Source: BLS data via Haver Analytics, Authors’ calculations.
Finally, we turn to the question of whether states with slow population growth are more likely to enter a state-level recession. We start by using the "Sahm rule"—a very accurate historical indicator of a recession at the aggregate level—to define state-level recessions. The Sahm rule is triggered when the three-month moving average of the U.S. unemployment rate rises by 1/2 percentage point or more relative to its low in the previous twelve months. We apply this rule to states to identify state-level recessions. Figure 3 shows that the share of states triggering the Sahm rule is highly correlated with times that the aggregate Sahm rule is triggered (grey shaded regions).
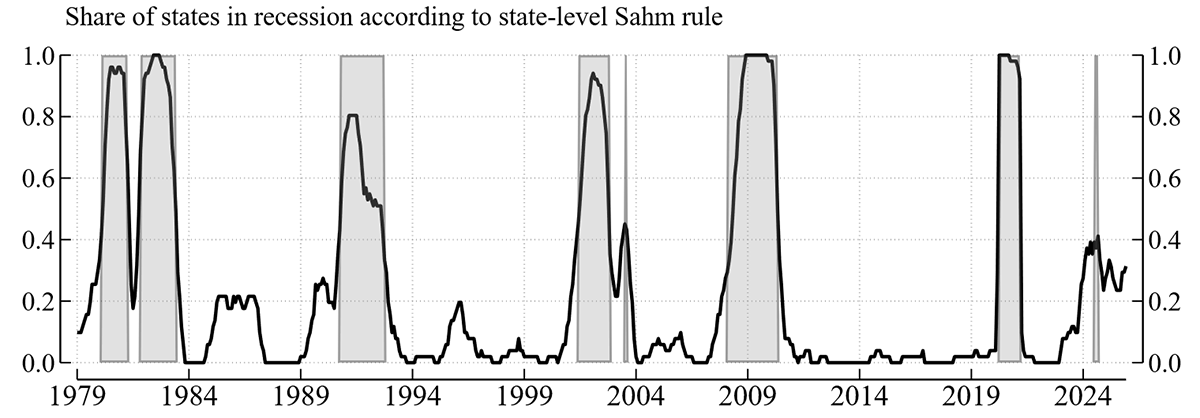
Note: Shaded areas denote months when aggregate Sahm rule was triggered. Aggregate Sahm rule calculated by HAVER and state-level Sahm share calculated from BLS’s Local Area Unemployment Statistics and Current Population Survey. State-level Sahm rule shares are unweighted.
Source: BLS data via Haver Analytics, Authors’ calculations.
Next, Figure 4 plots the share of months that each state is in a recession (according to the Sahm rule) and the state's average population growth from 1979 to 2019. There is no clear evidence that states with slower average population growth are more likely to experience a state-level recession.9 However, one caveat is that a rigorous analysis of this question is difficult due to the relative rarity of labor market downturns in isolated states outside of national recessions, which are generally experienced by all states to some extent (apparent from Figure 3). Nevertheless, those few state-level downturns that occurred outside of national recessions do not appear systematically more likely to have occurred in states with slower population growth.
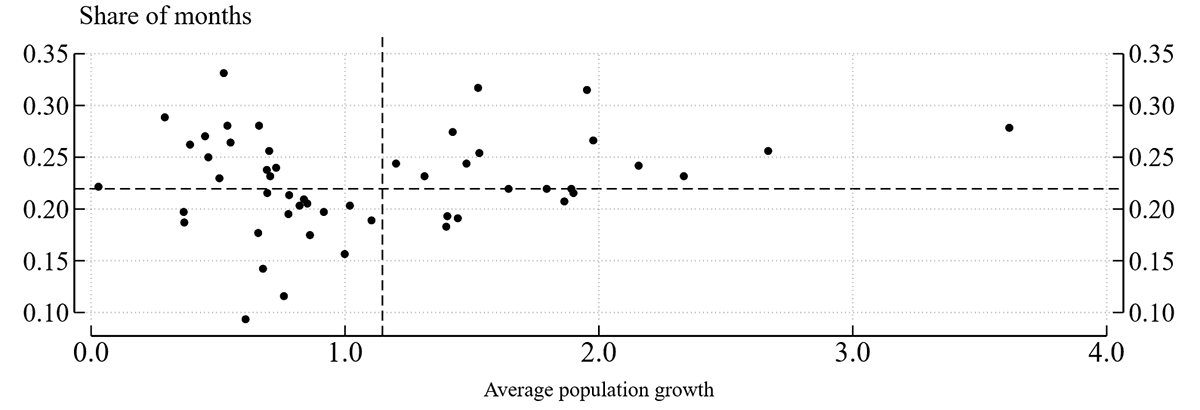
Note: Sample includes 1979 through 2019. Dashed lines represent aggregate population growth (vertical) and aggregate share of months that Sahm rule is triggered (horizontal).
Source: BLS data via Haver Analytics, Authors’ calculations.
2. Lessons from International Experience
Next, in order to provide a broader set of comparisons, we turn to evidence from other countries, where episodes of low population growth are more common. We examine this question using three complementary approaches: cross-country comparisons of unemployment volatility and macroeconomic outcomes, a panel analysis of recession episodes within countries, and within-country comparisons of episodes with low population growth relative to other periods. Across these approaches, there is little evidence that lower population growth is associated with greater cyclical fragility as characterized by our metrics. If anything, some specifications suggest that low population growth episodes are associated with smaller increases in unemployment during downturns and modestly lower unemployment volatility.
Cross-Country Comparisons
Looking across OECD countries over the past two decades, there is no meaningful relationship between population growth and key labor market outcomes.10 Countries with lower population growth do not exhibit higher unemployment volatility (left panel, figure 5). At most, there is a very weak association with a slightly higher frequency of quarters with negative GDP growth, though the relationship is not statistically significant (right panel, figure 5). In any case, unconditional cross-country comparisons are difficult to interpret due to differences in labor market institutions, policy regimes, and broader macroeconomic characteristics across countries.
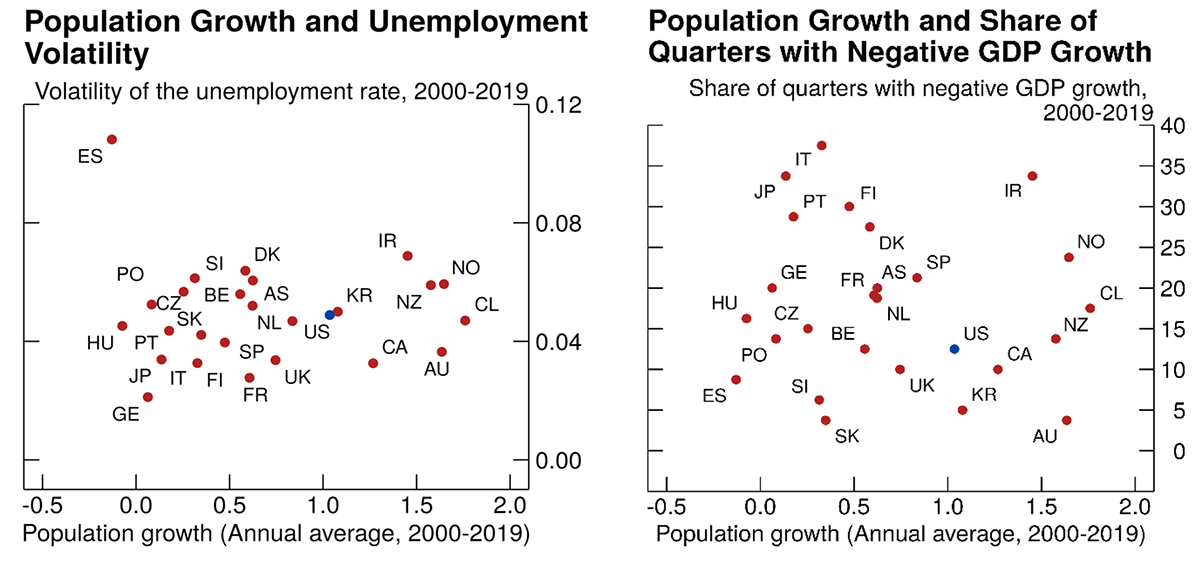
Note: Population growth is the annualized population growth rate between 2000 and 2019, in percent. Data for France and Germany are from 2003 and 2005, respectively. Volatility of the unemployment rate is the standard deviation of log differences. Share of quarters with negative GDP growth is the ratio of the number of quarters with quarter-on-quarter GDP contraction to the total number of quarters for each country. AS is Austria, ES is Estonia, GE is Germany, SP is Spain, IC is Iceland, UK is the United Kingdom, and labels for other countries use the alpha-2 standard country codes.
Source: OECD via Haver Analytics; Authors' calculations.
Evidence from Recessions (Panel Analysis)
In a more structured approach, we focus on recession episodes in a panel regression setting, relating the change in the unemployment rate during downturns to pre-recession population growth, while controlling for recession characteristics such as duration and severity as well as country fixed effects. This approach helps to isolate the effect of population growth on labor market outcomes from other, country-specific characteristics such as labor market regulations and policy interventions during recessions. As seen in Table 1, lower population growth prior to a recession is associated with smaller, not larger, increases in unemployment. This result holds across a large sample of OECD member economies over several decades and is robust to controlling for additional labor market characteristics such as the OECD's Employment Protection Legislation measure, as well as controlling for the unemployment rate at the onset of the recession.11
Table 1: Panel Estimation across OECD Recessions
Dependent variable: change in unemployment during a recession
| (1) | (2) | (3) | (4) | (5) | |
|---|---|---|---|---|---|
| Population Growth | 0.39 | 0.41* | 0.59** | 0.74** | 0.96*** |
| (0.23) | (0.23) | (0.24) | (0.20) | (0.32) | |
| Duration | 0.08 | 0.06 | 0.04 | 0.04 | |
| (0.11) | (0.12) | (0.11) | (0.11) | ||
| Severity | 0.08 | 0.04 | 0.06 | ||
| (0.11) | (0.10) | (0.09) | |||
| Employment Protection Legislation | 2.35 | 2.40 | |||
| (1.95) | (1.82) | ||||
| Unemployment Rate at Onset of Recession | 0.24 | ||||
| (0.22) | |||||
| Observations | 118 | 118 | 107 | 93 | 93 |
| R-squared | 0.35 | 0.36 | 0.42 | 0.52 | 0.53 |
| Country Fixed Effects | YES | YES | YES | YES | YES |
Note: Standard errors are clustered at the country level and in parentheses. Country-specific recessions' dates are taken from OECD's recession indicators. The unemployment rate increase is defined as the difference between a country's minimum unemployment rate in an event window up to 3 years before a recession's start and its maximum unemployment rate up to 2 years after the recession ends. Population growth is the 3-year growth rate prior to the start of the recession. Duration is the number of quarters a recession lasted. Severity is the largest drop of GDP during the recession relative to the quarter before the recession started (in percent). Employment Protection Legislation is an OECD indicator measuring regulations on the dismissal and hiring of regular workers. Unemployment Rate at the Onset of Recession is the level of the unemployment rate in the quarter in which the recession began *** p < 0.01, ** p < 0.05, * p < 0.1.
Source: OECD via Haver Analytics; Authors' calculations.
Of note, this analysis is reduced-form and should not be interpreted as causal. Our interpretation of this exercise is that we do not find evidence supporting the view that lower population growth is associated with larger increases in the unemployment rate during recessions. That said, additional analysis on how population growth may influence economic dynamics over the business cycle, as well as its relationship with medium-term growth and other macroeconomic variables, could provide further valuable insights.
Within-Country Evidence
While the panel regression approach above exploits variation across recession episodes in many countries, it is also informative to examine whether similar patterns arise within countries over time. To that end, we now compare labor market outcomes across periods of relatively low versus high population growth within each country.
Specifically, for each country in the sample, we divide the historical data into overlapping three-year periods and classify each period as either "low population growth" or "non-low population growth." A period is labeled as low population growth if cumulative population growth over the full three-year window is less than 0.1 percent – effectively capturing episodes of near-zero population change. This procedure partitions each country's experience into two groups that can be compared directly, abstracting from cross-country institutional differences.12
Figure 6 reports the results of this exercise. Consistent with the earlier evidence, periods of low population growth are not associated with higher unemployment rates (left panel). Turning to volatility (right panel), the figure shows that in 9 out of 14 countries, unemployment rate volatility is lower during low population growth periods than during other periods (i.e., observations fall below the 45-degree line). This pattern suggests that slower population growth may, if anything, be associated in some cases with slightly more stable unemployment dynamics.
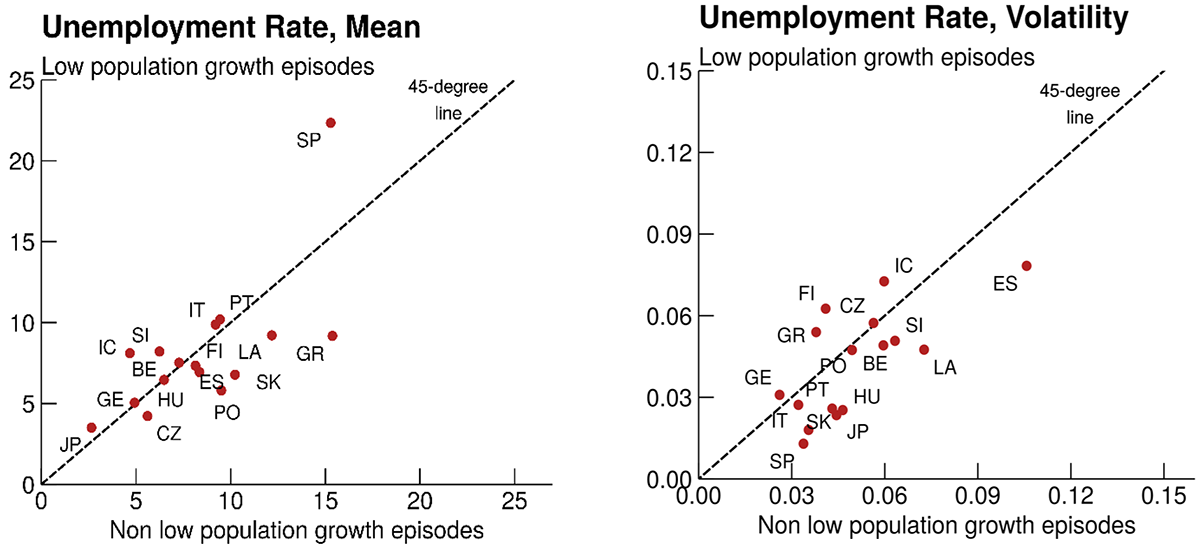
Note: "Low population growth episodes" are periods in which 3-year population growth was below 0.1 percent, in absolute terms. "Non-Low population growth episodes" are periods in which 3-year population growth was equal or above 0.1 percent. Volatility of the unemployment rate is the standard deviation of log differences. The dotted line denotes the 45-degree line. AS is Austria, ES is Estonia, GE is Germany, SP is Spain, IC is Iceland, UK is the United Kingdom, and labels for other countries use the alpha-2 standard country codes.
Source: OECD via Haver Analytics; Authors' calculations.
That said, this evidence should be interpreted with caution. The differences in volatility are generally modest, and the relationship is not uniform across countries. Moreover, some periods may coincide with recessions or other exogenous shocks that independently influence unemployment volatility.13
Overall, the within-country evidence aligns with the broader findings of the note: there is little indication that low population growth is systematically associated with greater labor market fragility.
3. Conclusion
In this note, we examined whether the slow trend labor force growth that the U.S. is experiencing could be by itself a sign of labor market fragility. Given that such weak trend labor force growth is unprecedented in recent aggregate U.S. history, we examined the evidence across U.S. states and foreign economies. Overall, the evidence suggests that labor markets are not systematically more sensitive to recessionary shocks when population and trend labor force growth are low. However, because the analysis is reduced form, the results should be interpreted as descriptive associations rather than causal effects. Importantly, this analysis does not conclude that the current labor market is on solid footing, rather just that low population growth and near-zero employment growth are not by themselves necessarily indicative of weakness.
An important caveat is that the source and speed of changes in population growth may matter. For example, the change in U.S. population growth has been driven importantly by immigration dynamics, which have limited parallels in other advanced economies and may evolve more rapidly than in past episodes experienced by other countries (Duzhak, 2024). In particular, the international historical evidence primarily reflects gradual trend declines associated with aging. As a result, the current situation in the U.S. may play out differently from the patterns across U.S. states and foreign countries documented here. More broadly, our note focuses on cyclical dynamics and does not address some crucial longer run implications of slower population growth, including effects on trend output and productivity growth, trend labor reallocation, savings-investment balances, and equilibrium interest rates.
References
Aaronson, S., Fallick, B., Nekarda, C., & Wascher, W. (2012). "Assessing Conditions in the Labor Market." Memorandum to the Federal Open Market Committee, Board of Governors of the Federal Reserve System, Division of Research and Statistics, November 30.
Abraham, K. G., Haltiwanger, J. C., & Rendell, L. E. (2020). "How Tight Is the US Labor Market?" Brookings Papers on Economic Activity, 2020(1), 97-165.
Brave, S., Crust, E., Eusepi, S., Hobijn, B., & Şahin, A. (2026). "Making Sense of Labor Market Indicators Amid Data Imperfections." Brookings Papers on Economic Activity.
Cajner, T., Coglianese, J., & Montes, J. (2025). "The Long-Lived Cyclicality of the Labor Force Participation Rate." Review of Economics and Statistics, 1-47.
Duzhak, E. A. (2024). "Recent Spike in Immigration and Easing Labor Markets." FRBSF Economic Letter, Federal Reserve Bank of San Francisco, 2024(19), 1-6.
Edelberg, W., Veuger, S., & Watson, T. (2026). "Macroeconomic Implications of Immigration Flows in 2025 and 2026: January 2026 Update." Research Note, Brookings Institution, January.
Fleischman, C. A., & Roberts, J. M. (2011). "From Many Series, One Cycle: Improved Estimates of the Business Cycle from a Multivariate Unobserved Components Model."
Foote, C. L., Fujita, S., Michaud, A. M., & Montes, J. (2025). "Assessing Maximum Employment." Federal Reserve Bank of Boston Research Department Working Papers No. 25-9
Murray, S., & Vidangos, I. (2026). "Labor Force Growth, Breakeven Employment, and Potential GDP Growth." FEDS Notes, Board of Governors of the Federal Reserve System, April.
Appendix
A.1 Robustness on the definition of OECD recessions
The analysis presented in Table 1 uses a country-specific OECD indicator to identify recessions dates. Table A1, instead, uses a more conventional definition to identify recessions – a minimum of two consecutive quarters of negative GDP growth. Results are little changed.
Table A1: Panel Estimation across GDP-based Recessions
Dependent variable: change in unemployment during a recession
| (1) | (2) | (3) | (4) | (5) | |
|---|---|---|---|---|---|
| Population Growth | 0.38*** | 0.42*** | 0.42*** | 0.64*** | 0.94*** |
| (0.13) | (0.13) | (0.14) | (0.11) | (0.26) | |
| Duration | 0.65*** | 0.65*** | 0.52*** | 0.45*** | |
| (0.10) | (0.11) | (0.12) | (0.13) | ||
| Severity | 0.00 | -0.02 | 0.01 | ||
| (0.08) | (0.05) | (0.04) | |||
| Employment Protection Legislation | -3.68 | -1.61 | |||
| (2.83) | (2.65) | ||||
| Unemployment Rate at Onset of Recession | 0.46*** | ||||
| (0.11) | |||||
| Observations | 126 | 126 | 126 | 80 | 80 |
| R-squared | 0.52 | 0.59 | 0.59 | 0.83 | 0.87 |
| Country Fixed Effects | YES | YES | YES | YES | YES |
Note: Standard errors are clustered at the country level and in parentheses. Country-specific recessions' dates are manually constructed from a minimum of two consecutive quarters of negative real GDP growth. The unemployment rate increase is defined as the difference between a country's minimum unemployment rate in an event window up to 3 years before a recession's start and its maximum unemployment rate up to 2 years after the recession ends. Population growth is the 3-year growth rate prior to the start of the recession. Duration is the number of quarters a recession lasted. Severity is the lowest drop of GDP during the recession relative to the quarter before the recession started (in percent). In this table, the Employment Protection Legislation is the OECD indicator measuring regulations on the dismissal and hiring of workers on temporary contracts. Unemployment Rate at the Onset of Recession is the level of the unemployment rate in the quarter in which the recession began *** p < 0.01, ** p < 0.05, * p < 0.1.
Source: OECD via Haver Analytics; Authors' calculations.
A.2 Robustness on the Employment Legislation Protection metric
In the main text, Table 1 reports the results of the baseline panel regression specification. In columns (4) and (5), we control for a time-varying measure of labor market rigidity from the OECD—specifically, the Employment Protection Legislation (EPL) index. In these specifications, the EPL measure captures protection of regular workers against dismissal. Here, we instead use the EPL indicator for the protection of temporary workers. As shown in Table A2, the results remain little changed: lower population growth continues to be associated with a smaller increase in the unemployment rate during downturns.
Table A2: Panel Estimation across OECD Recessions with Alternative Employment Protection Legislation Measure
Dependent variable: change in unemployment during a recession
| (1) | (2) | |
|---|---|---|
| Population Growth | 0.85*** | 1.06*** |
| (0.25) | (0.35) | |
| Duration | 0.04 | 0.03 |
| (0.11) | (0.11) | |
| Severity | 0.02 | 0.04 |
| (0.10) | (0.10) | |
| Employment Protection Legislation | -0.73 | -0.69 |
| (0.68) | (0.74) | |
| Unemployment Rate at Onset of Recession | 0.23 | |
| (0.22) | ||
| Observations | 93 | 93 |
| R-squared | 0.52 | 0.53 |
| Country Fixed Effects | YES | YES |
Note: Standard errors are clustered at the country level and in parentheses. Country-specific recessions' dates are taken from OECD's recession indicators. The unemployment rate increase is defined as the difference between a country's minimum unemployment rate in an event window up to 3 years before a recession's start and its maximum unemployment rate up to 2 years after the recession ends. Population growth is the 3-year growth rate prior to the start of the recession. Duration is the number of quarters a recession lasted. Severity is the lowest drop of GDP during the recession relative to the quarter before the recession started (in percent). Employment Protection Legislation is an OECD indicator measuring regulations on the dismissal of workers on regular and temporary contracts and the hiring of workers on temporary contracts. Unemployment Rate at the Onset of Recession is the level of the unemployment rate in the quarter in which the recession began *** p < 0.01, ** p < 0.05, * p < 0.1.
Source: OECD via Haver Analytics; FRB staff calculations.
A.3 Number of low population growth episodes
Table A3: Population Growth Episodes by Country
| Country | Number of Population Growth Episodes | Total Episodes | |
|---|---|---|---|
| Low | High | ||
| Australia | 0 | 181 | 181 |
| Austria | 0 | 96 | 96 |
| Belgium | 6 | 90 | 96 |
| Canada | 0 | 189 | 189 |
| Chile | 0 | 149 | 149 |
| Colombia | 0 | 65 | 65 |
| Costa Rica | 0 | 50 | 50 |
| Czech Republic | 7 | 93 | 100 |
| Denmark | 0 | 96 | 96 |
| Estonia | 9 | 83 | 92 |
| Finland | 7 | 85 | 92 |
| France | 0 | 80 | 80 |
| Germany | 3 | 69 | 72 |
| Greece | 1 | 99 | 100 |
| Hungary | 8 | 88 | 96 |
| Iceland | 4 | 74 | 78 |
| Ireland | 0 | 95 | 95 |
| Israel | 0 | 45 | 45 |
| Italy | 11 | 89 | 100 |
| Japan | 30 | 243 | 273 |
| Korea | 0 | 96 | 96 |
| Latvia | 1 | 83 | 84 |
| Lithuania | 0 | 72 | 72 |
| Luxembourg | 0 | 64 | 64 |
| Mexico | 0 | 72 | 72 |
| Netherlands | 0 | 92 | 92 |
| New Zealand | 0 | 148 | 148 |
| Norway | 0 | 92 | 92 |
| Poland | 5 | 87 | 92 |
| Portugal | 3 | 97 | 100 |
| Slovakia | 10 | 86 | 96 |
| Slovenia | 7 | 89 | 96 |
| Spain | 3 | 93 | 96 |
| Sweden | 0 | 88 | 88 |
| Switzerland | 0 | 64 | 64 |
| Turkey | 0 | 68 | 68 |
| United Kingdom | 0 | 208 | 208 |
| United States | 0 | 273 | 273 |
Note: Low population growth episodes are periods in which 3-year population growth was below 0.1 percent, in absolute terms. High population growth episodes are periods in which 3-year population growth was greater than or equal to 0.1 percent, in absolute terms.
Source: OECD via Haver Analytics; Authors' calculations.
1. The views expressed in this column are our own, and do not represent the views of the Board of Governors of the Federal Reserve, nor any other person associated with the Federal Reserve System. Return to text
2. For examples of discussions of this difficulty see Aaronson et al (2012), Abraham et al (2020), Brave et al (2026), Cajner et al (2025), Foote et al (2025), and Fleishman and Roberts (2011). Return to text
3. See also Edelberg et al (2026) for additional discussion on analysis of population growth and the macroeconomic implications. Return to text
4. We focus on variation in the working-age civilian non-institutionalized population growth because it is typically less cyclical than labor force growth and so less likely to be correlated with cyclical unemployment rate changes. Nevertheless, the results are similar when categorizing states based on three-year labor force growth at the onset of recessions as well as labor force growth in the more distant past (four to six years before recessions), which has the benefit of being even less correlated with business cycle dynamics but at the cost of losing one of the recessions in the sample. Return to text
5. We start in 1980 due to data limitations on publicly available Bureau of Labor Statistics data from the Local Area Unemployment Statistics on state unemployment, employment, and population. We also conduct the same exercise for the COVID-19 recession in 2020 but exclude that episode from the figures. Nonetheless, the same general results are true of this recession as well. Return to text
6. The statistics shown in figures 1 and 2 are weighted averages, with the exception of the share of months with negative payroll growth (figure 1, right panel). Return to text
7. Monthly employment data at the state level are much noisier than the aggregate data, and, thus, negative prints are much more common than in aggregate data. Therefore, the share of months with negative prints, even in the fastest-growing states in the year prior to business cycle peak, is relatively high although still considerably lower than the share in the slowest-growing states. Return to text
8. One might worry that the employment-to-population ratio falls more in slow-growth states if workers exit the labor market instead of entering unemployment. However, when we do a similar style analysis with the employment-to-population ratios we find that it falls by a similar amount across both fast-growing and slow-growing states in the average recession. Return to text
9. The estimated regression line (not shown) is, if anything, slightly upward-sloping, indicating that it is more common for recessions to occur in high-population-growth states, although the relationship is not statistically significant. Return to text
10. Throughout the analysis, we measure population growth using the population aged 15 and over as our baseline, as this metric is less affected by cyclical movements in labor force participation. Repeating the analysis with alternative measures such as the working-age population (15–64), the labor force, or the working-age labor force yields very similar results, although country coverage varies slightly due to data availability. Return to text
11. To identify recessions in our data sample, we use a recession indicator compiled by the OECD. If, instead, we identify recessions as (at least) two consecutive quarters of negative GDP growth, we obtain very similar results, as shown in section A1 in the appendix. The Employment Protection Legislation measure in the regression refers to protection of regular workers against dismissal. If we use the measure referring to the protection of temporary workers instead, the estimation results are very similar, as shown in section A2 in the appendix. Return to text
12. In appendix A3, we list the number of episodes for all countries in our data sample. Return to text
13. The findings shown in Figure 5 are based on using a three-year population growth rate to identify low population growth episodes. When we use two- or four-year windows instead, the results are very similar. Return to text
de Soyres, François, Johannes Fleck, William Peterman, Avani Pradhan, and David Ratner (2026). "Population Growth and Labor Market Fragility: Lessons from Domestic and International Experiences," FEDS Notes. Washington: Board of Governors of the Federal Reserve System, May 20, 2026, https://doi.org/10.17016/2380-7172.4070.
Disclaimer: FEDS Notes are articles in which Board staff offer their own views and present analysis on a range of topics in economics and finance. These articles are shorter and less technically oriented than FEDS Working Papers and IFDP papers.