FEDS Notes
May 16, 2023
Private Firm Repayment Vulnerabilities and Adverse Economic Conditions
Matt Darst∗, Mary Zhang†
1. Introduction
This note extends to private firms an analysis of the impact of macroeconomic conditions on corporate interest coverage ratios (ICRs), a measure of repayment risk developed by McCoy et al. (2020). Our analysis is complimentary. We utilize unique data on private-firm balance sheets obtained through the Federal Reserve's Comprehensive Capital Analysis and Review (CCAR) process and evaluate the impact of updated and new macroeconomic projections on the distribution and path of corporate interest coverage ratios. Our projections include three new pieces of analysis. The first piece considers a stagflation scenario in light of recent cooling of economic activity and high inflation. The second piece allows for heterogeneous corporate earnings responses to aggregate economic conditions based on industry classification. Finally, we allow firms to fully draw down their unutilized credit lines, consistent with evidence from the onset of the COVID-19 outbreak (see Greenwald et al. (2020)).
ICRs–defined as the ratio of earnings before interest and taxes (EBIT) to interest expenses on outstanding debt–are used widely by practitioners to assess how easily firms can meet interest payments out of earnings.1 Any ICR below one is a signal of severe distress with high default likelihood. Thus, we define debt-at-risk (DAR) as debt attributable to firms with ICR less than one. The path of ICRs depends on the path of both corporate earnings and interest expenses. We project the path of corporate earnings and interest expenses based on projections from Moody's Analytics U.S. Macro Forecast database.
Specifically, we project ICRs according to a baseline scenario in which growth is moderate and interest rates increase slightly, a severely adverse scenario that includes a sharp drop in economic activity and progressively lower interest rates to aid the recovery, and a stagflation scenario with a modest growth slowdown but additional interest rate increases to combat ongoing inflation.
The results show that both adverse scenarios are equally stressful for corporate balance sheets, but corporate ICRs do not fall to alarmingly low levels by historical standards. In both adverse scenarios, the aggregate ICR–total EBIT over total interest expenses–falls from 5.5 to around 4.5, but it remains inline with pre-pandemic levels. The amount of DAR, which is already on an upward long-term trend, increases by $108 billion or 1.7 percent of total outstanding debt in 2022Q2. The main difference between the adverse scenarios is the variable paths. ICRs fall and recover more quickly in the severely adverse scenario compared to the stagflation scenario where the changes are gradual. Economic growth and earnings fall rapidly and quickly recover in the severely adverse scenario while interest rates change modestly. The more persistent stress in the stagflation scenario comes from the prolonged slowdown and steady rise in interest rates needed to combat inflation.
Finally, we find that layering on a credit line drawdown adds approximately $65 billion or 1.0 percentage point of additional DAR to the two adverse scenarios. The additional balance sheet debt is assumed to accrue onto the balance sheet in the first quarter of projection and is held for pre-cautionary reasons while increasing future interest burdens. Therefore, ICRs fall and the amount of DAR rises. The scenarios with full credit line drawdowns imply peak DAR of nearly 22 percent of outstanding private firm debt, reaching the 68th percentile of its historical distribution.
2. Non-financial Private Firm Debt
Our analysis focuses on U.S. non-financial private firms. In the United States, private small and medium-sized enterprises (SMEs) account for 99.8 percent of all firms by count, 52 percent of private sector employment and 48 percent of private sector gross output.2 Moreover, as shown in Figure 1, total private firm debt is substantial, reaching $6.2 trillion in 2022Q2.3 Table 1 shows that bond debt—mostly fixed-rate—accounts for a small portion of total balance sheet debt among private borrowers in our data. Hence, focusing on loans in the FR-Y14 does not create a huge blind spot for private firms. However, total interest expenses accrue from all borrowing, not just floating-rate loans. Therefore, the ICR and DAR analysis is based on the totality of private firm debt while changes in interest expenses will derive only from the floating-rate portion of balance sheet debt.4
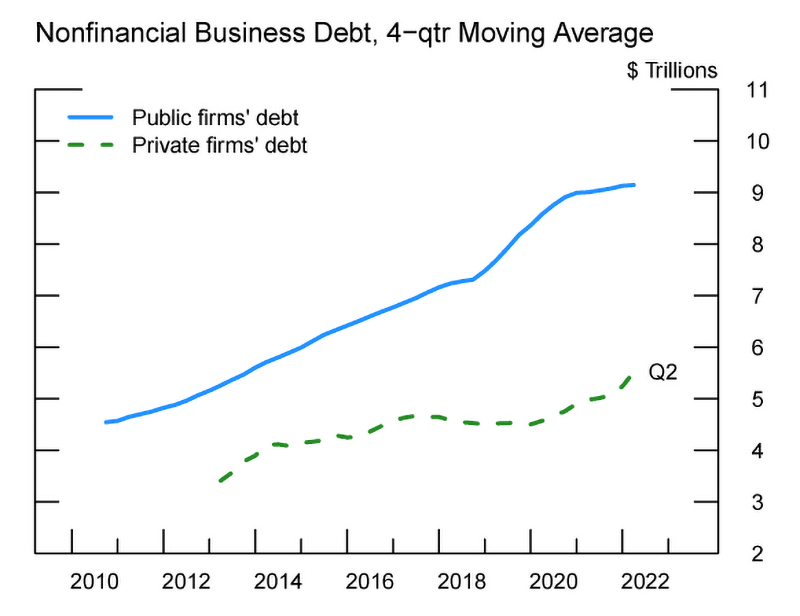
Note: Public firms’ debt and private firms’ debt are the sum of short-term and long-term debt. They exclude finance and insurance companies, real estate companies, holding companies, nonprofit organizations, government administration, and some educational services.
Sources: Compustat Unrestated Quarterly Database, Wharton Research Data Services, https://www.whartonwrds.com/datasets/ (Accessed August 26, 2022); Board of Governors of the Federal Reserve System, Capital Assessments and Stress Testing (FR Y-14).
Table 1: Private Debt Breakdown by Ratings in 2022Q2
| ($ Billions) | Total Debt | Committed Exposure | Utilized Exposure | Total Bond Debt |
|---|---|---|---|---|
| Total | 6211.43 | 1019.12 | 492.73 | 274.26 |
| A and higher | 894.23 | 91.48 | 34.62 | 46.71 |
| BBB | 1818.4 | 330.95 | 139.48 | 96.73 |
| BB | 1665.84 | 328.82 | 186.3 | 38.57 |
| Below BB | 1326.22 | 161.76 | 91.74 | 29.15 |
| Unrated | 506.74 | 111.11 | 40.59 | 63.1 |
Note: Sources: FR-Y14 Q H.1; Mergent Corporate FISD Daily Feed (FITF).
Figure 2 breaks down utilized loan amounts in the FR Y-14Q and bond debt from Mergent FISD by maturity bucket and rating. Utilized loans maturing in 2022 account for about 15 percent of all outstanding loans (Panel a). More than half of floating-rate loans in the data are attributable to sub-investment grade borrowers (Panel b). By contrast, over half of the bond debt issued by private borrowers is investment grade (Panel c).
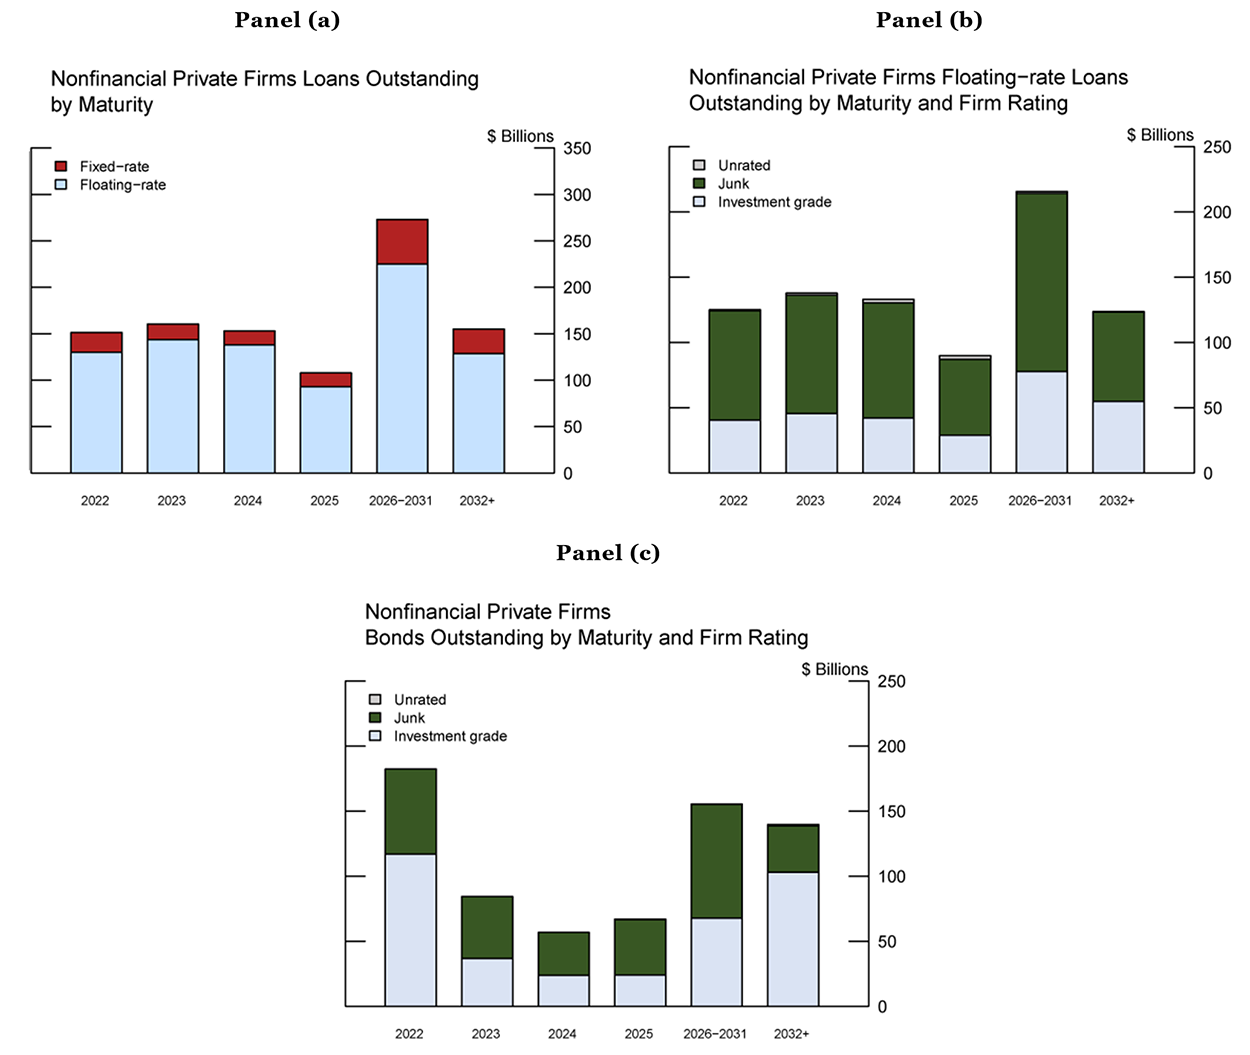
Note: Panel a plots the amount of utilized loans by maturity. Panel b plots the the amount of utilized floating-rate loans by firm rating and maturity. Panel c plots the total amount of outstanding bond debt by firm rating and maturity. In Panel b and c, the key identifies in order from top to bottom.
Sources: FR-Y14 Q H.1; Mergent Corporate FISD Daily Feed (FITF).
Table 2 shows the distribution of various balance sheet ratios across the entire sample. The median ratio of earnings before taxes and interest (EBIT) to assets is around 8 percent. Only 10 percent of private firms have negative EBIT. The median value of leverage—defined as total debt over assets—is 28 percent, and the median value of credit line availability— defined as undrawn credit over total assets—is 6 percent. The median private borrower has about 43 percent of its debt due within one year. Three-quarters of all private firms have 94 percent of their borrowing due with in one year. Finally, ICR has a median value of 5.55. This implies that the median firm has 5.55 times of annual earnings relative to interest expenses. However, there is substantial variation in ICRs. For example, the interquartile range—between the 25th and 75th percentiles— is 19.41.
Table 2: Breakdown of Aggregate Private Debt
| EBIT/Assets | Free Cash Flow/Assets | Total Debt/Assets | Undrawn Credit Lines/Assets | ICR (=EBIT/Interest Expense) | Share of Debt Maturing within a Year | |
|---|---|---|---|---|---|---|
| 10th Percentile | ‐0.02 | ‐0.1 | 0 | 0 | ‐2.63 | 0.01 |
| 25th Percentile | 0.03 | ‐0.01 | 0.08 | 0 | 1.37 | 0.1 |
| 50th Percentile | 0.08 | 0.05 | 0.28 | 0.06 | 5.55 | 0.43 |
| 75th Percentile | 0.16 | 0.14 | 0.52 | 0.18 | 20.78 | 0.94 |
| 90th Percentile | 0.28 | 0.28 | 0.73 | 0.34 | 94.75 | 1 |
| Firm Count | 125605 | 116891 | 133116 | 133116 | 120162 | 122900 |
Note: Free cash flow is computed as earnings before taxes minus capital expenditure. Sources: FR-Y14 Q H.1
Figure 3 compares the distribution of firm ICRs using the most recent data in 2022Q2 to 2021Q2.5 During this time, the right tail of the ICR distribution has widened, and fewer firms have ICRs around 0, suggesting substantial improvements in corporate balance sheets since the worst of the pandemic.
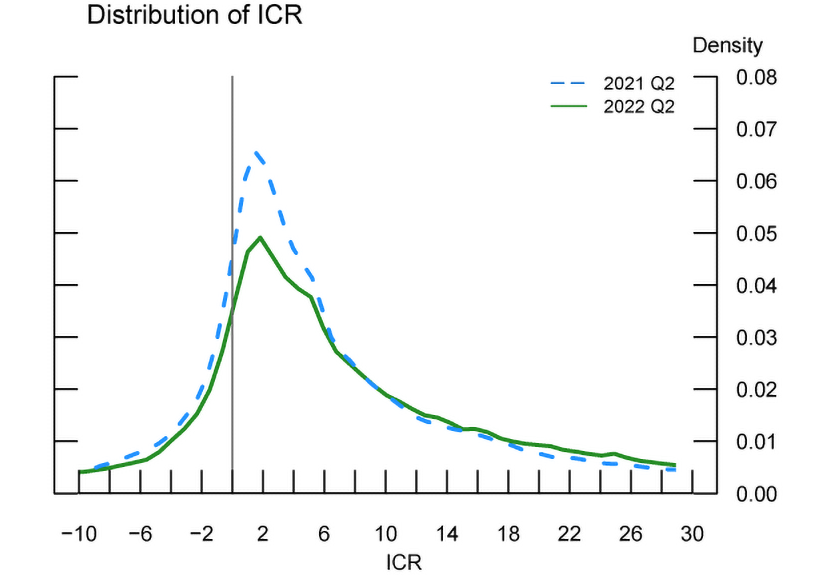
Note: This is a density plot of the truncated ICR distribution as of 2021Q2 and 2022Q2.
3. Interest Coverage Ratios Under Different Economic Conditions
In this section we begin by describing the different economic scenarios under which we project ICRs. In particular, we are interested in the impact of different economic scenarios on ICRs and the amount of debt that becomes distressed. More specifically, an ICR less than one signals extreme distress and a firm's inability to repay interest expenses on loans out of normal earnings.
There are three direct factors that affect ICRs: changes in economic growth that impact earnings, changes in interest expenses due to changing interest rates, and/or borrowing changes that impact total debt burden. Our economic projections that impact these variables come from Moody's Analytics U.S. Macro Forecasts. We consider three scenarios: A baseline scenario characterized by moderate economic growth and mild interest rate increases; A severely adverse scenario with sharp economic contraction and lower interest rates to aid the recovery; A stagflation scenario with low-to-moderate economic growth followed by a mild recession but higher interest rates to combat inflation. We augment the severely adverse and stagflation scenarios in two additional ways. First, we allow for industry heterogeneity in earnings responses to the macro environment; second, we allow firms to fully draw down their existing credit lines. Armed with earnings and interest expense projections implied by the different scenarios, we calculate quarterly ICR projections and the amount of debt attributable to firms with an ICR less than 1, which we call debt-at-risk.
Table 3 contains the main macroeconomic variables across the three scenarios. The jump-off point is 2022Q2. For each scenario, we estimate corporate earnings in two different ways. In our standard projection model, we first regress aggregate earnings growth on real GDP growth to obtain the elasticity of earnings with respect to GDP. Then, for each firm, we project earnings using the on-average earnings elasticity applied to the real GDP path from each scenario. Our second method of estimating corporate earnings growth allows for heterogeneity at the industry level. We obtain industry level earnings from the National Income and Product Accounts and run separate regressions for each industry to obtain the industry-specific elasticity of earnings with respect to U.S. GDP growth. Then, for each firm, we apply the corresponding industry elasticity to project its earnings based on the real GDP growth path implied by each scenario.
Table 3: Scenarios for Economic and Financial Conditions
Panel (a) CCAR Baseline
| Date | Real GDP growth | Earnings Growth | Unemployment rate | CPI inflation rate | 3‐month Treasury rate | 5‐year Treasury yield | 10‐year Treasury yield | BBB corporate yield | Prime rate |
|---|---|---|---|---|---|---|---|---|---|
| 2022 Q3 | 1.67 | 5.43 | 3.57 | 5.88 | 2.67 | 3.23 | 3.1 | 5.33 | 5.37 |
| 2022 Q4 | 0.2 | 0.64 | 3.55 | 3.41 | 3.88 | 4.08 | 3.94 | 6.47 | 6.95 |
| 2023 Q1 | ‐0.09 | ‐0.3 | 3.68 | 2.97 | 4.39 | 4.54 | 4.57 | 7.42 | 7.69 |
| 2023 Q2 | 0.66 | 2.14 | 3.87 | 2.69 | 4.45 | 4.59 | 4.62 | 7.07 | 7.78 |
| 2023 Q3 | 2.09 | 6.8 | 3.96 | 2.02 | 4.43 | 4.56 | 4.59 | 6.83 | 7.75 |
| 2023 Q4 | 2.19 | 7.12 | 4.05 | 2.07 | 4.37 | 4.49 | 4.53 | 6.73 | 7.71 |
| 2024 Q1 | 2.29 | 7.45 | 4.09 | 2.19 | 4.13 | 4.35 | 4.42 | 6.7 | 7.47 |
| 2024 Q2 | 2.59 | 8.42 | 4.01 | 2.09 | 3.94 | 4.14 | 4.19 | 6.44 | 7.22 |
| 2024 Q3 | 2.94 | 9.56 | 3.91 | 2.01 | 3.73 | 3.81 | 3.82 | 6.03 | 6.95 |
| 2024 Q4 | 3.03 | 9.85 | 3.84 | 1.96 | 3.59 | 3.72 | 3.76 | 5.94 | 6.78 |
| 2025 Q1 | 2.94 | 9.56 | 3.77 | 1.92 | 3.19 | 3.6 | 3.73 | 5.83 | 6.5 |
Panel (b) Moody’s Severely Adverse
| Date | Real GDP growth | Earnings Growth | Unemployment rate | CPI inflation rate | 3‐month Treasury rate | 5‐year Treasury yield | 10‐year Treasury yield | BBB corporate yield | Prime rate |
|---|---|---|---|---|---|---|---|---|---|
| 2022 Q3 | 1.67 | 5.43 | 3.57 | 5.88 | 2.67 | 3.23 | 3.1 | 5.33 | 5.37 |
| 2022 Q4 | ‐2.63 | ‐8.57 | 5.84 | 5.22 | 3.87 | 3.11 | 2.66 | 6.48 | 7.21 |
| 2023 Q1 | ‐6.39 | ‐20.8 | 6.86 | 5.29 | 4.3 | 3.03 | 2.61 | 8.46 | 8.21 |
| 2023 Q2 | ‐6.63 | ‐21.59 | 7.67 | 2.78 | 4.47 | 3.01 | 2.54 | 7.03 | 8.41 |
| 2023 Q3 | ‐0.7 | ‐2.29 | 8.2 | 1.85 | 3.83 | 2.84 | 2.52 | 6.04 | 7.48 |
| 2023 Q4 | ‐0.49 | ‐1.6 | 8.66 | 1.54 | 3.41 | 2.8 | 2.6 | 5.93 | 6.89 |
| 2024 Q1 | 0.69 | 2.24 | 8.9 | 0.94 | 2.77 | 2.68 | 2.65 | 5.68 | 6.06 |
| 2024 Q2 | 1.79 | 5.82 | 8.93 | 0.67 | 2.29 | 2.6 | 2.7 | 5.3 | 5.38 |
| 2024 Q3 | 1.75 | 5.69 | 8.94 | 1.07 | 1.84 | 2.54 | 2.76 | 5.28 | 4.78 |
| 2024 Q4 | 1.77 | 5.75 | 8.79 | 1.26 | 1.49 | 2.49 | 2.81 | 5.19 | 4.33 |
| 2025 Q1 | 3.96 | 12.88 | 8.52 | 1.44 | 1.11 | 2.45 | 2.88 | 5.07 | 4.07 |
Panel (c) Moody’s Stagflation
| Date | Real GDP growth | Earnings Growth | Unemployment rate | CPI inflation rate | 3‐month Treasury rate | 5‐year Treasury yield | 10‐year Treasury yield | BBB corporate yield | Prime rate |
|---|---|---|---|---|---|---|---|---|---|
| 2022 Q3 | 1.67 | 5.43 | 3.57 | 5.88 | 2.67 | 3.23 | 3.1 | 5.33 | 5.37 |
| 2022 Q4 | 0.08 | 0.25 | 4.05 | 3.77 | 3.9 | 4.31 | 4.24 | 6.98 | 7.01 |
| 2023 Q1 | ‐0.35 | ‐1.15 | 4.4 | 4.04 | 4.5 | 4.78 | 4.86 | 8.1 | 7.92 |
| 2023 Q2 | ‐0.16 | ‐0.53 | 4.76 | 3.77 | 4.53 | 4.83 | 4.92 | 7.92 | 8.03 |
| 2023 Q3 | 0.29 | 0.94 | 4.97 | 3.75 | 4.5 | 4.72 | 4.79 | 7.66 | 8.05 |
| 2023 Q4 | ‐0.02 | ‐0.07 | 5.17 | 3.9 | 4.5 | 4.63 | 4.66 | 7.62 | 8.16 |
| 2024 Q1 | ‐3.12 | ‐10.16 | 5.8 | 3.23 | 4.47 | 4.51 | 4.52 | 8.01 | 8.32 |
| 2024 Q2 | ‐4.63 | ‐15.08 | 7.07 | 2.88 | 4.37 | 4.16 | 4.09 | 7.71 | 8.22 |
| 2024 Q3 | ‐3.93 | ‐12.8 | 8.09 | 2.42 | 4.33 | 3.73 | 3.53 | 6.95 | 8.15 |
| 2024 Q4 | ‐2.69 | ‐8.76 | 9.06 | 1.79 | 3.99 | 3.4 | 3.2 | 6.55 | 7.67 |
| 2025 Q1 | 0.94 | 3.05 | 8.85 | 1.69 | 3.49 | 3.07 | 2.93 | 5.78 | 7.17 |
Note: All numbers are reported in percentage terms. Real GDP growth and earnings growth are annualized
Panel a describes the baseline scenario characterized by moderate economic growth, falling inflation, and a modest increase and subsequent fall in unemployment and interest rates. Panel b is the severely adverse scenario characterized by an initial sharp fall in economic activity and rapid recovery through 2025. The unemployment rate peaks in 2024Q3. Interest rates begin falling 2023Q3, but they do not reach the ZLB. The prime-loan rate—the rate at which most corporate loans are priced—peaks in 2023Q2 and continues to fall through 2025. Finally, panel c is a stagflation scenario characterized by a more moderate but prolonged fall in economic growth through 2024Q4, rise in unemployment, and persistently high consumer price index. Elevated inflation levels cause the central bank to continue increasing the federal funds rate. As a result, the prime-loan rate continues rising and peaks in 2024Q1 before falling very slightly through 2025Q1.
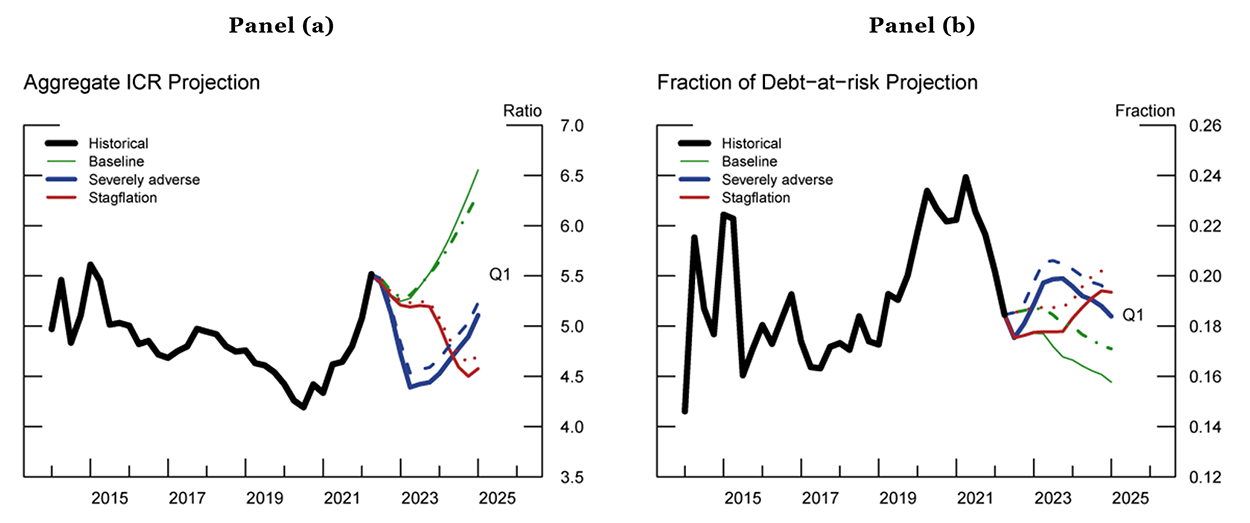
Figure 4 shows the projections of interest expenses (panel a), earnings (panel b), and ICRs (panels c and d). The black solid line presents historical data, the green dotted-dashed line is the projection under the baseline scenario, the blue dashed line is the projection under the severely adverse scenario, and the red dotted line is the projection under the stagflation scenario. The aggregate ICR, shown in panel d, is the sum of all firms' EBIT divided by total interest expenses. The aggregate ICR can be viewed as an aggregate measure of corporate debt repayment vulnerability.
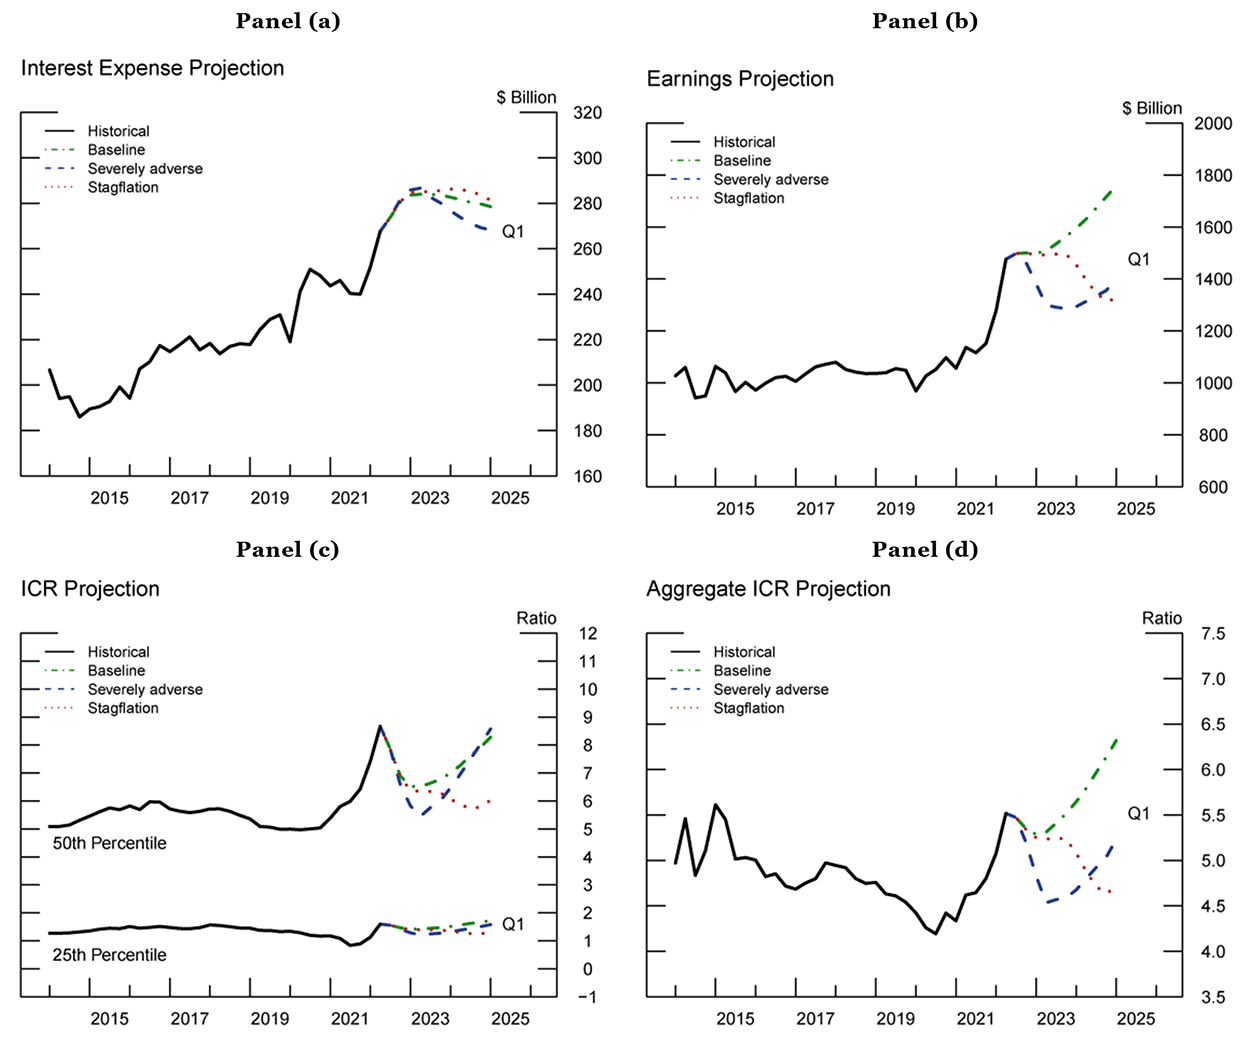
Note: In Panel c, ICR is calculated as EBIT divided by interest expense. In Panel d, aggregate ICR is calculated as the sum of all firm earnings divided by all firm interest expenses.
The aggregate ICR rises sharply in the baseline scenario, reflecting strong economic growth and earnings with moderate interest rate increases. By contrast, the aggregate ICR falls sharply in the severely adverse scenario and more gradually in the stagflation scenario to similar levels of stress. The aggregate ICR recovers in the severely adverse scenario due to a strong economic recovery combined with low interest rates during the second half of the projection period. By contrast, the aggregate ICR remains below the jump-off point in the stagflation scenario, settling below the median of its historical distribution by 2025.
Figure 5 is the truncated distribution of firm ICRs across the three scenarios during the quarter in which median ICR reaches its nadir. Going from green to blue, the figure shows that ICRs become more concentrated between 0 and 2, reflecting different severity of economic downturn in the baseline, severely adverse, and stagflation scenarios.
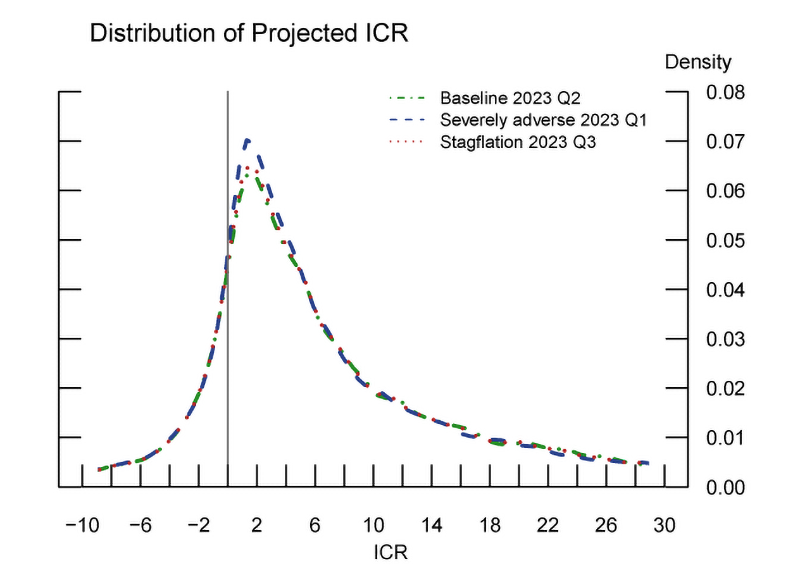
Note: This plots the truncated distribution of projected ICR when its median reaches a trough in each projection scenario.
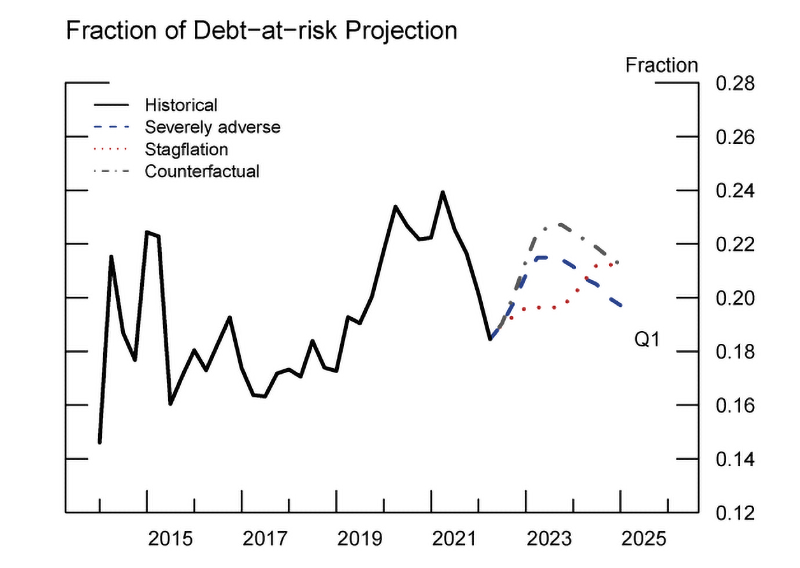
Figure 6 shows the amount of debt attributable to firms with an ICR less than 1 that we define as DAR. DAR reflects the fraction of debt under severe risk of default. Panel a is the dollar value of DAR, and panel b is DAR as a faction of total outstanding debt. DAR at the jump-off point in 2022Q2 was 18.5 percent of total outstanding debt, at its historical median. In line with the aggregate ICR paths, under the severely adverse scenario, DAR rises in 2023Q1 and reaches 20.6 percent of outstanding debt before it falls. The dollar value of the additional DAR in the scenario is $139 billion, just 2 percent of outstanding debt. Under the stagflation scenario, DAR continuously increases into 2025. The higher implied interest rate path needed to tame inflation results in peak DAR at the end of the projection—20.2 percent of total debt in 2025Q1. That said, across both scenarios, DAR is commensurate with levels seen early in the pandemic, well below the 23.9 percent maximum seen during the height. All told, the rapid deterioration of corporate balance sheets implied by the severely adverse scenario could be more problematic in the near term if it coincides with other non-linearities such as roll-over risk, covenant violations, and/or a pull back in credit across the financial system (see Chodorow-Reich and Falato (2022)).
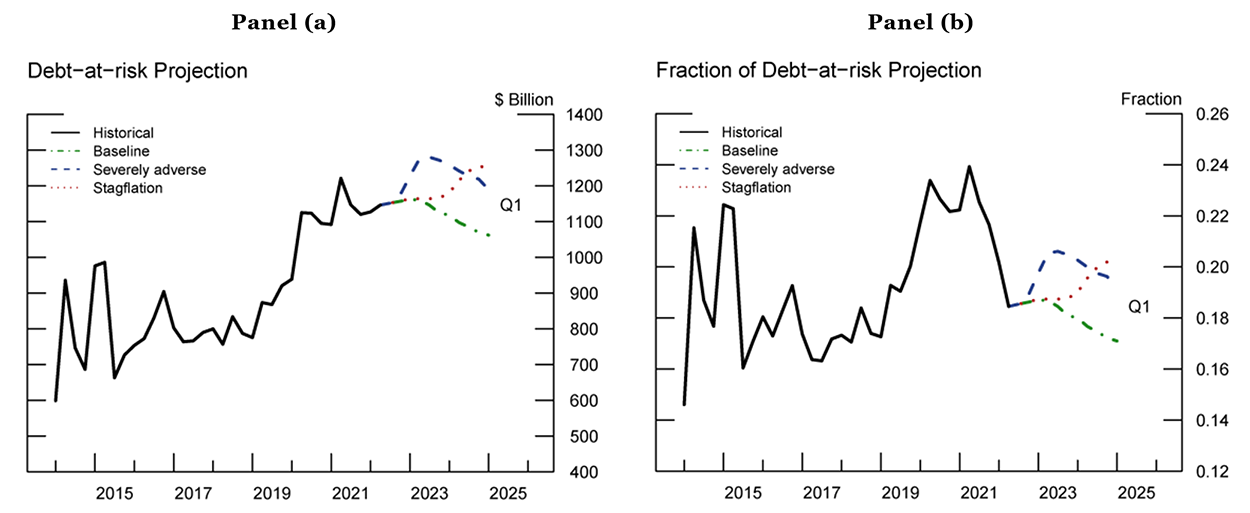
Note: Debt-at-risk is the total dollar amount of debt attributable to firms with ICR less than one. Panel b measures debt-at-risk as a fraction of total debt.
4. Industry Heterogeneity and Sensitivity to Credit Line Draw-downs
This section provides additional DAR analysis allowing for heterogeneity in industry earnings and for firms to completely draw down their unused credit lines.
We begin by examining the historical relationship between real GDP growth and earnings growth in different industries based on 2-digit NAICS codes. In the methodology described in Section 2, there is a statistically significant relationship between real GDP growth and earnings growth in the following industries: manufacturing, wholesale trade, transportation, and other financial sectors.6 We do not adjust earnings for acyclical industries. Table 4 shows the earnings path for the different scenarios implied by the historical relationship between industry-specific earnings and GDP growth. Transportation and manufacturing have the highest elasticities, followed by other non-financial sectors and wholesale trade.
Table 4: Scenarios for Heterogeneous Earnings Growth across Industries
Panel (a) CCAR Baseline
| Quarter | Real GDP growth | Manufacturing | Wholesale | Transportation | Other nonfinancial sectors |
|---|---|---|---|---|---|
| 2022 Q3 | 1.67 | 9.71 | 3.88 | 25.35 | 7.02 |
| 2022 Q4 | 0.2 | 1.16 | 0.47 | 2.97 | 0.84 |
| 2023 Q1 | ‐0.09 | ‐0.53 | ‐0.2 | ‐1.45 | ‐0.38 |
| 2023 Q2 | 0.66 | 3.83 | 1.54 | 9.97 | 2.77 |
| 2023 Q3 | 2.09 | 12.16 | 4.86 | 31.74 | 8.79 |
| 2023 Q4 | 2.19 | 12.74 | 5.09 | 33.26 | 9.21 |
| 2024 Q1 | 2.29 | 13.32 | 5.32 | 34.78 | 9.63 |
| 2024 Q2 | 2.59 | 15.07 | 6.02 | 39.35 | 10.9 |
| 2024 Q3 | 2.94 | 17.1 | 6.83 | 44.68 | 12.37 |
| 2024 Q4 | 3.03 | 17.63 | 7.04 | 46.05 | 12.75 |
| 2025 Q1 | 2.94 | 17.1 | 6.83 | 44.68 | 12.37 |
Panel (b) Moody’s Severely Adverse
| Quarter | Real GDP growth | Manufacturing | Wholesale | Transportation | Other nonfinancial sectors |
|---|---|---|---|---|---|
| 2022 Q3 | 1.67 | 9.71 | 3.88 | 25.35 | 7.02 |
| 2022 Q4 | ‐2.63 | ‐15.31 | ‐6.1 | ‐40.11 | ‐11.07 |
| 2023 Q1 | ‐6.39 | ‐37.2 | ‐14.83 | ‐97.35 | ‐26.89 |
| 2023 Q2 | ‐6.63 | ‐38.59 | ‐15.38 | ‐101 | ‐27.9 |
| 2023 Q3 | ‐0.7 | ‐4.08 | ‐1.62 | ‐10.73 | ‐2.95 |
| 2023 Q4 | ‐0.49 | ‐2.86 | ‐1.13 | ‐7.54 | ‐2.06 |
| 2024 Q1 | 0.69 | 4.01 | 1.61 | 10.43 | 2.9 |
| 2024 Q2 | 1.79 | 10.41 | 4.16 | 27.17 | 7.53 |
| 2024 Q3 | 1.75 | 10.18 | 4.07 | 26.56 | 7.36 |
| 2024 Q4 | 1.77 | 10.29 | 4.11 | 26.87 | 7.45 |
| 2025 Q1 | 3.96 | 23.04 | 9.2 | 60.21 | 16.66 |
Panel (c) Moody’s Stagflation
| Quarter | Real GDP growth | Manufacturing | Wholesale | Transportation | Other nonfinancial sectors |
|---|---|---|---|---|---|
| 2022 Q3 | 1.67 | 9.71 | 3.88 | 25.35 | 7.02 |
| 2022 Q4 | 0.08 | 0.46 | 0.19 | 1.14 | 0.33 |
| 2023 Q1 | ‐0.35 | ‐2.04 | ‐0.81 | ‐5.4 | ‐1.48 |
| 2023 Q2 | ‐0.16 | ‐0.94 | ‐0.37 | ‐2.51 | ‐0.68 |
| 2023 Q3 | 0.29 | 1.68 | 0.68 | 4.34 | 1.22 |
| 2023 Q4 | ‐0.02 | ‐0.12 | ‐0.04 | ‐0.38 | ‐0.09 |
| 2024 Q1 | ‐3.12 | ‐18.17 | ‐7.24 | ‐47.57 | ‐13.13 |
| 2024 Q2 | ‐4.63 | ‐26.95 | ‐10.74 | ‐70.56 | ‐19.49 |
| 2024 Q3 | ‐3.93 | ‐22.88 | ‐9.12 | ‐59.9 | ‐16.54 |
| 2024 Q4 | ‐2.69 | ‐15.66 | ‐6.24 | ‐41.03 | ‐11.32 |
| 2025 Q1 | 0.94 | 5.46 | 2.19 | 14.23 | 3.95 |
Note: All numbers are annualized growth rate and are reported in percentage terms. Other financial sectors include agriculture, forestry, fishing, and hunting; mining; construction; real estate and rental and leasing; professional, scientific, and technical services; administrative and waste management services; educational services; health care and social assistance; arts, entertainment, and recreation; accommodation and food services; and other services, except government.
Figure 7 shows the aggregate ICR and DAR projections allowing for heterogeneous industry earnings. Compared to the standard projection models, accounting for heterogeneous earnings growth slightly improves DAR projections in all three scenarios by about a percentage point. This suggests that industries with more cyclical earnings tend to contain firms with higher ICRs. As a result, a sharp decline in earnings does not move the ICR to extremely low levels to generate additional DAR.
Note: Severely adverse dashed line, Baseline dash-dotted line and Stagflation dotted line indicate standard model projections.
Our last exercise allows firms to fully draw down their available credit under the severely adverse and stagflation scenarios. Intuitively, firms with spare borrowing capacity may draw down available credit to meet payroll and immediate financing needs in light of reduced earnings. The additional debt on the balance sheet increases interest expenses, which will lower ICRs and increase DAR. We assume for simplicity that firms draw down all available credit in the first projection quarter and hold the available cash on their balance sheet for precautionary motives without repayment.
Figure 8 shows the interest expense and DAR projections. Recall that interest rates in the severely adverse scenario are assumed to decline slowly throughout the scenario to support economic recovery. By contrast, interest expenses continue to rise as rates increase under the stagflation scenario. The analysis shows that the fraction of debt at risk, across both scenarios, increases around 100bps due to the credit line draw down. In the severely adverse scenario, DAR as a fraction of total debt peaks at 21.5 percent in 2023Q3, around the 68th percentile of its historical distribution. The total amount of new DAR implied by the scenario is $189 billion, only 3 percent of total outstanding debt. Figure 9 provides a counterfactual exercise in blue to generate a level of DAR stress close to pandemic heights. We augmented the severely adverse scenario in panel b of Table 3 with a level shift down in GDP growth each quarter by 2 percent annualized and a level shift increase in interest rates by 100 bps. Such a scenario implies two quarters of negative 8 percent annualized GDP growth with prime borrowing rates over 9 percent.
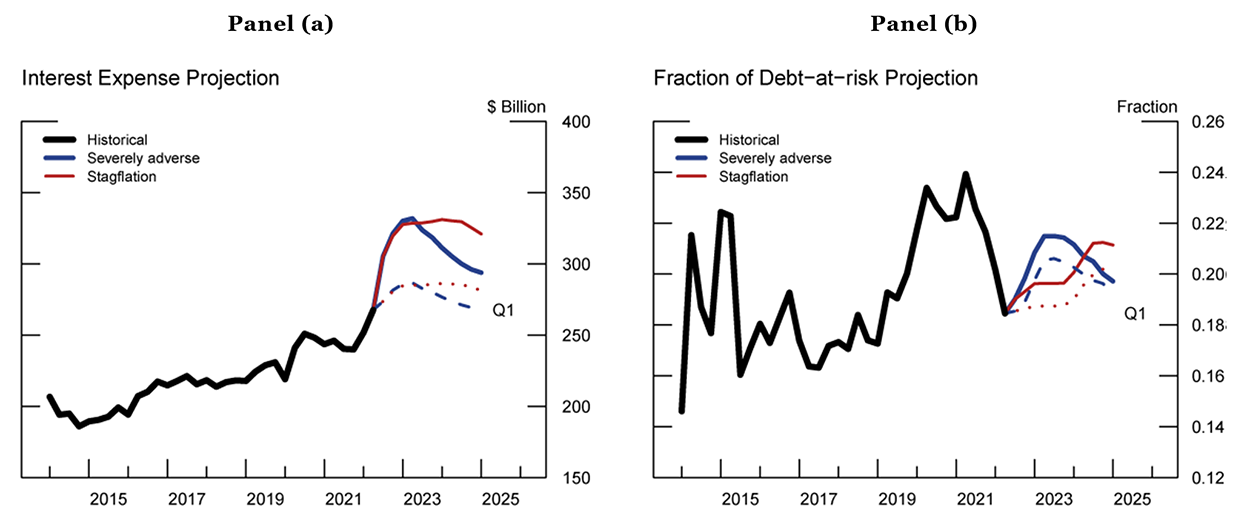
Note: Severely adverse dashed line, and Stagflation dotted line indicate standard model projections.
5. Conclusion
This note presents an analysis of private firm debt vulnerabilities arising from repayment risk due to different aggregate economic scenarios. We examine interest coverage ratios and the amount of debt attributable to firms with ICRs below 1—debt-at-risk–using the broadest set of private-firm balance sheet data available in the United States.
The main takeaways are: 1) private-firm balance sheets are in relatively strong standing as of 2022Q2 due to strong earnings and continued low interest rates post pandemic and 2) the stress considered in the Moody's projections is not severe enough to push alarmingly large amounts of private debt into default risk by historical standards. Finally, assuming firms immediately draw down all available credit raises DAR by 1 additional percentage point in both the severely adverse and stagflation scenarios. In both cases, DAR remains below the 70th percentile of its historic distribution. It would take a very large shock with unusually high interest rates by recent standards to generate DAR commensurate with peak pandemic levels.
References
Caglio, Cecilia R., R. Matthew Darst, and S¸ebnem Kalemli-O¨ zcan. 2022. "Risk- Taking and Monetary Policy Transmission: Evidence from Loans to SMEs and Large Firms." 10.3386/w28685, NBER Working Paper No. 28685.
Chodorow-Reich, Gabriel, and Antonio Falato. 2022. "The Loan Covenant Channel: How Bank Health Transmits to the Real Economy." The Journal of Finance 77 (1): 85–128. https://doi.org/10.1111/jofi.13074.
Greenwald, Daniel L., John Krainer, and Pascal Paul. 2020. "The Credit Line Chan- nel." https://doi.org/10.24148/wp2020-26, Federal Reserve Bank of San Francisco Working Paper 2020-26.
McCoy, Jack, Francisco Palomino, Ander Perez-Orive, Charles Press, and Gerardo Sanz-Maldonado. 2020. "Interest Coverage Ratios: Assessing Vulnerabilities in Nonfinancial Corporate Credit." FEDS Notes. Washington: Board of Governors of the Federal Reserve System, https://doi.org/10.17016/2380-7172.2779.
Mergent, Inc., Mergent corporate FISD Daily Feed (FITF). http://www.ftserussell.com/financial-data/fixed-income-data.
Modi, Kosha. 2022. "Loan Covenants and the Investment Channel of Monetary Policy." Working Paper.
Moody's Analytics, Inc., U.S. Macro Forecast Database.
∗ Federal Reserve Board of Governors: [email protected]. Return to text
† Federal Reserve Board of Governors: [email protected]. Return to text
1. More broadly, recent academic research suggests that ICR is an important conduit through which monetary policy impacts corporate loan terms, see Modi (2022). Return to text
2. see www.census.gov. Return to text
3. The total debt balances among all private firms in the FR Y14Q H.1 schedule is even larger. Due to the nature of our analysis, we require certain balance sheet items that are not always reported for all borrowers. We also drop financial firms, real estate firms, public services, and some education establishments. See Caglio et al. (2022) for a detailed description of the data cleaning. Return to text
4. For example, consider a borrower with both fixed-rate and floating-rate debt. Total interest expenses derive from both loan types. However, interest rate changes only impact the floating-rate portion, increasing the stock of total interest expenses. Return to text
5. Compared to Figure 2, the right tail of the distribution is truncated to visually show how most of the mass has evolved during the past year. Return to text
6. Other non-financial sectors include agriculture, forestry, fishing, and hunting; mining; construction; real estate and rental leasing; professional, scientific, and technical services; administrative and waste manage- ment services; educational services; health care and social assistance; arts, entertainment, and recreation; accommodation and food services; and other services, except government. Return to text
Darst, Matthew, and Zhang, Mary (2023). "Private Firm Repayment Vulnerabilities and Adverse Economic Conditions," FEDS Notes. Washington: Board of Governors of the Federal Reserve System, May 16, 2023, https://doi.org/10.17016/2380-7172.3254.
Disclaimer: FEDS Notes are articles in which Board staff offer their own views and present analysis on a range of topics in economics and finance. These articles are shorter and less technically oriented than FEDS Working Papers and IFDP papers.