


FEDS Notes
August 26, 2026
Repo Markets and the Fed’s Balance Sheet: Implications for Monetary Policy Implementation
Sriya Anbil, Alyssa Anderson, Lucy Cordes, and Romina Ruprecht1
1. Introduction
As the Federal Reserve (Fed) navigates periods of balance sheet expansion and reduction, it has become increasingly important to understand how changes in the size and composition of Fed assets affect short-term funding markets. The overnight Treasury repo market is central to this relationship since it is a transmission channel through which balance sheet policy can affect money market conditions and, ultimately, the Fed's policy rate, the effective federal funds rate (EFFR). In addition, it serves as a vital funding source for Treasury market participants and provides a reference rate for trillions of dollars of financial contracts, so also acts as a key transmission channel for monetary policy to broader financial market conditions.
In its December 2025 meeting, the FOMC determined that reserves had declined to ample levels and that it would purchase short-term Treasury securities to maintain an ample supply of reserves on an ongoing basis. As Anbil et al. (2024) outline, the size of the central bank's balance sheet that is consistent with an "ample reserves" framework can be thought of as facing two constraints. The first arises from banks' reserve demand, which directly affects lending and borrowing behavior by banks in the federal funds market and, therefore, EFFR.2 The second, less studied constraint, arises from demand for liquidity by non-banks (i.e., dealers and levered investors) that are primarily active in repo markets. This note focuses on the second constraint and examines the mechanism through which Fed balance sheet policy influences repo market dynamics and why these dynamics matter for monetary policy implementation.
The effect of the Fed's balance sheet on short-term interest rates works through two connected steps: First, when the Fed reduces the size of its balance sheet, overall liquidity declines while the private sector must hold more Treasury securities. This increases dealer financing needs alongside a reduction in the supply of funds available to lend in the repo market, putting upward pressure on repo rates. Second, these repo pressures can spill over to the federal funds market, potentially affecting EFFR even when bank reserves remain above banks' minimum level of demand. We provide empirical evidence for this mechanism and discuss key factors that affect the relationship between the Fed's balance sheet and repo market conditions, including the level of the policy rate, Treasury bill supply, dealer regulation, and Fed standing repo operations.
2. How the Repo Market Functions
The overnight Treasury repo market is one of the most important funding markets in the world. It sees more than $8 trillion in daily trading volume and plays a vital role in broader Treasury market liquidity and price discovery.3 Repo rates also determine the secured overnight financing rate (SOFR)—now the primary reference rate for trillions of dollars of financial contracts—thereby affecting broader financial conditions.
Although the repo market is composed of several segments, we focus our analysis on the "tri-party" segment. In this segment, which has around $1.5 trillion in daily volume, the largest borrowers are primary dealers, which borrow cash from money market mutual funds (MMFs) to finance Treasury security holdings that they have purchased in the primary Treasury market. This segment is particularly important for understanding the implications of the Fed's balance sheet for money markets because dealers' financing needs are directly connected to how many Treasuries that are held by the private sector.4
Tri-party repo rates are influenced by both the supply of and demand for funding.
On the demand side, both primary dealers and hedge funds borrow in repo to finance purchases of longer-dated, coupon-bearing Treasury securities. Therefore, there is a direct link between demand for repo borrowing and the quantity of Treasury coupon securities held by the private sector. If that quantity increases, such as on the days when Treasury coupon securities are issued, demand for repo borrowing also increases, putting upward pressure on repo rates.
On the supply side, MMFs' available cash to lend is determined by their assets under management (AUM). Thus, an increase in AUM leads to an increase in repo lending supply, which puts downward pressure on repo rates. Additionally, MMFs invest a significant portion of their portfolios in Treasury bills, which are close substitutes for their lending in repo markets. Therefore, if Treasury bill supply held by the private sector increases, MMFs have less cash available to lend in repo markets, putting upward pressure on repo rates.
To quantify these supply and demand dynamics and their effects on repo rates, we estimate Equation (1) daily between September 2014 and March 2026:5
$$$$ \Delta(TGCR-IORB)_t = \beta_0 + \beta_1(Net\ Bill\ Issuance_t) + \beta_2(Net\ Coupon\ Issuance_t) \\ + \beta_3(\Delta PD\ Treasury\ Holdings_{t-1}) + \beta_4(\Delta Gov.\ MMF\ AUM_{t-1}) \\ + \beta_5\left(\Delta\left({(Reserves+ONRRP)}{/}{GDP}\right)_{t-1}\right) + \varepsilon_t. \ (1)$$$$
TGCR − IORB is the spread between the tri-party general collateral rate (TGCR) and the interest rate on reserve balances (IORB), both available daily and measured in basis points. Net Treasury bill and coupon issuance and Fed liquidity—measured as the sum of reserves and overnight reverse repo (ON RRP) take-up—are daily and measured in billions of dollars. The Fed's balance sheet determines overall liquidity supply to the financial system. Since reserves and ON RRP represent cash held at the Fed by banks and non-banks, respectively, their sum measures aggregate Fed-provided liquidity to the private sector. Weekly values of primary dealers' net Treasury holdings and government MMF AUM, both measured in billions of dollars, are interpolated to daily values. We cluster standard errors by week to account for serial correlation.
The results are displayed in Table 1. The statistically significant coefficients on net Treasury coupon and bill issuance indicate that $100 billion of issuance results in increases in repo rates of 3.9 and 1.3 basis points, respectively. Increases in primary dealer Treasury holdings are also found to put upward pressure on rates, as expected, with an increase of $100 billion in primary dealer net Treasury holdings (and the resulting increase in repo demand) pushing up repo rates by about 6 basis points. Increases in government MMF AUM are negatively related to repo spreads, also as expected, although this result is only marginally significant, perhaps because increases in MMF AUM move more slowly and therefore may not affect daily changes in the repo rate. Finally, the results show that daily changes in the overall liquidity supply—that is, reserves plus ON RRP balances—do not directly affect repo spreads. While aggregate Fed liquidity represents the total "cash" available to the financial system, it does not determine how much cash is actually deployed into repo markets. This result is consistent with day-to-day repo market dynamics being driven primarily by dealer and MMF behavior rather than bank reserve demand or the aggregate quantity of Fed-supplied liquidity.
Table 1: Predictors of Changes in the Repo Rate
|
(1) $$ \Delta(TGCR-IORB)_t $$ |
|
|---|---|
| $$ {Net\ Bill\ Issuance_t} $$ | 0.013*** |
| (4.27) | |
| $$ {Net\ Coupon\ Issuance_t} $$ | 0.039*** |
| (5.6) | |
| $$ \Delta \textit{Primary Dealer Treasury Holdings}_{t-1} $$ | 0.056** |
| (2.55) | |
| $$ \Delta Gov.\ MMF\ AUM_{t-1} $$ | -0.031* |
| (-1.79) | |
| $$ \Delta ({(Reserves+ONRRP)}{/}{GDP})_{t-1} $$ | -164 |
| (-1.37) | |
| $$ \Delta (TGCR-IORB)_{t-1} $$ | -0.46*** |
| (-5.43) | |
| $$ \Delta (TGCR-IORB)_{t-2} $$ | -0.27*** |
| (-4.36) | |
| Observations | 2,902 |
| Adjusted $$R^2$$ | 0.2 |
This table shows the effect of net Treasury bill issuance, net Treasury coupon issuance, and lagged changes in primary dealer Treasury security holdings, government MMF assets under management, and Federal Reserve liquidity (reserves plus ON RRP) on daily changes in repo rates. The dependent variable is the daily change in the spread between TGCR and the IORB rate. The sample is September 2014 to March 2026. t-statistics in parentheses. Statistical significance: *** p ≤ .01, ** p ≤ .05, * p ≤ .10. Standard errors clustered by week.
Sources: Board of Governors; Federal Reserve Bank of New York; Daily Treasury Statement; iMoneyNet, Inc.; Money Fund Analyzer-Gold.
3. Balance Sheet Policy and Repo Market Dynamics
Next, we discuss how the Federal Reserve's balance sheet affects the repo market supply and demand dynamics that we explained above. When the Federal Reserve conducts balance sheet policy by changing its asset holdings, it directly affects both Treasury security holdings by the private sector and Federal Reserve liquidity.
A simplified example of this mechanism is shown in stylized T-accounts in Figure 1. When the Federal Reserve shrinks its balance sheet, it reduces its holdings of Treasury securities (yellow), leaving more Treasury securities that need to be held by the private sector, including by dealers. Dealers finance most of these increased holdings by borrowing in repo (green); thus, when the Fed shrinks its balance sheet, dealers' demand for repo borrowing increases as they purchase the increased supply of Treasury securities.
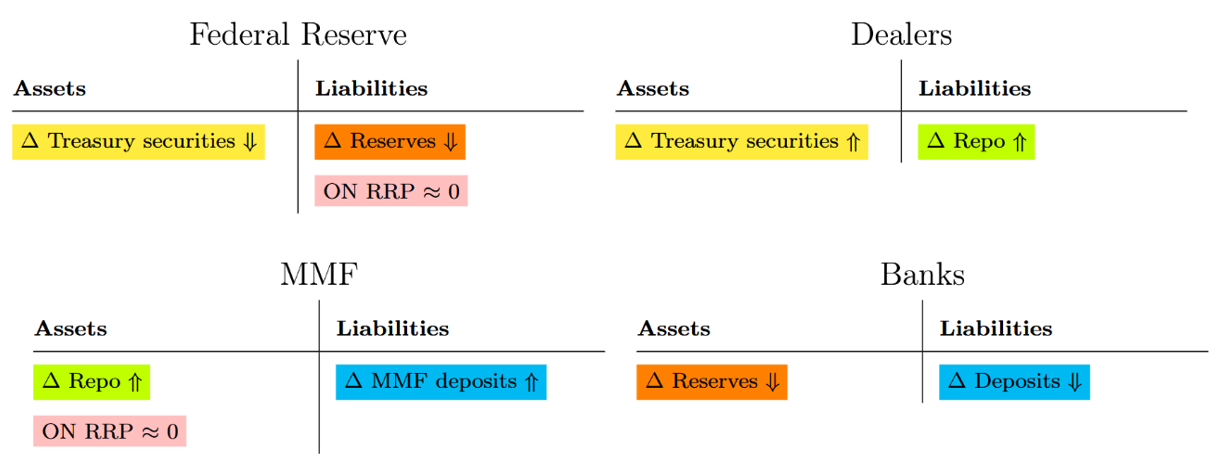
When ON RRP take-up is near zero (which is the scenario illustrated in Figure 1), MMFs—as the primary lenders in repo—need to attract new deposits away from banks (blue) in order to expand their repo lending. Correspondingly, bank deposits and reserve holdings decline (orange). In an alternative scenario with positive ON RRP take-up (which is not illustrated in the figure), MMFs with balances at the ON RRP will respond to the higher demand for repo borrowing by substituting ON RRP balances for repo market lending. In this case, reserves and bank balance sheets are unchanged. These dynamics establish a clear link between the size of the balance sheet (and, therefore, reserves) and repo market conditions.6
Given this mechanism, the Fed's balance sheet has important implications for repo rates. Figure 2 quantifies this relationship, displaying estimates of the effects of Treasury coupon and bill issuance on repo spreads from Equation (1) for five different levels of Fed liquidity, expressed as a percentage of GDP.
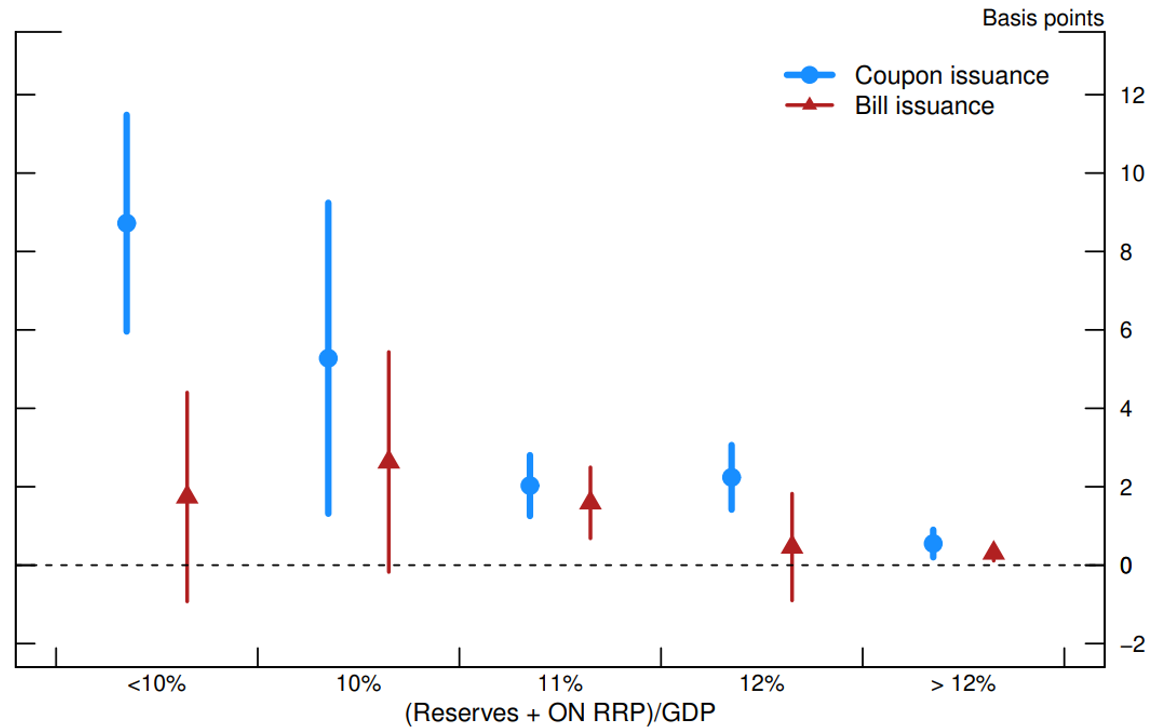
This figure shows the effect of $50 billion of net Treasury bill issuance or net Treasury coupon issuance on the TGCR-IORB spread for different levels of Federal Reserve liquidity (reserves plus ON RRP). The dots and triangles represent the regression coefficients and the bars represent the 95% confidence interval. Estimates are based on equation (1) for different liquidity levels, rounded to the closest percent. The regressions control for lagged changes in primary dealer Treasury security holdings, lagged changes in government MMF assets under management, and lagged changes in Federal Reserve liquidity. The sample is September 2014 to March 2026. Statistical significance: *** p ≤ .01, ** p ≤ .05, * p ≤ .10.
Sources: Board of Governors; Federal Reserve Bank of New York; Daily Treasury Statement; iMoneyNet, Inc., Money Fund Analyzer-Gold.
The estimated repo rate sensitivity to issuance is near zero, on average, when Federal Reserve liquidity is high relative to GDP but is positive at lower levels of liquidity. This relationship is particularly strong for net coupon issuance—$50 billion in net coupon issuance is associated with an increase in the TGCR-IORB spread of less than 1 basis point when aggregate liquidity is greater than 12 percent of nominal GDP but almost 10 basis points when aggregate liquidity is less than 10 percent of nominal GDP.7
The September 2019 repo spike provides a stark illustration of these dynamics in the low-liquidity regime. The Federal Reserve reduced the size of its balance sheet between October 2017 and August 2019, with ON RRP balances reaching levels near zero around May 2019. At this point, reserves were less than 9 percent of GDP—squarely in the lowest-liquidity range shown in Figure 2 where repo rates are highly sensitive to supply and demand shocks. In mid-September, both demand and supply shocks hit simultaneously. On the demand side, there was a $54 billion Treasury coupon settlement, which led to an increase in demand for repo borrowing. At the same time, on the supply side, money flowed out of banks and MMFs due to corporate tax payments, leaving less money to fund the increased demand in repo markets (Anbil et al., 2020; Copeland et al., 2025; Afonso et al., 2020). These shocks caused repo rates to spike well beyond what Figure 2's estimates would suggest—SOFR increased over 280 basis points to 5.25 percent. Moreover, as will be discussed in Section 4, these repo pressures transmitted to the federal funds market, with EFFR moving to 2.3 percent, 5 basis points above the top of the target range, highlighting how rapidly money market conditions can deteriorate when liquidity is scarce and multiple shocks occur simultaneously.
4. Transmission from repo to federal funds
While the Fed's balance sheet clearly affects repo rates, the implications for monetary policy implementation depend on whether these pressures remain contained in repo markets or spill over to the federal funds market—and therefore EFFR. While there is considerable segmentation between these two markets that limits arbitrage to some extent, these markets are still closely related. As the events of September 2019 showed, pressures in repo markets can transmit to EFFR, making repo market dynamics an important consideration for monetary policy implementation.
In contrast to the tri-party repo market, where primary dealers and MMFs are the main actors, commercial banks and Federal Home Loan Banks (FHLBs) are the main participants in the federal funds market, with FHLBs making up the vast majority of federal funds lending. The federal funds market is attractive for FHLBs because it allows them to deploy excess cash in the afternoon, when federal funds activity is concentrated. In contrast, repo markets are most liquid early in the morning, with activity decreasing in the afternoon. Nevertheless, FHLBs are active lenders in both markets and as such establish a link between them (Anderson and Na, 2024; Afonso and Lagos, 2015; Afonso et al., 2019).
Given that FHLBs have the option to lend in the repo market instead of the federal funds market, upward pressure on repo rates can spill over to the federal funds market as FHLBs can shift their lending from federal funds to repo markets when repo rates are more attractive, creating arbitrage pressure that pulls federal funds rates higher. Equation (2) estimates this relationship using daily data from September 2014 to March 2026:8
$$$$ \Delta(EFFR-IORB)_t = \beta_0 + \beta_1 (\Delta(TGCR-IORB))_t+ \\ \beta_2[ (\Delta(TGCR-IORB)_t) \times ({(Reserves+ONRRP)}{/}{GDP})_t]+ \\ \beta_3( {(Reserves+ONRRP)}{/}{GDP})_t+ \\ \beta_4( \Delta( {(Reserves+ONRRP)}{/}{GDP}))_t+ \varepsilon_t. (2) $$$$
The results, displayed in Table 2, show a small but highly significant positive relationship between TGCR and EFFR, evidence of spillover from the repo market to the federal funds market. Column 1 shows that a 1 basis point increase in TGCR leads to a 0.024 basis point increase in EFFR.9 In Columns 2 and 3, the negative coefficients on the interaction term suggest that this positive relationship is stronger at lower levels of aggregate liquidity. For example, based on Column 3 estimates, when liquidity is at 8 percent of GDP, a 1 basis point increase in TGCR leads to a 0.03 basis point increase in EFFR (0.092 - 0.75×0.08 = 0.032). At 12 percent of GDP, the effect is essentially zero. Three lags of ∆(TGCR-IORB), included in Column 3, are also positive and statistically significant, indicating that the effect of repo rates on EFFR can be persistent.
Table 2: The Effect of Repo on Federal Funds
| $$ \Delta(EFFR-IORB) $$ | |||
|---|---|---|---|
|
(1) Baseline |
(2) With Interaction |
(3) With Interaction & Lags |
|
| $$ \Delta(TGCR-IORB)_t $$ | 0.024*** | 0.070*** | 0.092*** |
| (6.9) | (2.44) | (3.39) | |
| $$ \Delta(TGCR-IORB)_{t-1} $$ | 0.041*** | ||
| (8.49) | |||
| $$ \Delta(TGCR-IORB)_{t-2} $$ | 0.020*** | ||
| (4.32) | |||
| $$ \Delta(TGCR-IORB)_{t-3} $$ | 0.0070*** | ||
| (2.18) | |||
| $$ \Delta(TGCR-IORB)_t \times ({(Reserves+ONRRP)}{/}{GDP})_t $$ | -0.68 | -0.75* | |
| (-1.54) | (-1.75) | ||
| $$ \Delta({(Reserves+ONRRP)}{/}{GDP})_t $$ | 56.6** | 54.5** | 48.7** |
| (2.32) | (2.25) | (2.01) | |
| $$ ({(Reserves+ONRRP)}{/}{GDP})_t $$ | -0.56 | -0.61 | |
| (-1.34) | (-1.60) | ||
| $$ (EFFR-IORB)_{t-1} $$ | -0.53*** | -0.53*** | -0.57*** |
| (-9.01) | (-9.06) | (-13.75) | |
| $$ (EFFR-IORB)_{t-2} $$ | -0.23*** | -0.23*** | -0.27*** |
| (-5.21) | (-5.34) | (-8.01) | |
| Observations | 2738 | 2738 | 2737 |
| Adjusted $$R^2$$ | 0.44 | 0.44 | 0.49 |
This table shows the effect of daily changes in the repo rate TGCR (in basis points) and Federal Reserve liquidity (scaled by GDP, as a percent) on daily changes in EFFR (in basis points). The sample is September 2014 to March 2026. t-statistics in parentheses. Month-ends are excluded. Statistical significance: *** p ≤ .01, ** p ≤ .05, * p ≤ .10.
Sources: Board of Governors, Federal Reserve Bank of New York.
5. Factors Affecting the Link between the Fed's Balance Sheet and the Repo Market
The strength of the link between the Fed's balance sheet and repo markets depends on several structural and policy factors. Below, we discuss four key factors that can amplify or dampen this relationship.
The level of the policy rate. As Anbil et al. (2024) show, the level of the policy rate plays a crucial role for the capacity of the repo market through its effect on MMF assets. Xiao (2020) and Drechsler et al. (2017) show that increases in the policy rate transmit to MMF yields more fully than to bank deposit rates, making MMF shares relatively more attractive to hold than bank deposits in a higher interest rate environment. Thus, with a higher policy rate, money moves from banks to MMFs. Anbil et al. (2024) relate these dynamics to the repo market. As higher rates encourage flows from bank deposits to MMFs, MMF AUM increases, meaning that the capacity of MMFs to lend in the repo market increases, indicating that overall liquidity conditions may change with the level of the policy rate. The capacity of MMFs to lend in repo may also be affected by their expectations of policy rate changes as MMFs tend to adjust their weighted average-maturities based on their expectations by adjusting their bill portfolio (see Im et al., 2023 and Abdullah and Tase, 2025).
Federal Reserve purchases of Treasury bills. In addition to the level of rates, the composition of Fed asset holdings also matters. As discussed above, Treasury bills are a primary investment option for MMFs and therefore bill supply directly affects MMFs' capacity to lend in repo markets.10 In December 2025, the Federal Open Market Committee (FOMC) announced the start of reserve management purchases of Treasury bills to maintain a supply of ample reserves.11 These purchases inject reserves while simultaneously reducing bill supply available to MMFs, thereby easing pressure on repo rates. Through mid-April, these reserve management purchases have totaled about $120 billion, Treasury bills held by the private sector have declined and, in part because MMFs have consequently shifted money from Treasury bills to repo lending, repo rates have also declined several basis points.
Regulation. Regulations that constrain dealer capacity, such as the supplementary leverage ratio (SLR), affect how much intermediation dealers can provide at any given size of the Fed's balance sheet. This is especially important in the centrally cleared segment of the repo market, where dealers lend out cash to hedge funds and other institutions. The existing literature has examined how changes to these regulations might affect repo market dynamics and the level of reserves needed to maintain control over short-term rates (see He et al., 2022; Bräuning and Stein, 2026; Chabot et al., 2024; Anderson et al., 2026; Logan and Schulhofer-Wohl, 2026; and Duffie, 2026)
Standing repo operations. Finally, the Federal Reserve has tools to manage repo market pressures—in particular, standing repo operations (SRP), in which dealers and banks can borrow in a repo transaction from the Fed. Usage of these operations helps limit upward pressures on repo rates.
6. Conclusion
The Federal Reserve's balance sheet is tightly linked to repo markets, as overall Fed liquidity supply affects borrowing demand by dealers and hedge funds and available funds to lend by MMFs. FHLB arbitrage between the repo and federal funds markets can lead to spillovers of repo market pressures to the federal funds market, directly affecting the Fed's policy rate. This mechanism makes repo market dynamics an important source of information about overall liquidity conditions in the financial system. The September 2019 episode demonstrated how quickly pressures in repo markets can build and affect the federal funds market when liquidity is scarce. Monitoring repo market conditions therefore complements other indicators of reserve ampleness in assessing the effect of the Fed's balance sheet policy on money markets.12
References
Abdullah, Samin, and Manjola Tase, 2025, Policy rate uncertainty and money market funds (MMF) portfolio allocations, Finance and Economics Discussion Series. Washington: Board of Governors of the Federal Reserve System 2025-063.
Acharya, Viral V, Rahul S Chauhan, Raghuram Rajan, and Sascha Steffen, 2023, Liquidity dependence and the waxing and waning of central bank balance sheets, Working Paper 31050, National Bureau of Economic Research.
Afonso, Gara, Roc Armenter, and Benjamin Lester, 2019, A model of the federal funds market: yesterday, today, and tomorrow, Review of Economic Dynamics 33, 177–204.
Afonso, Gara, Kevin Clark, Brian Gowen, Gabriele La Spada, JC Martinez, Jason Miu and Will Riordan, 2024, A new set of indicators for reserve ampleness, Federal Reserve Bank of New York Liberty Street Economics, August 14, 2024.
Afonso, Gara, Marco Cipriani, Adam Copeland, Anna Kovner, Gabriele La Spada, and Antoine Martin, 2020, The market events of mid-September 2019, Staff report, Federal Reserve Bank of New York.
Afonso, Gara, Domenico Giannone, Gabriele La Spada, and John C Williams, 2026, Scarce, abundant, or ample? A time-varying model of the reserve demand curve, Journal of Finance, forthcoming.
Afonso, Gara, and Ricardo Lagos, 2015, Trade dynamics in the market for federal funds, Econometrica 83, 263–313.
Afonso, La Spada Gabriele, Gara, Thomas M. Mertens, and John C. Williams, 2023, The optimal supply of central bank reserves under uncertainty, Federal Reserve Bank of New York Staff Report 1077.
Anbil, Sriya, Alyssa Anderson, Ethan Cohen, and Romina Ruprecht, 2024, Beyond Reserves: The Federal Reserve's Balance Sheet and the Repo Market, Finance and Economics Discussion Series. Washington: Board of Governors of the Federal Reserve System 2026-041
Anbil, Sriya, Alyssa Anderson, Marco Macchiavelli, and Andy Xia, 2026, Treasury financing by hedge funds: A tale of three channels, Working Paper, SSRN.
Anbil, Sriya, Alyssa Anderson, and Zeynep Senyuz, 2020, What happened in money markets in September 2019?, FEDS Notes. Washington: Board of Governors of the Federal Reserve System, February 27, 2020.
Anderson, Alyssa, Alessandro Barbarino, Anthony M. Diercks, and Stephen Miran, 2026, A user's guide to reducing the Federal Reserve's balance sheet, Finance and Economics Discussion Series 2026-019.
Anderson, Alyssa, and Dave Na, 2024, The recent evolution of the federal funds market and its dynamics during reductions of the Federal Reserve's balance sheet, FEDS Notes. Washington: Board of Governors of the Federal Reserve System, July 11, 2024.
Bräuning, Falk, and Hillary Stein, 2026, The effect of primary dealer constraints on intermediation in the Treasury market, The Review of Financial Studies.
Cenicola, Ashlyn, Melanie Friedrichs, Robert Mann, and Luke M. Olson, 2025, Sizing the U.S. repo market, Working paper, OFR.
Chabot, Lia, Paul Cochran, Sebastian Infante, and Benjamin Iorio, 2024, Dealer balance sheet constraints evidence from dealer-level data across repo market segments, FEDS Notes. Washington: Board of Governors of the Federal Reserve System, September 23, 2024.
Clouse, James A., Sebastian Infante, and Zeynep Senyuz, 2025, "Market-based indicators on the road to ample reserves," FEDS Notes. Washington: Board of Governors of the Federal Reserve System, January 31, 2025.
Copeland, Adam, Darrell Duffie, and Yilin Yang, 2025, Reserves were not so ample after all, The Quarterly Journal of Economics 140, 239–281.
Cordes, Lucy, and Sebastian Infante, 2025, Repo rate sensitivity to treasury issuance and quantitative tightening, FEDS Notes. Washington: Board of Governors of the Federal Reserve System, February 12, 2025.
d'Avernas, Adrien, Damon Petersen, and Quentin Vandeweyer, 2024, The central bank's balance sheet and Treasury market disruptions, Swedish House of Finance Research Paper No. 24-48.
d'Avernas, Adrien, and Quentin Vandeweyer, 2024, Treasury bill shortages and the pricing of short-term assets, The Journal of Finance 79, 4083–4141.
Drechsler, Itamar, Alexi Savov, and Philipp Schnabl, 2017, The deposits channel of monetary policy, The Quarterly Journal of Economics 132, 1819–1876.
Duffie, Darrell, 2026, The payment system puts a floor in the Fed's balance sheet, Brookings Papers on Economic Activity.
He, Zhiguo, Stefan Nagel, and Zhaogang Song, 2022, Treasury inconvenience yields during the COVID-19 crisis, Journal of Financial Economics 143, 57–79.
Hempel, Sam, R. Jay Kahn, and Julia Shephard, 2025, The $12 trillion US repo market: Evidence from a novel panel of intermediaries, FEDS Notes. Washington: Board of Governors of the Federal Reserve System, July 11, 2025.
Im, Jay, Yi Li, and Ashley Wang, 2023, Investor flows, monetary policy, and portfolio management of money market funds, Working Paper, SSRN.
Lagos, Ricardo, and Gastón Navarro, 2023, Monetary policy operations: Theory, evidence, and tools for quantitative analysis, NBER Working Paper No. 31370.
Logan, Lorie, and Sam Schulhofer-Wohl, 2026, Options for reducing the size of the Fed's balance sheet, Working paper, Federal Reserve Bank of Dallas.
Lopez-Salido, David, and Annette Vissing-Jorgensen, 2023, Reserve demand, interest rate control, and quantitative tightening, Working Paper.
Xiao, Kairong, 2020, Monetary transmission through shadow banks, The Review of Financial Studies 33, 2379–2420.
Yang, Yilin David, 2020, What quantity of reserves is sufficient?, Working Paper, SSRN.
1. The views expressed here are solely those of the authors and should not be interpreted as reflecting the views of the Board of Governors, its staff, or anyone associated with the Federal Reserve System. Return to text
2. For analysis on how this constraint affects the size of the Federal Reserve's balance sheet, see Lopez-Salido and Vissing-Jorgensen (2023), Copeland et al. (2025), Afonso et al. (2023), Afonso et al. (2026), Lagos and Navarro (2023), Yang (2020), and Acharya et al. (2023), among others. Return to text
3. See Cenicola et al. (2025) for more detail on the size of the US repo market. Return to text
4. See, for example, Anbil et al., 2024, 2026; Cordes and Infante, 2025; Hempel et al., 2025; d'Avernas et al., 2024; d'Avernas and Vandeweyer, 2024. Return to text
5. We begin our sample in September 2014 since it is the first complete month for which TGCR data is available. Return to text
6. Duffie (2026), Anderson et al. (2026), and Logan and Schulhofer-Wohl (2026) also highlight the importance of repo markets for the size of the Fed's balance sheet. Return to text
7. See Cordes and Infante (2025) for more detail on the relationship between Federal Reserve liquidity and repo rate sensitivity to Treasury issuance. Return to text
8. We exclude month-ends from the regression since, for the first several years of our sample, EFFR dropped significantly on month-ends given window dressing behavior by foreign banks. Return to text
9. This effect is very small given the stability of EFFR. For example, the EFFR-IORB spread has been -1 basis point every day from December 2025 through late April 2026, while the TGCR-IORB spread has ranged over 25 basis points. Return to text
10. Unlike Treasury coupons, Treasury bills are typically not financed in the repo market, so the channel through which bills affect repo—MMF lending capacity—is different than the channel for coupons. Return to text
11. See the December 2025 Implementation note (PDF). Return to text
12. See Afonso et al. (2024) and Clouse et al. (2025) for a description of other indicators of reserve ampleness. Return to text
Anbil, Sriya, Alyssa Anderson, Lucy Cordes, and Romina Ruprecht (2026). "Repo Markets and the Fed’s Balance Sheet: Implications for Monetary Policy Implementation," FEDS Notes. Washington: Board of Governors of the Federal Reserve System, August 26, 2026, https://doi.org/10.17016/2380-7172.4069.
Disclaimer: FEDS Notes are articles in which Board staff offer their own views and present analysis on a range of topics in economics and finance. These articles are shorter and less technically oriented than FEDS Working Papers and IFDP papers.