FEDS Notes
February 12, 2019
Residual Seasonality in Core Consumer Price Inflation: An Update
Ekaterina Peneva and Nadia Sadée
Please note that the analysis below was completed before the Bureau of Labor Statistics published the updated CPI seasonal factors on February 11, 2019.
In July of 2018, the Bureau of Economic Analysis (BEA) released the results of its 15th comprehensive update of the National Income and Product Accounts (NIPAs). These periodic comprehensive updates allow the BEA to introduce various improvements to its measurement methodologies and one major initiative of the latest comprehensive update was an improvement of the seasonal adjustments in the NIPAs. In particular, the BEA extensively reviewed and made improvements to the seasonal adjustment of the gross domestic product (GDP) components.1 The BEA also produces the Personal Consumption Expenditure (PCE) price index and several recent studies on consumer price inflation note that we tend to see a pattern in which the pace of core (i.e. excluding food and energy) inflation slows down from the first to the second half of the year.2 The tendency for a time series to manifest a predictable seasonal pattern despite being seasonally adjusted is often referred to as "residual seasonality." While we are not aware of any explicit changes that the BEA has made to address residual seasonality in PCE prices during the 2018 comprehensive update, the BEA routinely updates their seasonal factors and procedures and has been seasonally adjusting more components of the PCE price index over time. For this reason, we take another look at residual seasonality in several measures of core inflation.
In this note, we use both real-time and current-vintage (i.e. the latest available historical data) for 2003-2017 to update and extend many of the results documented in Peneva (2014). In real time, inflation in the first half of the year has come in higher than in the second half of the year in 11 of the past 15 years when inflation is measured by the core consumer price index (CPI) and the core PCE price index (see real-time data panels in Figures 1 and 2). Market-based core PCE price inflation has been higher in the first half of the year in 12 of the past 15 years (see real-time data panel in Figure 3). In the current-vintage data, the pattern for core CPI changes noticeably, with just less than half the years showing inflation higher in the first half of the year (see current-vintage panel in Figure 1). For core PCE and market-based core PCE inflation, the pattern changes only slightly, with 10 of the past 15 years showing inflation higher in the first half of the year (see current-vintage panels in Figures 2 and 3). Given the changes the BEA has been making to the seasonal adjustment procedures, we think it is important to focus more on the revised historical data released during this year's comprehensive update. That said, we also think it is very important to monitor whether any improvements in the seasonal adjustment procedures translate into reduced residual seasonality in real-time data.
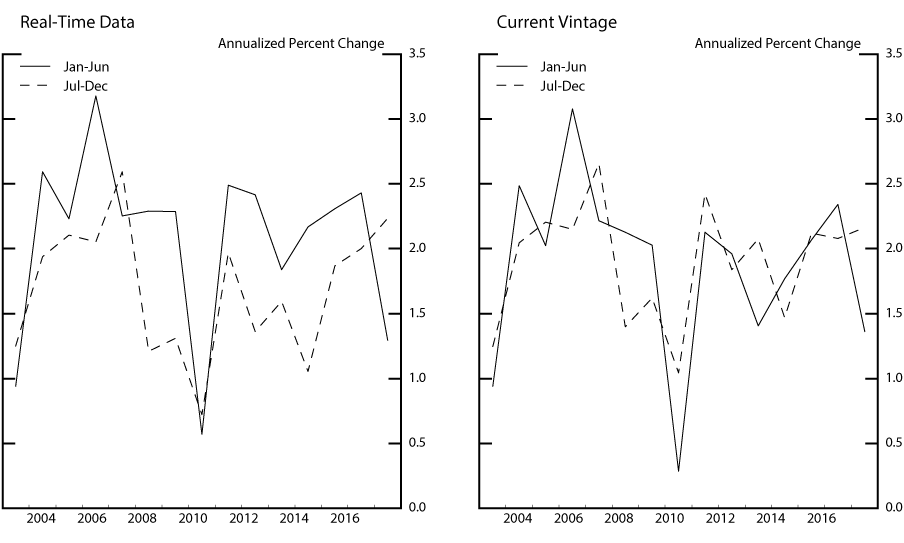
Source: Authors' calculations using data from the Bureau of Labor Statistics.
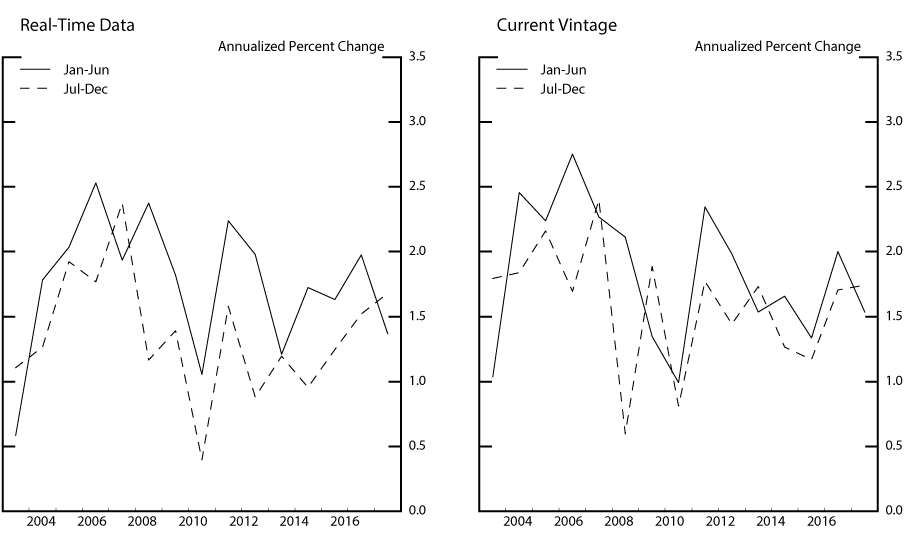
Source: Authors' calculations using data from the Bureau of Economic Analysis.
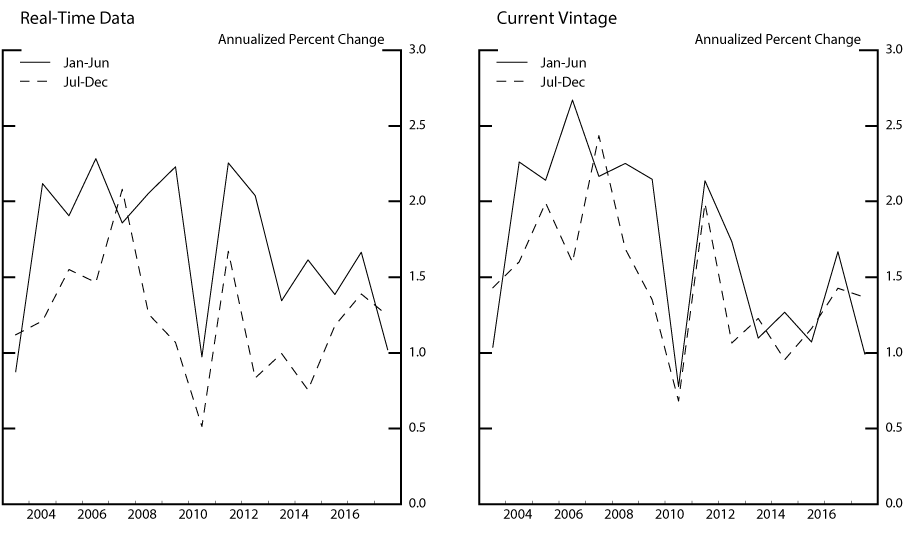
Source: Authors' calculations using data from the Bureau of Economic Analysis.
Table 1 shows the average deviations in the annualized three-month inflation rate from the inflation rate for the year as a whole for three price measures: the core CPI, the core PCE price index, and the core market-based PCE price index. The table covers the past 15 years and shows results based on both real-time and current-vintage data.3 (By construction, the deviations sum to zero in a given year and on average across the years.4)
Table 1: Average Difference Between the Annualized Three-Month Inflation Rate and the Inflation Rate for the Year as a Whole, 2003 to 2017 (Percentage Points)
| Core CPI | Core PCE | Core Market-based PCE | ||||
|---|---|---|---|---|---|---|
| Real-Time Data | Current Vintage | Real-Time Data | Current Vintage | Real-Time Data | Current Vintage | |
| Jan-Mar | 0.16 | 0.10 | 0.22 | 0.18 | 0.29* | 0.23* |
| Apr-Jun | 0.24 | -0.12 | 0.17 | 0.06 | 0.20 | 0.00 |
| Jul-Sep | -0.15 | 0.03 | -0.23* | -0.15* | -0.12 | -0.09 |
| Oct-Dec | -0.25 | -0.01 | -0.16 | -0.09 | -0.36* | -0.14 |
* Statistically significant at the 10 percent level. Return to text
Source: Authors' calculations using data for CPI from the Bureau of Labor Statistics and data for PCE from the Bureau of Economic Analysis.
Similar to Figure 1, the first two columns in Table 1 illustrate that the pattern of higher-than-average core CPI in the first half of the year visible in the real-time data largely disappears after the seasonal adjustment factors (SAF) are revised. All three-month changes show smaller absolute deviations from the year average but the effect of the SAF revisions is especially noticeable in April-June.
For core and market-based core PCE inflation, however, even in the current-vintage data there is some evidence of residual seasonality. On average, over the past 15 years core PCE and market-based core PCE inflation have been about 1/4 percentage point higher in the first half of the year than in the second (see current-vintage columns in Table 1). In real-time data, the difference is bigger--0.4 percentage point and 0.5 percentage point for core PCE inflation and market-based core PCE inflation, respectively. These results are mainly driven by higher-than-average three-month changes in the very beginning of the year though higher-than-average April-June inflation also contributes to higher inflation in the first half of the year in real-time data. Both the third and the fourth three-month changes of the year contribute to the lower-than-average second half of the year. Of the average deviations in the three-month changes in core PCE inflation, the only ones that are statistically different from zero (at the 10 percent level) are the three-month changes through September. As for market-based core PCE inflation, the average deviations in the three-month changes through March as well as the three-month changes through December in the real-time data are statistically different from zero.
For quarterly inflation rates--that is, the annualized percent change in the quarterly average price level--many of the differences in the three-month changes average out, and as a result, the evidence for residual seasonality is both economically and statistically less significant (see Table 2). The real-time data imply that the annualized rate of core CPI and core PCE inflation tends to pick up 1/4 percentage point between the fourth and the first quarter of the year. In the current-vintage data, the pick-up is much less notable for core PCE and there is no pick up in core CPI.
Table 2: Average Difference Between the Annualized Quarterly Inflation Rate and the Inflation Rate for the Year as a Whole, 2003 to 2017 (Percentage Points)
| Core CPI | Core PCE | Core Market-based PCE | ||||
|---|---|---|---|---|---|---|
| Real-Time Data | Current Vintage | Real-Time Data | Current Vintage | Real-Time Data | Current Vintage | |
| Q1 | 0.02 | 0.02 | 0.14 | 0.07 | 0.12 | 0.11 |
| Q2 | 0.17 | -0.08 | 0.08 | 0.08 | 0.11 | 0.00 |
| Q3 | 0.03 | 0.02 | -0.11 | -0.13 | 0.00 | -0.07 |
| Q4 | -0.22 | 0.04 | -0.11 | -0.02 | -0.23* | -0.03 |
* Statistically significant at the 10 percent level. Return to text
Source: Authors' calculations using data for CPI from the Bureau of Labor Statistics and data for PCE from the Bureau of Economic Analysis.
It remains difficult to tie the pattern in the three-month changes to particular subcomponents of the price indexes. Using current-vintage data, Table 3 decomposes the deviations of the three-month changes in the core PCE price index into the contributions of various sub aggregates. (These contributions are calculated using current PCE shares.) Within the market-based category, the contributions to the average deviation in the first three months of the year from goods and services are about 2/3 and 1/3, respectively, despite the much larger weight of services in consumption. Looking into more detailed categories, durable goods, non-durable goods, and medical services prices each contribute about 1/3 to the average deviation in the first three months of the year. Most of the contribution to above average goods price inflation in the first three months of the year is offset by lower-than-average contribution in the last three months. The non-market component of the core PCE price index explains half of the lower-than-average three-month change through September.
Table 3: Contributions to Deviations from Annual Core PCE Inflation
Current-Vintage Data, 2003 to 2017
| Jan-Mar | Apr-Jun | Jul-Sep | Oct-Dec | |
|---|---|---|---|---|
| Core PCE | 0.18 | 0.06 | -0.15 | -0.09 |
| Market-based core | 0.19 | 0.00 | -0.08 | -0.12 |
| Market-based core goods | 0.13 | 0.00 | -0.03 | -0.10 |
| Durable | 0.06 | 0.01 | -0.06 | 0.00 |
| Excluding motor vehicles | 0.07 | 0.00 | -0.05 | -0.02 |
| Nondurable | 0.07 | -0.01 | 0.03 | -0.10 |
| Apparel | 0.02 | -0.01 | 0.01 | -0.02 |
| Tobacco | 0.02 | 0.01 | -0.01 | -0.02 |
| Market-based core services | 0.07 | 0.01 | -0.05 | -0.03 |
| Housing | 0.00 | 0.00 | 0.00 | 0.00 |
| Accommodations | 0.00 | -0.01 | -0.01 | 0.01 |
| Medical | 0.05 | -0.02 | -0.03 | 0.00 |
| Food | 0.00 | 0.02 | 0.00 | -0.02 |
| Airfares | 0.00 | -0.01 | -0.01 | 0.02 |
| Other | 0.02 | 0.04 | -0.01 | -0.05 |
| Non-market based core | -0.01 | 0.05 | -0.07 | 0.03 |
Source: Authors' calculations using data from the Bureau of Economic Analysis.
Concluding Remarks
Table 4 compares the deviations in the three-month PCE inflation rates over the 15 years ending in 2017 right before and immediately following the 2018 comprehensive update. Similar to the pattern observed in the data before the comprehensive update, current-vintage inflation in the first half of the year exceeds, on average, inflation in the second half but the step down from the first to the second half of the year is now slightly smaller. Given that 15 years is a fairly short time span for this analysis, we are cautious in drawing strong conclusions. We understand that the patterns we observe might be merely the result of chance and idiosyncratic price movements in particular categories. That said, we continue to believe that keeping the observed pattern in mind is helpful when interpreting high-frequency consumer price data.
Table 4: Average Difference Between the Annualized Three-Month Inflation Rate and the Inflation Rate for the Year as a Whole, 2003 to 2017 (Percentage Points)
Before and After the Comprehensive Update
| Core PCE | Core Market-based PCE | |||
|---|---|---|---|---|
| After Comp Update | Before Comp Update | After Comp Update | Before Comp Update | |
| Jan-Mar | 0.18 | 0.19* | 0.23* | 0.27* |
| Apr-Jun | 0.06 | 0.11 | 0.00 | 0.02 |
| Jul-Sep | -0.15* | -0.10 | -0.09 | -0.08 |
| Oct-Dec | -0.09 | -0.19 | -0.14 | -0.21 |
* Statistically significant at the 10 percent level. Return to text
Source: Authors' calculations using data for CPI from the Bureau of Labor Statistics and data for PCE from the Bureau of Economic Analysis.
References
Cowan, Benjamin, Shelly Smith, and Sarahelen Thompson (2018). "Seasonal Adjustment in the National Income and Product Accounts: Results from the 2018 Comprehensive Update," Survey of Current Business 98 (August 2018).
Kelly, Pamela A., Stephanie H. McCulla, and David B. Wasshausen (2018). "Improved Estimates of the National Income and Product Accounts: Results of the 2018 Comprehensive Update," Survey of Current Business 98 (September 2018).
Macroeconomic Advisers (2007). "Residual Seasonality in Core Consumer Price Measures," Macroeconomic Advisers' Macro Focus (March 5, 2007, volume 2, number 3).
Macroeconomic Advisers (2011). "To What Extent is Residual Seasonality Responsible for the Recent Upturn in Core Inflation?" Macroeconomic Advisers' Macro Focus (June 24, 2011, volume 6, number 7).
Peneva, Ekaterina (2014). "Residual Seasonality in Core Consumer Price Inflation," FEDS Notes, October 14, 2014. Board of Governors of the Federal Reserve System (U.S.).
Rudebusch, Glenn D., Daniel J. Wilson, and Benjamin Pyle (2015). "Residual Seasonality and Monetary Policy," FRBSF Economic Letter. Federal Reserve Bank of San Francisco. August 24, 2015.
1. For details, see Cowan, Smith, and Thompson (2018) and Kelly, McCulla, and Wasshausen (2018). Return to text
2. For example, see the Macro Focus articles by Macroeconomic Advisers (2007, 2011). For a more recent analysis, see Peneva (2014) and Rudebusch et al. (2015). Return to text
3. To obtain real-time CPI data for a given year, we used the published seasonally adjusted CPI estimates that were available in January of the following year. (Each year, the BLS recalculates the seasonal adjustment factors to reflect price movements from the just-completed calendar year and releases them along with the January CPI numbers in February; these routine calculations can result in revisions to the past five years' worth of seasonally adjusted CPI data.) The PCE price indexes are also revised every year, with revisions resulting from the incorporation of newly available and revised source data (including any revisions to the source data's seasonal factors) and from revisions to the weights used to compute the indexes. For the real-time PCE price data, we use the estimates that were available just prior to any annual or comprehensive revisions (these revisions typically take place in the summer). Return to text
4. An annual inflation rate in this memo is defined as the arithmetic average of the annualized inflation rates for the four three-month sub-periods and can therefore differ slightly from the December-over-December inflation rate. Return to text
Peneva, Ekaterina, and Nadia Sadée (2019). "Residual Seasonality in Core Consumer Price Inflation: An Update," FEDS Notes. Washington: Board of Governors of the Federal Reserve System, February 12, 2019, https://doi.org/10.17016/2380-7172.2318.
Disclaimer: FEDS Notes are articles in which Board staff offer their own views and present analysis on a range of topics in economics and finance. These articles are shorter and less technically oriented than FEDS Working Papers and IFDP papers.