FEDS Notes
April 03, 2017
Robustness of long-maturity term premium estimates
Canlin Li, Andrew Meldrum and Marius Rodriguez
Introduction
In order to shed light on the reasons for movements in Treasury yields, we often decompose yields into the expected path of the federal funds rate and an additional term premium, which compensates investors in long-term bonds for interest rate risk. Unfortunately, this decomposition cannot be inferred directly from market prices and we need to estimate it using econometric models. As highlighted in recent commentary by the FT,1 there is a degree of uncertainty about both the best model to use for these purposes and about how best to estimate a model's parameters.
This Note explains the differences between two of the models used to produce estimates of US Treasury term premiums which are produced by staff in the Federal Reserve System. The first is a model developed by Kim and Wright (2005) (KW hereafter) that has been referred to in materials prepared for the FOMC meeting.2 The other is the model developed at the Federal Reserve Bank of New York by Adrian, Crump and Moench (2013) (ACM). The structures of these models are very similar but Figure 1 shows that their long-maturity term premium estimates can nevertheless differ materially at times. Analysis in this Note suggests that the main reason for the divergence between model estimates is that KW incorporate Blue Chip surveys of professional forecasters' short rate expectations in the data set used to estimate the model; once we modify the ACM model to include these surveys, term premium estimates are very similar to the KW estimates.
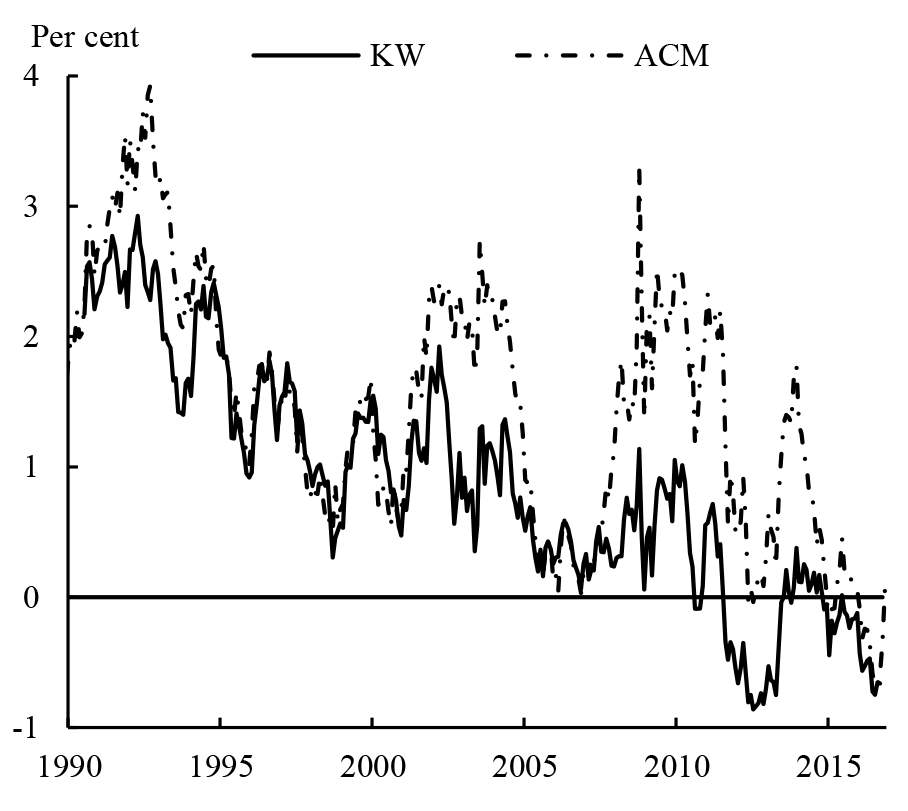
One advantage of including surveys is that this can address some of the small-sample problems associated with estimating term structure models. The high persistence of Treasury yields means that it is hard to estimate the level to which short-term interest rates will eventually revert or the speed of mean reversion from yields alone, which can result in substantial estimation uncertainty and – as noted by the FT piece referred to above – estimates of term premiums can be sensitive to the choice of sample period. Surveys can provide the model with more information about short-term interest rate expectations, thereby increasing the precision of term premium estimates and making them less sensitive to the choice of sample period.
That is not to say that the more precise estimates from models that include surveys are necessarily 'better' estimates: it is possible that surveys do not provide good measures of the expectations of market participants. If that is the case, one might prefer an imprecise estimate from a model that omits surveys to a precise but biased estimate. Ultimately, however, further work to evaluate a wider range of models against a wider range of criteria would be helpful to move the discussion forward.
Given the substantial model and (in some cases) parameter uncertainty involved with estimating dynamic term structure models, it is worth bearing in mind that while some features of estimated term premiums appear to be fairly robust across models (e.g. long-maturity term premium estimates from the models considered in this Note are all low by historical standards), other features (such as the sign and volatility of term premiums), are less robust.
Why do estimates of term premia differ?
The KW and ACM models published by the Federal Reserve System have much in common. They both belong to the class of so-called 'dynamic no-arbitrage affine term structure models' (ATSMs) of Duffie and Kan (1996) and Duffee (2002). In these models, bond yields are driven by a small number of 'pricing factors' – which are affine (i.e. linear) combinations of yields, such as principal components3 – and which evolve over time according to a vector autoregressive (VAR) process. The short-term risk-free interest rate (which we can think of as a proxy for the federal funds rate) is modelled as a linear function of the pricing factors. Longer-term yields are also linear functions of the pricing factors; and the parameters that determine the relationship between the pricing factors and yields are restricted to ensure the absence of arbitrage opportunities (e.g. the ten-year yield has to equal the average of the five-year yield and the five-year, five-year forward rate or there would be an arbitrage opportunity).
Given estimates of the model parameters, we can compute term premiums as the difference between the model-implied fitted yield (which is usually very close to the actual data) and the model-implied average expected future short-term interest rate over the relevant horizon, which is easily computed by forecasting the VAR of pricing factors.4 In these models, interest rate distributions are Normal (and therefore symmetric), so they do not impose a lower bound on nominal interest rates. Other models (such as the shadow rate approach proposed by Black (1995)) are likely to be more appropriate for analyzing term premiums at short maturities during recent years. In this FEDS Note we therefore focus on term premiums at a ten-year horizon, which should be less affected by the lower bound (Kim and Priebsch (2013)).
Table 1 (at the end of this Note) summarizes the differences between KW and ACM. First, the econometric techniques used to estimate the models are very different. KW (like most of this term structure literature) uses maximum likelihood to estimate all the parameters of the model in one go. While maximum likelihood is statistically efficient, it is numerically very challenging because of the large number of parameters to estimate, some of which are quite weakly identified. The method proposed by ACM splits up the estimation into multiple linear regressions, which is computationally much faster.5
Second, KW and ACM use Treasury yields differently: they use yields of different maturities; have different factor specifications; are estimated using different frequency data (ACM uses monthly data; KW uses weekly data); and make different choices of sample period (ACM use a sample starting in June 1961; KW in July 1990). Third, ACM is estimated using only data on Treasury yields while KW also uses data on Blue Chip survey expectations of future short-term interest rates in addition to yields (note that the KW model is not constrained to match the survey expectations exactly; rather, it allows for them to be measured with error).
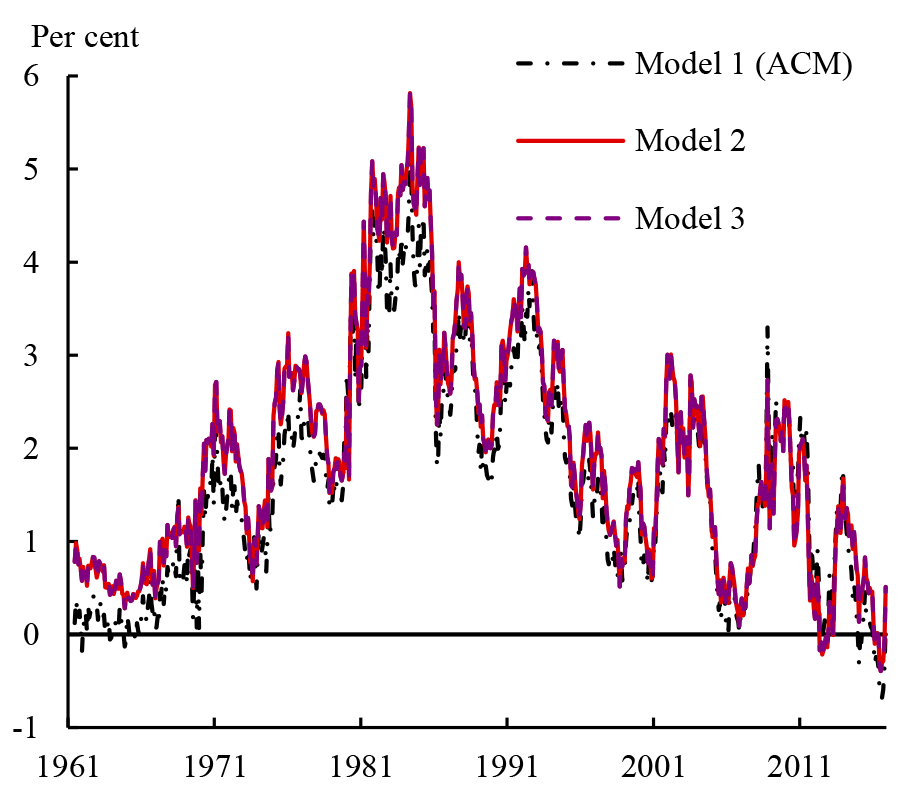
To investigate which of these differences contributed to the diverging term premium estimates in Figure 1, we estimate three variations of ACM that are estimated using only monthly data on Treasury yields (shown in Figure 2):
- the ACM estimates from a five-factor model published by the NY Fed;
- a (more standard) three-factor model estimated using the ACM multi-step regression method; and
- a three-factor model estimated using maximum likelihood;
as well as three variations of KW that also incorporate surveys in the data set (shown in Figure 3):
- the three-factor KW model estimates using weekly data published by the Board;
- a three-factor model using monthly data estimated using an extension of the ACM method that allows us to incorporate surveys;6 and
- a three-factor model estimated using maximum likelihood (i.e. very similar to KW) but using monthly data.
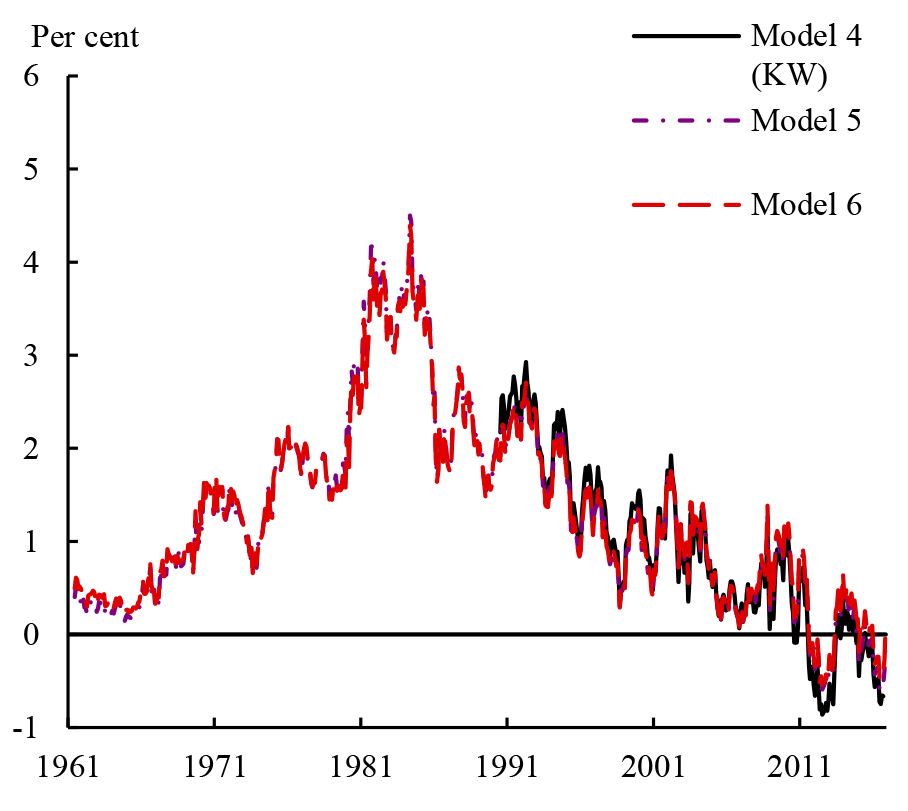
Table 1 provides further details on the models. All are estimated using end-month data since June 1961 with the exception of Model 4 (the published KW estimates), which uses weekly data from July 1990. All except Model 1 (the published ACM estimates) use three principal components of yields as pricing factors.1 Models 5 and 6 include the same set of surveys as KW, which are from Blue Chip and are incorporated in the estimation from 1983.
We have three main findings: first, whether or not surveys are used in the estimation seems to be the most important factor in explaining the differences in ten-year term premium estimates. Estimates from the models without surveys are for the most part very similar to the ACM estimates, particularly since the mid-1980s; while estimates from the models that include surveys are almost identical to the KW estimates.7
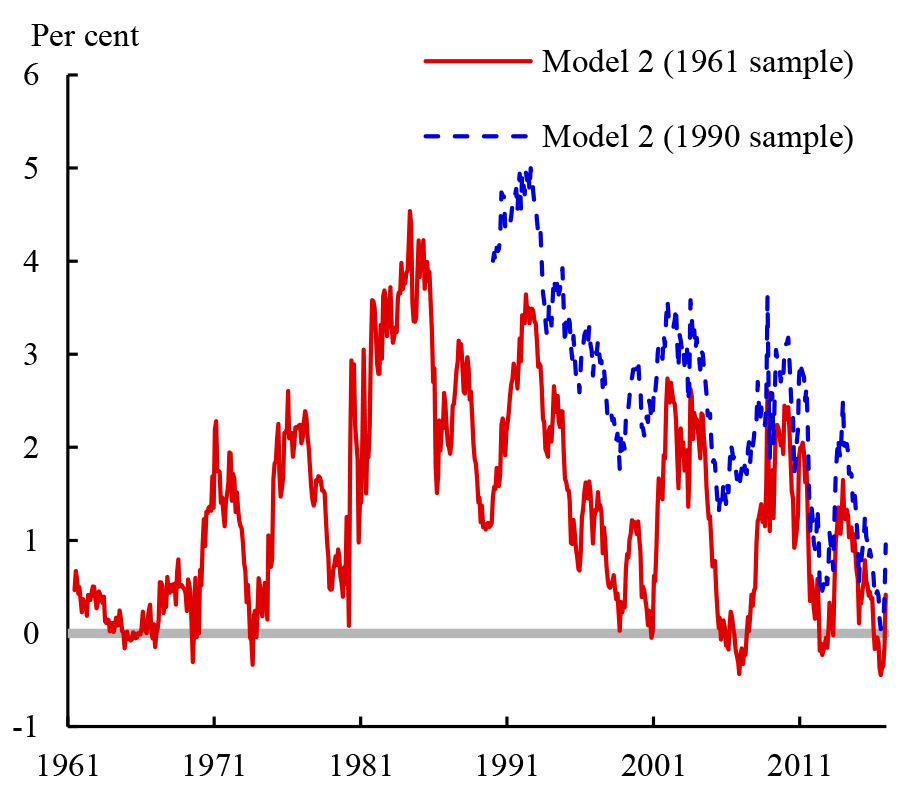
Second, particularly for models estimated without surveys, the choice of sample period also matters for term premium estimates. The red line on Figure 4 shows the ten-year term premium from Model 2, while the blue, dotted line shows estimates from the same model but estimated using data since January 1990 (just as an example). The differences between the estimates can be large. In comparison, for models estimated using surveys, Figure 3 shows that the sample period is much less important (recall that Model 4 is estimated using data from July 1990, whereas Models 5 and 6 are estimated using data from June 1961).
Finally, other factors such as the estimation technique and the exact choice of yields and factors appear to be much less important.
How do we explain these differences between models estimated with and without surveys? The main reason is that it is challenging to estimate the parameters determining how yields move over time precisely – and these parameters are key to projecting short-term interest rate expectations and therefore estimating term premiums. As discussed by Kim and Orphanides (2012), Treasury yields are extremely persistent, so there is little information in a typical sample with which to pin down either the long-run average level of yields or the speed of reversion back to that mean, so confidence intervals around estimates of term premiums can be wide.8 Point estimates of VAR parameters are also biased in short samples and typically over-state the speed of mean reversion. Taken together, these problems mean that in models estimated using yields alone, forecasts of future short-term interest rates at long horizons are likely to be too stable over time (because they mean revert too quickly); that confidence intervals can be wide; and that point estimates can vary substantially across different sample periods.
Although survey measures of expectations are not frequently updated (e.g. the long-term survey used in the KW model is only published biannually), including them in the data set for estimating term structure models may alleviate small sample problems by providing more information about the long-run average short rate and how quickly short-term interest rates should revert back to that average (Kim and Wright (2005), Kim and Orphanides (2012)). As a result, term premium estimates from survey models are less sensitive to the choice of sample period Guimarães (2016). Including the surveys also makes the expectations component more variable and term premiums less variable, which may be because they help to offset some of the small-sample bias mentioned above (less variable long-horizon term premiums are the flip-side of more variable short rate expectations).
The sensitivity to the sample period in models that do not include surveys is problematic in part because choosing the most appropriate sample period is not entirely straightforward – and there is not a clear consensus in the term structure literature. A sample that omits data before the 1990s reduces the likelihood that structural breaks associated with changes in monetary policy will bias parameter estimates – but means that yields are generally falling throughout the remaining sample, and therefore there is almost no information in yields with which to estimate the long-run average and the speed of mean reversion. Using a longer sample means that there is potentially more information to estimate the dynamics of yields but brings greater risk that parameters are biased by structural breaks. For example, the FT commentary mentioned above suggested it is "implausible" that late-1970s investors would have expected yields to fall over time as inflation was rising. Mechanically, this is simply a consequence of the fact that in the late 1970s yields were much higher than the full sample average, so the models imply that investors were expecting them to fall back towards the mean. The versions of the models that include surveys only do so from 1983 onwards but it is worth noting that short-horizon surveys from 1980 suggest that short-term interest rates were indeed expected to fall over the subsequent year.
Are surveys a panacea?
While precise estimates that are robust to changing the sample periodmay be desirable features of a model, it is important to remember that precise estimates are not necessarily 'better' estimates. In including the surveys, we assume that the mean of survey responses provides an unbiased and efficient measures of expectations of Treasury market participants (i.e. that surveys are equal to investors' true expectations on average and that the measurement error in surveys is uncorrelated with current yields). These assumptions may not hold in practice, for a number of reasons:
- Expectations of Blue Chip survey respondents may be systematically different from those of Treasury-market traders. It is possible that this could explain why surveys have implied a somewhat faster pace of lift-off than market rates in recent years (although that could also just reflect a negative term premium at short maturities).
- It is possible that survey forecasts are not a good measure of respondents' true expectations of future short-term interest rates, or that survey respondents have a different interpretation of 'expectation' than the formal definition used in models (e.g. see this blog post by John Cochrane). For example, if respondents' remuneration depends on the accuracy of their forecasts, surveys may contain a risk premium just like market interest rates.
- Surveys are computed as equal-weighted averages of responses, whereas market prices depend on the views of the marginal investor.
Ultimately, it is challenging to find convincing ways of externally verifying the plausibility of models term premium estimates. Comparing model-implied short rate expectations with surveys of professional forecasters provides one reasonable approach – but other criteria – such as how well a model forecasts are also relevant. There are also other methods that could be used to improve the accuracy or precision of term premium estimates without relying on surveys, including: introducing parameter restrictions that improve identification (e.g. Cochrane and Piazzesi (2008); Bauer (2016)); statistical bias adjustments (Bauer, Rudebusch and Wu (2012)); or incorporating own prior information about the dynamics of yields in a Bayesian setting. In future work, we therefore plan to continue to evaluate a wider set of models against a wider set of criteria than discussed in this Note.
What features of term premiums appear to be robust?
Although the point estimates of ten-year term premiums from the models mentioned above can differ, some features do appear to be quite robust across models:
- Estimates of long-maturity term premiums are currently low by historical standards. While a full discussion of the potential explanatory factors is beyond the scope of this Note, it suggests that at least part of the decline in long-term interest rates since the early 1980s is attributable to lower term premiums (rather than just being about lower short-term 'neutral' rates).
- Changes in estimated term premiums are highly correlated across the models: the correlation between monthly changes in the ACM and KW estimates in Figures 1 and 3 is about 0.7. We therefore get a broadly consistent story across the models about the times when term premiums were falling or rising. For example, focusing on the period since the onset of the financial crisis in mid-2007, term premium estimates generally rose until early 2010 (albeit with some volatility). They fell back over the remainder of 2010 and again following the forward guidance announcement in August 2011, before rising for a period during and after the 'taper tantrum' of 2013. As mentioned above, they have since fallen back to around historical lows.
On the other hand, some features of term premium estimates are not robust across models:
- The sign of term premium estimates can at times be different. 9 This is at least in part because the average level of the term premium is sensitive to whether or not surveys have been included and the choice of sample period.
- The magnitude of movements in term premiums is smaller in the models that include surveys than in the models that do not: the flip-side of more variable short rate expectations in the survey models. This suggests that we should be somewhat cautious about putting too much weight on high-frequency changes in estimates of term premiums – particularly when the change in overall Treasury yields is relatively small.
- Although the term premium estimates are quite highly correlated, preliminary evidence about how they covary with the economic cycle is somewhat mixed. Term premiums are typically thought to be countercyclical because the magnitude of asset risk premiums in general tends to rise in bad times.10 Simple (unreported) regressions of ACM term premiums on the 'unemployment gap'11 suggest those estimates are indeed countercyclical, whereas no significant relationship is found for the KW estimates. We plan to investigate the cyclical properties of term premiums in more detail in future work.
Conclusions
In models that are estimated using yields only (such as the ACM estimates published by the NY Fed), confidence intervals around term premium estimates can be wide. Including interest rate surveys in the estimation of term structure models can reduce the problems associated with small samples. That said, while robustness to changing the sample period and matching surveys reasonably closely are desirable features of a model, they do not in themselves imply 'better' estimates of term premiums. Further work to evaluate a wider set of models against a wider set of criteria would be helpful for moving forward the debate. At least for the time being, however, it is always worth considering the robustness of signals from a range of different approaches when making statements about term premiums.
| Model 1 (ACM) | Model 2 | Model 3 | Model 4 (KW) | Model 5 | Model 6 | |
|---|---|---|---|---|---|---|
| Sample start date | June 19611 | June 1961 | June 1961 | June 1961 | June 1961 | June 1961 |
| Cross-section of yields | GSW2 yields with maturities of 6, 12, 18, 24, 30, 36, 42, 48, 54, 60, 84 and 120 months | 3- and 6-month T-bills GSW yields with maturities of 12, 24, 48, 84 and 120 months | 3- and 6-month T-bills GSW yields with maturities of 12, 24, 48, 84 and 120 months | 3- and 6-month T-bills GSW yields with maturities of 12, 24, 48, 84 and 120 months | 3- and 6-month T-bills GSW yields with maturities of 12, 24, 48, 84 and 120 months | 3- and 6-month T-bills GSW yields with maturities of 12, 24, 48, 84 and 120 months |
| Pricing factors | 5 principal components3 | 3 principal components | 3 principal components | 3 unobserved factors | 3 principal components | 3 principal components |
| Surveys4 | None | None | None | Blue Chip surveys of the 3-month T-bill yield expected in 6 months, 1 year and 6-11 years (average) | Blue Chip surveys of the 3-month T-bill yield expected in 6 months, 1 year and 6-11 years (average) | Blue Chip surveys of the 3-month T-bill yield expected in 6 months, 1 year and 6-11 years (average) |
| Frequency | Monthly | Monthly | Monthly | Weekly | Monthly | Monthly |
| Estimation method | Multi-step regression | Multi-step regression | Maximum likelihood | Maximum likelihood | Multi-step regression | Maximum likelihood |
1. In the published paper, ACM use a sample starting in January 1987. Here we refer to the estimates updated and published on the NY Fed website and Bloomberg. Return to text
2. The zero-coupon yields estimated by Gürkaynak, Sack and Wright (2006), updates of which are published by the Board. Return to text
3. Principal components of yields with maturities 3, 4, ..., 120 months. Return to text
4. Six- and twelve-month surveys are observed monthly. Long-term surveys are observed biannually. Return to text
References
Adrian, T., R. K. Crump, B. Mills and E. Moench (2014), 'Treasury Term Premia: 1961-Present', Liberty Street Economics, available at: http://libertystreeteconomics.newyorkfed.org/2014/05/treasury-term-premia-1961-present.html.
Adrian, T., R. K. Crump and E. Moench (2013), 'Pricing the Term Structure with Linear Regressions', Journal of Financial Economics 110(1), pp. 110-138.
Bauer, M. D. (2016), 'Restrictions on Risk Prices in Dynamic Term Structure Models', Journal of Business and Economic Statistics, forthcoming.
Bauer, M. D., G. D. Rudebusch and J. C. Wu (2012), 'Correcting Estimation Bias in Dynamic Term Structure Models', Journal of Business and Economic Statistics 30(3), pp. 454-467.
Bauer, M. D. and G. D. Rudebusch (2016) 'Resolving the Spanning Puzzle in Macro-Finance Term Structure Models', Federal Reserve Bank of San Francisco Working Paper 2015-01.
Black, F. (1995) 'Interest Rates as Options', Journal of Finance 50(7), pp. 1371-1376.
Cochrane, J. H. (2014) 'Real or risk-neutral wolf', blog post available at: http://johnhcochrane.blogspot.com/2014/12/real-or-risk-neutral-wolf.html.
Cochrane, J. H. and M. Piazzesi (2008), 'Decomposing the Yield Curve', working paper, available at: https://papers.ssrn.com/sol3/papers2.cfm?abstract_id=1333274.
Council of Economic Advisors (2015), 'Long-term interest rates: a survey'.
Crump, R. K., Eusepi, S. and Moench, E. (2016), 'The Term Structure of Expectations and Bond Yields', Federal Reserve Bank of New York Staff Reports 775.
Duffee, G. R. (2002), 'Term Premia and Interest Rate Forecasts in Affine Models', Journal of Finance 57(1), pp. 405-443.
Duffie, D. and R. Kan (1996), 'A Yield-factor Model of Interest Rates', Mathematical Finance 6(4), pp. 379-406.
Guimarães, R. (2016) 'Fool's Errand? Robust Identification of Risk Premia and Expectations in Asset Prices', working paper, available at: https://papers.ssrn.com/sol3/papers2.cfm?abstract_id=2420379.
Gurkaynak, R. S., B. P. Sack and J. H. Wright (2007) 'The U.S. Treasury yield curve: 1961 to the present', Journal of Monetary Economics 54(8), pp. 2291-2304.
Kim, D. H. and A. Orphanides. (2012), 'Term Structure Estimation with Survey Data on Interest Rate Forecasts', Journal of Financial and Quantitative Analysis 47(1), pp. 241-272.
Kim, D. H. and M. Priebsch (2013) 'Estimation of Multi-Factor Shadow Rate Term Structure Models', working paper, available at: http://www.frbsf.org/economic-research/events/2013/october/term-structure-modeling-zero-lower-bound/agenda/files/Kim_Priebsch_Estimation_of_Multi-Factor_Shadow-Rate_Term_Structure_Models.pdf.
Kim, D. H. and J. H. Wright (2005), 'An Arbitrage-Free Three-Factor Term Structure Model and the Recent Behavior of Long-Term Yields and Distant-Horizon Forward Rates', Federal Reserve Board Finance and Economics Discussion Series 2005-33.
Klein, M. C. (2016) 'What's up with the "term premium"?', Financial Times, 1 December 2016.
Malik, S. and A. Meldrum (2016) 'Evaluating the robustness of UK term structure decompositions using linear regression methods', Journal of Banking and Finance 67, pp. 85-102.
Sian, H. and A. Appeddu (2016) 'The uses and abuses of the bond term premium', Citi Global Rates Strategy Focus, 28 November 2016.
1. Klein (2016), who draws on the results of Sian and Appeddu (2016). Return to text
2. For example, see the transcript of the January 25-26 2011 FOMC meeting: https://www.federalreserve.gov/monetarypolicy/files/FOMC20110126meeting.pdf and accompanying materials: https://www.federalreserve.gov/monetarypolicy/files/FOMC20110126material.pdf. Return to text
3. Strictly speaking, in KW the factors are not observed principal components but unobserved factors to be estimated using Kalman filtering techniques. This does not make a material difference to estimates of term premiums. Return to text
4. ACM actually use a slightly different definition of the term premium. But this differs from the definition we use only by a small and constant convexity term (about 20 basis points at ten years). Return to text
5. A full discussion of the pros and cons of different estimation techniques is beyond the scope of this Note. We focus our attention only on the implications for estimates of long-horizon term premiums. Return to text
6. In ACM, the VAR governing the time-series dynamics of the pricing factors is estimated by OLS. To incorporate surveys, we adopt a similar procedure to Malik and Meldrum (2016) (http://www.sciencedirect.com/science/article/pii/S0378426616000443). We first regress the one-month rate on the factors. Taking the resulting short rate loadings as fixed, we then estimate the time-series dynamics of yields to maximize the likelihood of the observed factors and the surveys, which we assume provide a noisy measurement of expected future short-term interest rates (strictly speaking, the T-bill surveys are measures of expected three-, rather than one-month yields but we assume that this does not make a material difference). The remainder of the ACM estimation method is unchanged. Return to text
7. This result is consistent with the those of Adrian, Crump, Mills and Moench (2014), who show that the Kim-Wright term premium is close to the average of the ACM term premium and a measure computed by simply subtracting survey expectations of short-term interest rates from yields. Crump, Eusepi and Moench (2016) explore the properties of such survey-based term premium estimates in more detail. Return to text
8. Of course all of this assumes that a VAR with constant parameters is the most appropriate model for the dynamics of yields. It may not be – for example, a model that assumes a constant long-run mean would be mis-specified if there has been a permanent decline in long-horizon short-term 'neutral' interest rate expectations in recent years. Return to text
9. A positive term premium suggests that investors view bonds as a risky asset – i.e. they tend to have relatively low pay-offs (because yields rise and bond prices falls) in bad times. A negative term premium suggests that investors instead view bonds as a hedge against bad times (because yields fall and bond prices rise). Return to text
10. This argument depends on the term premium being positive, which is inconclusive, as discussed above. Return to text
11. Following Bauer and Rudebusch (2016), we define the unemployment gap as the difference between the actual unemployment rate and the CBO's estimate of the natural rate. Return to text
Li, Canlin, Andrew Meldrum, and Marius Rodriguez (2017). "Robustness of long-maturity term premium estimates," FEDS Notes. Washington: Board of Governors of the Federal Reserve System, April 3, 2017, https://doi.org/10.17016/2380-7172.1927.
Disclaimer: FEDS Notes are articles in which Board staff offer their own views and present analysis on a range of topics in economics and finance. These articles are shorter and less technically oriented than FEDS Working Papers and IFDP papers.