FEDS Notes
July 08, 2021
Seasonal Unemployment Rate Differences by Race, Ethnicity, and Gender
Andrew H. McCallum and Alexis Payne
The labor market experiences of Americans differ by race, ethnicity, and gender. For example, between 1977 and 2019, the monthly standard deviation (volatility) of the unemployment rate for Black workers was 3.2 percent, substantially higher than the 1.5 percent experienced by their white counterparts.1 Volatility in the unemployment rate translates to higher income volatility, which is bad for workers. Economists often study the unemployment rate after removing predictable seasonal patterns, but it is important to remember that workers experience seasonal unemployment, too.
This article documents three facts about the monthly seasonality of the unemployment rate for six groups of Americans: Black females, Black males, Hispanic females, Hispanic males, white females, and white males. The first fact is that the seasonal pattern of the unemployment rate is the most volatile for Hispanic males and the least volatile for white females. Second, seasonal patterns are similar between race and ethnicity within genders but different within race and ethnicity between genders. Third, white males and Hispanic males have the most positively correlated seasonal patterns, and white males and Black females have the most negatively correlated patterns.
We investigate the seasonality of unemployment rates for these groups using monthly data from January 1977 through December 2019. These data are from the U.S. Bureau of Labor Statistics (BLS) Current Population Survey.2 Race, ethnicity, and gender (biological sex) information is self-reported or collected by proxy, typically from a designated household respondent. Data by gender and race are published in the mutually exclusive groups of male and female and of Black or African American (Black) and white. Ethnically Hispanic or Latino (Hispanic) individuals may be of any race.3
We estimate the seasonal pattern of the unemployment rate using X-13 ARIMA-SEATS (X-13), a standard seasonal adjustment method used by the BLS and other statistical agencies.4 This method decomposes the monthly unemployment rate ($$U_t$$) into additive seasonal ($$S_t$$), trend ($$T_t$$), and remainder ($$R_t$$) components given by
$$$$ U_t = S_t + T_t + R_t. $$$$
We apply this decomposition separately both to the unemployment rates, $$U_t$$, of each of the six groups of interest and to those of females, males, and all workers. When reporting seasonally adjusted unemployment rates, the BLS applies seasonal adjustment separately to each category of workers as well. In contrast to studies of the seasonally adjusted unemployment rate, $$T_t + R_t$$, our objects of interest are the monthly seasonal patterns, $$S_t$$, for each classification of workers. These seasonal patterns capture the predictable seasonality in the unemployment rate for each month and group.
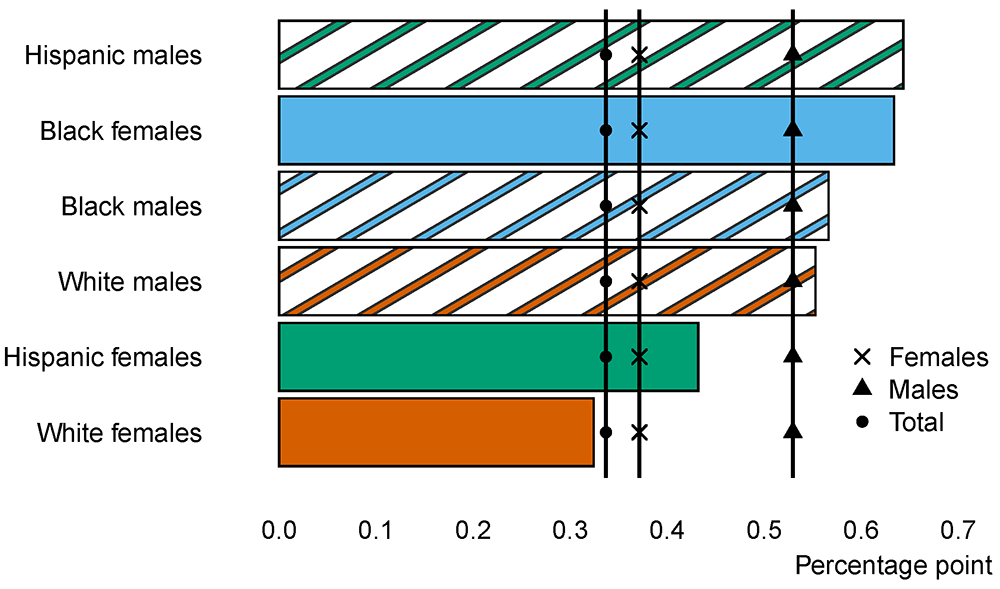
We begin by documenting the difference between the standard deviations of the seasonal pattern—$$\sqrt{V[S_t]}$$ in which $$V[S_t]$$ is the variance—for each of our nine groups of interest. Figure 1 shows that Hispanic males' unemployment rate seasonality has the highest standard deviation at 0.64 percentage point. In contrast, the unemployment rate of white females has the lowest standard deviation at 0.32 percentage point. Males have higher seasonal variation than do females, with 0.53 percentage point versus 0.37 percentage point, respectively. Many of these differences are statistically significant at the 10 percent level.5
Figures 2 and 3 show the differences in unemployment seasonality between race and ethnicity by gender. Figure 2 shows the differences for males and is constructed by subtracting the overall males' seasonal pattern from the seasonality of Black males, Hispanic males, and white males, separately. For each group, we then average these differences over each of the 43 observations for each calendar month in the data. For example, the number shown for Black males in January is the difference in the seasonal pattern for Black males in each January minus the pattern for all males in that same January averaged over all 43 January observations in the data.
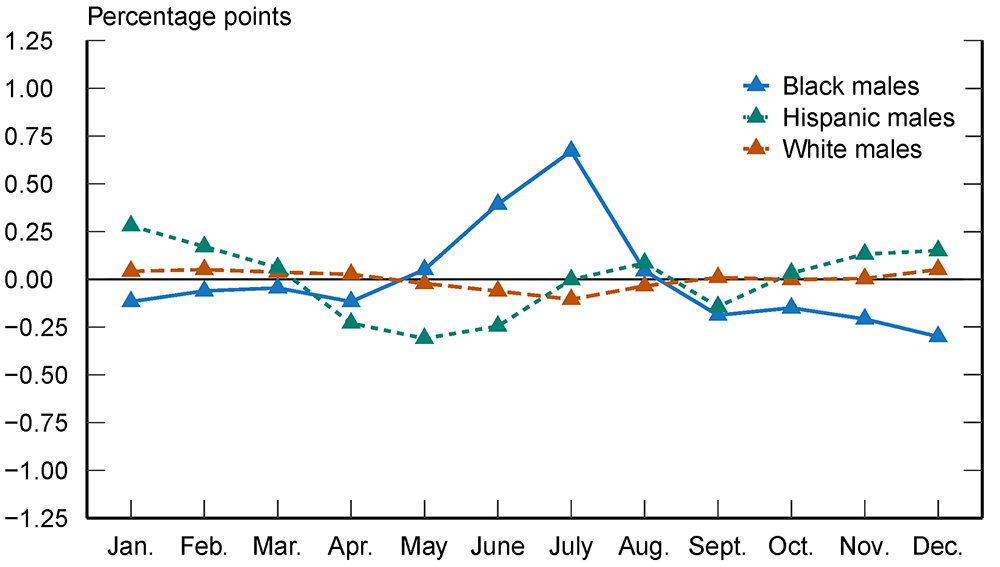
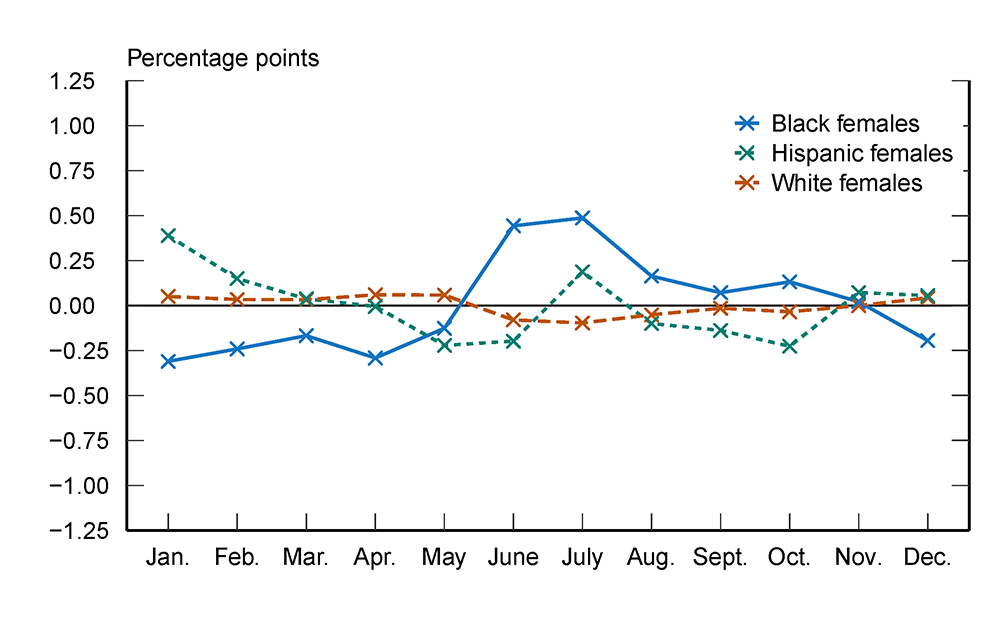
Similarly, figure 3 compares the seasonality of Black females, Hispanic females, and white females with the seasonal pattern for all females. As can be seen in figures 2 and 3, the average difference by race and ethnicity from the pattern for all workers of the same gender is within plus or minus 0.75 percentage point for males and plus or minus 0.50 percentage point for females. The only notable months are June and July in figure 2 (given the relatively large differences for Black males) and June and July in figure 3 (in light of the comparatively outsized differences for Black females).
Figure 3. Average difference from overall female by race and ethnicity
In contrast to the difference within gender and between race and ethnicity, the differences between genders within race and ethnicity have clear cycles throughout the year. Figure 4 plots the average gender difference within race and ethnicity. For example, the Black number in January is the seasonal pattern for Black males minus the seasonal pattern for Black females in each January averaged over all 43 January observations in the data. Regardless of race and ethnicity, males consistently have higher seasonal unemployment rates than females in the winter months, and females have higher seasonal unemployment rates than males in the summer months.
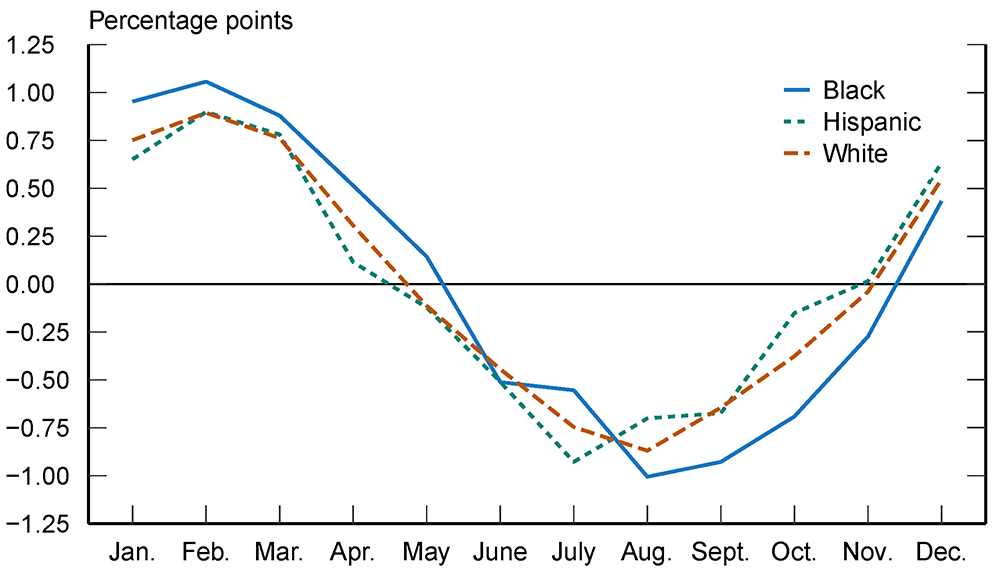
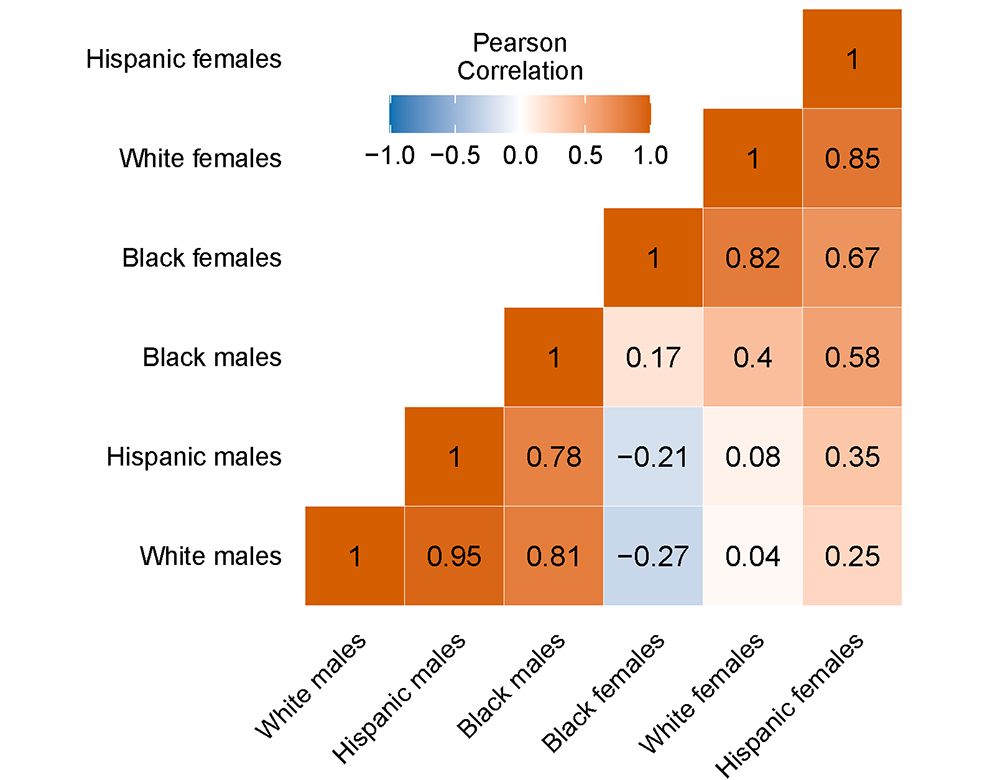
Figure 5 documents the correlation of unemployment rate seasonal patterns between each group displayed as a heat map. The most positively correlated groups are white males and Hispanic males, which have a Pearson correlation coefficient (PCC) of 0.95. In contrast, the most negatively correlated groups are white males and Black females, which have a PCC of negative 0.27. These correlations reiterate the results in figure 4. Correlations in seasonality between genders within the same race and ethnicity are lower than correlations between race and ethnicity within gender.
One possible explanation for why unemployment rate seasonality differs more across genders than it does across races and ethnicities could be occupational concentrations that are related to seasonal weather. In 2019, for instance, about 11 percent, 18 percent, and 27 percent of Black, white, and Hispanic men, respectively, worked in natural resources, construction, and maintenance (NRCM) occupations. These percentages contrast with NRCM occupation concentrations of about 1 percent, 1 percent, and 2 percent of Black, white, and Hispanic women, respectively.6 Construction occupations in the United States, in particular, are known to have higher employment in summer months and lower employment in winter months, which, together with the higher concentration of male versus female workers, could explain the pattern in figure 4.7 Non–labor market opportunities and labor force participation rate differences are other possible explanations that we do not explore here. Additionally, our results imply that two-person heterosexual households could offset individual unemployment rate seasonal volatility for those households, especially when those seasonal patterns are negatively correlated. We leave more detailed explanations of our findings and their implications to future research.
1. Using an F-test, we find that the difference between the Black and white standard deviations in the unemployment rate is statistically significant at the 1 percent level. Return to text
2. The first full year that unemployment rate data are available for all groups of interest is 1977. Data are from the BLS Data Finder and include the civilian non-institutionalized population aged 16 years and over for all industries, occupations, educational levels, and marital statuses. The series identification numbers are as follows: total not seasonally adjusted (NSA) (LNU04000000), male NSA (LNU04000001), female NSA (LNU04000002), white NSA (LNU04000003), white male NSA (LNU04000004), white female NSA (LNU04000005), Black/African American NSA (LNU04000006), Black/African American male NSA (LNU04000007), Black/African American female NSA (LNU04000008), Hispanic/Latino NSA (LNU04000009), Hispanic/Latino male NSA (LNU04000010), and Hispanic/Latino female NSA (LNU04000011). Return to text
3. Race categories have been mutually exclusive since 2003; see Bureau of Labor Statistics (2021), "Labor Force Statistics from the Current Population Survey: Concepts and Definitions," webpage, https://www.bls.gov/cps/definitions.htm#race. Return to text
4. Multiplicative decomposition can be accomplished by taking the logarithm of the dependent variable to be decomposed. For more details about the BLS's seasonal adjustment procedures, see Richard B. Tiller and Thomas D. Evans (2018), "Seasonal Adjustment Methodology for National Labor Force Statistics from the Current Population Survey (CPS)" (Washington: Bureau of Labor Statistics, December 13), https://www.bls.gov/cps/seasonal-adjustment-methodology.htm. Return to text
5. Using an F-test, we find that the differences are statistically significant at least at the 10 percent level except for the difference between total and white (p-value 0.62), total and white female (p-value 0.39), all males and white males (p-value 0.33), all males and Black males (p-value 0.13), white and white females (p-value 0.17), Black and Hispanic (p-value 0.38), white males and Black males (p-value 0.59), and Black females and Hispanic males (p-value 0.74). None of these test statistics correct for the fact that $$S_t$$ itself is an estimate of the true seasonal pattern. Return to text
6. For more details, see the BLS table "Employed Persons by Occupation, Race, Hispanic or Latino Ethnicity, and Sex," available on the agency's website at https://www.bls.gov/cps/cpsaat10.htm. Return to text
7. See Menelik Geremew and François Gourio (2018), "Seasonal and Business Cycles of U.S. Employment," Federal Reserve Bank of Chicago, Economic Perspectives, vol. 42 (3), pp. 1–28, https://www.chicagofed.org/~/media/publications/economic-perspectives/2018/ep2018-3-pdf.pdf. Return to text
McCallum, Andrew H., and Alexis Payne (2021). "Seasonal Unemployment Rate Differences by Race, Ethnicity, and Gender," FEDS Notes. Washington: Board of Governors of the Federal Reserve System, July 08, 2021, https://doi.org/10.17016/2380-7172.2947.
Disclaimer: FEDS Notes are articles in which Board staff offer their own views and present analysis on a range of topics in economics and finance. These articles are shorter and less technically oriented than FEDS Working Papers and IFDP papers.