FEDS Notes
March 04, 2021
The Effect of US-China Tariff Hikes: Differences in Demand Composition Matter
Ricardo Reyes-Heroles, Charlotte T. Singer, and Eva Van Leemput1
Introduction
In this note, we estimate the economic effects of the increases in tariffs between China and the USA since the beginning of 2018, taking into account the investment channel. As of the bilateral Phase One agreement in early 2020, the United States has raised tariffs on about $335 billion of Chinese goods and China has raised tariffs on about $120 billion of US goods. Since then, there have been a number of papers that have quantified the potential impact of those bilateral tariff hikes (Charbonneau and Landry, 2018; Ferraro and Van Leemput, 2019) and there is a growing number of papers that have studied the impact on the U.S. economy (Caldara et al., 2019; Mix, 2019; Flaaen and Pierce, 2019; Cavallo et al., 2019; Waugh, 2019). However, most quantitative international trade models abstract from the impact of tariffs on investment and focus predominantly on consumption effects. This seems at odds with the bilateral trade data, which show that the United States imports a notable fraction of its capital goods (nearly 40 percent) from China.
First, we document the structure of final demand and its relationship with trade flows between China and the United States. We show that the United States imports more from China in sectors that are used intensively for final investment including machinery and equipment, whereas China's imports from the United States in these sectors are much smaller as a share of expenditure. Second, we highlight that the United States has increased tariffs on a notable amount of those goods that are used intensively in investment. Finally, we quantify the impact of the currently implemented tariff hikes on the long run GDP levels of the United States and China through the lens of an international trade model, which takes into account differences in demand composition across consumption and investment, and a dynamic investment decision.
We find larger quantitative effects on both U.S. and Chinese GDP relative to canonical models of trade, which do not consider investment and capital accumulation. Specifically, our trade model estimates that the currently implemented tariffs would reduce the long run level of U.S. and Chinese GDP by 1.3 percent and 0.7 percent, respectively. This result suggests that the United States is estimated to experience larger GDP losses from the currently implemented tariff hikes than China. This result is in contrast to previous work that estimates China has more to lose in a mutual increase in tariffs than the United States, as Chinese exports to the United States represent a larger share of the Chinese economy than U.S. exports to China as table 1 highlights.
Table 1: U.S.-China Trade Importance
| U.S. Total Imports from China | U.S. Total Exports to China | ||
|---|---|---|---|
| Level (2017, $bn) | 509.6 | Level (2017, $bn) | 130 |
| % U.S. Total Non-Oil Goods Imports | 23% | % U.S. Total Non-Oil Goods Exports | 9% |
| % U.S. GDP | 2.60% | % U.S. GDP | 0.70% |
| % Chinese Total Non-Oil Goods Exports | 23% | % Chinese Total Non-Oil Goods Imports | 8% |
| % Chinese GDP | 4% | % Chinese GDP | 1% |
The intuition for our result is driven by the demand composition of international trade. The United States imports a large amount of goods from China used intensively for investment and has raised import tariffs on those goods. As such, the relative cost of investment to consumption has increased notably, thereby reducing investment and capital accumulation over time, which has larger long-run effects on GDP. In contrast, China imports more from the United States in sectors used intensively for consumption including agricultural goods. Given that those are more easily diverted away and do not account for a large share of inputs into other sectors, China's losses are smaller relative to those in the United States. All told, we find that the demand composition of international trade matters when studying the impact of tariff hikes.
Data
In our analysis, we include 30 separate countries and a rest-of-the-world (ROW) entity modeled as one aggregate block.2 The model includes 40 sectors, of which 20 are tradable and 20 are non-tradable. We collected data on (1) trade flows, (2) tariffs, (3) input-output structures, sectoral consumption and investment shares, (4) sectoral gross output and value added, and (5) capital stocks and labor endowments of low- and high-skilled workers from several data sets. More details on the data collected and industries considered are provided in the appendix.
The Anatomy of U.S.-China Trade and Final Demand
This section describes bilateral trade between China and the United States in more detail, with a focus on demand composition and its relationship with trade flows. Specifically, we focus on the difference in the sectoral composition between final consumption and investment. Figure 1 shows the sectoral consumption and investment shares (yellow and blue bars) in tradable sectors for the United States and China. The same figures also plot in the right axis the share of sectoral expenditure on bilateral imports (red dots). For instance, consider the machinery sector in the United States. The blue bar implies that this industry accounts for approximately 6 percent of final investment, while the yellow bar highlights that it only accounts for less than 1 percent of final consumption. The red dot shows that approximately 10 percent of total expenditure on Machinery in the United States is on goods produced in China.
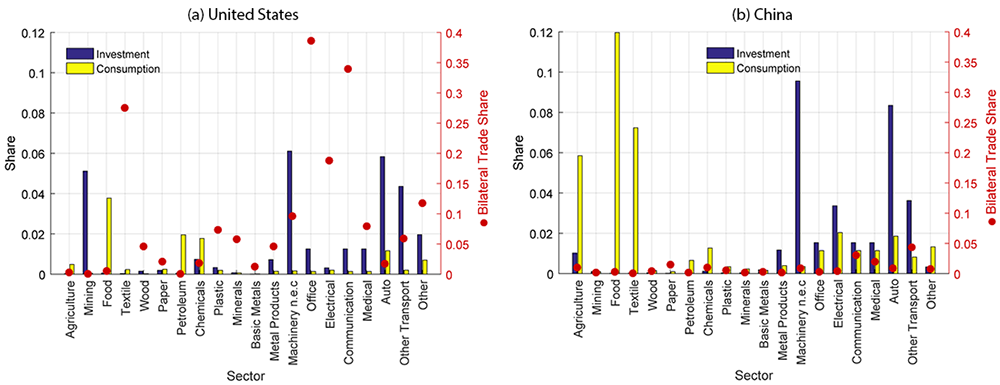
A first takeaway from figure 1 is that the sectoral composition of final consumption is very different from that of final investment.3 Moreover, sectors with high shares in final consumption tend to be the ones with low shares in final investment and vice-versa. This observation implies that sector-specific tariff hikes will have different implications for the cost of final consumption goods relative to final investment goods. Note that this applies to both countries even though expenditures shares for all tradeable sectors in aggregate consumption and investment vary significantly across countries.4
A second and more important take away from figure 1 is that bilateral trade is tilted towards those sectors that are used more intensively for final investment—high blue bars are typically accompanied by higher red dots. To underscore this point, we consider a simple measure of the bilateral tradability-bias of investment relative to consumption by regressing bilateral trade shares—the red dots—on the difference between investment and consumption expenditure shares—the difference between the blue and yellow bars—and comparing the slope estimates of these regressions. We obtain slope coefficients of 0.24 and 0.07 for the United States and China, respectively. This result implies that sectors that are more open are more intensively used for investment and that this relationship is stronger for the United States, implying that trade is more tilted towards final investment goods in the United States than in China.
Next, we focus on sectoral bilateral tariffs implemented between the United States and China. Figure 2 presents data on bilateral tariff increases between the United States—blue bars—and China—white bars—under the Phase one agreement in early 2020 across tradable sectors.5
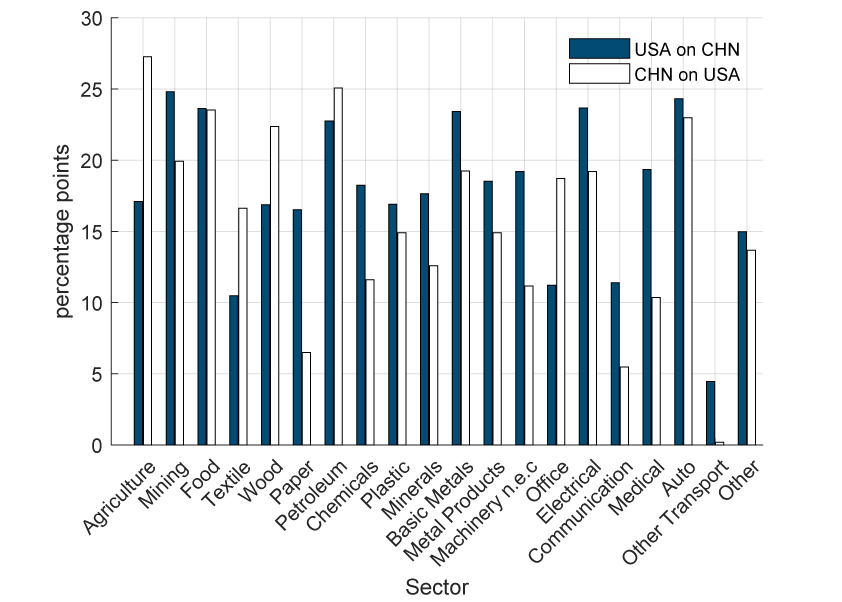
The figure shows that these increases have been substantial for most sectors, averaging 17.8 and 15.8 for the United States and China respectively. Even though average increases in bilateral tariffs do not differ significantly across countries, sector-specific increases do. For instance, relative to China, the United States imposed greater tariff increases in highly traded sectors like electrical, communication, and medical among others. According to our previous analysis, these differential increases across sectors will have differential effects across final consumption and investment according to the demand composition of bilateral trade. Assuming that higher bilateral tariffs fully pass-through to sectoral prices, we can construct implied changes in the prices of final investment and consumption in each country. By doing so, we obtain that the price of final investment in the United States would increase by 0.33 percentage point, while that of final consumption would only increase by 0.07 percentage point. China would experience an increase of 0.04 percentage point on the prices of both final investment and consumption. Hence, U.S. tariff increases on Chinese imports have been clearly tilted toward those sectors used more intensively for investment.
How much are these bilateral tariff increases estimated to affect the world economy? To answer this question, we analyze the impact of the currently implemented tariffs using a quantitative international trade model that builds on the seminal work of Eaton and Kortum (2002) to include: (1) multiple sectors with input-output linkages, (2) three factors of production including capital, skilled, and unskilled labor, and (3) dynamic investment decisions.6
Quantitative Analysis
Using the model, we estimate the effects of the increases in tariffs between China and the United States under the Phase One agreement. We solve for a new steady-state equilibrium under Phase One tariffs using our international trade model and compute the changes in real long run GDP for the United States, China and the other countries relative to our baseline scenario.
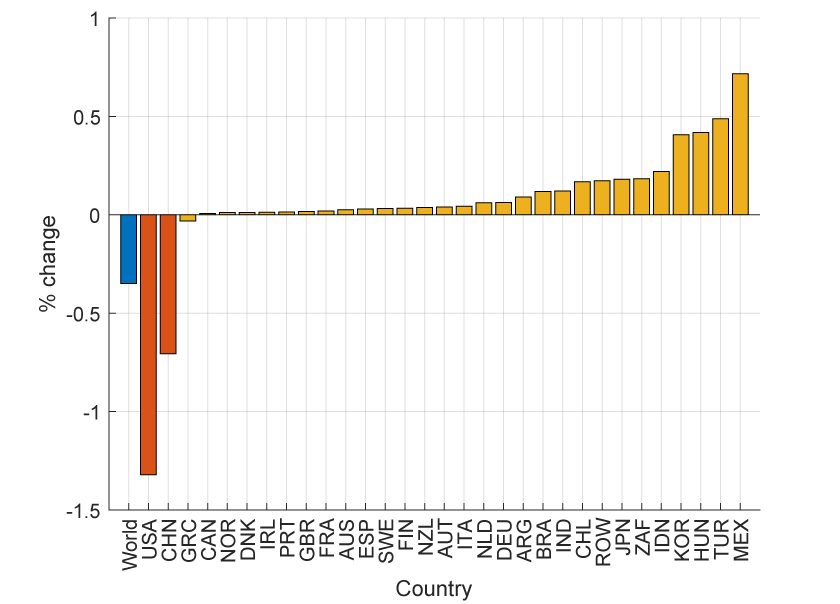
The macroeconomic consequences of the increase in implemented tariffs between the United States and China are shown in figures 3 and 4. Figure 3 shows the long run effects on GDP in China, the United States and all other countries included in our sample.
Figure 3 shows that the implemented tariffs between the United States and China are estimated to lower world GDP by 0.4 percent, where half of the decline is driven by a drop in investment and capital stocks. This decline in global GDP is more than entirely driven by a decline in GDP in the United States and China, as most of the other countries actually gain.7 The United States and China both experience a decline in GDP, of 1.3 and 0.7 percent, respectively, which are quantitatively large effects. For example, Ferraro and Van Leemput (2019), in a model without investment, estimate that the United States and China would suffer negative long-term effects on the level of GDP of 0.3 and 0.4 percent, respectively, under a more dire scenario where all bilateral trade is subject to a 25 percentage point increase. Therefore, we find larger quantitative impact on both U.S. and Chinese GDP relative to canonical models of trade, which only include labor as a factor of production.
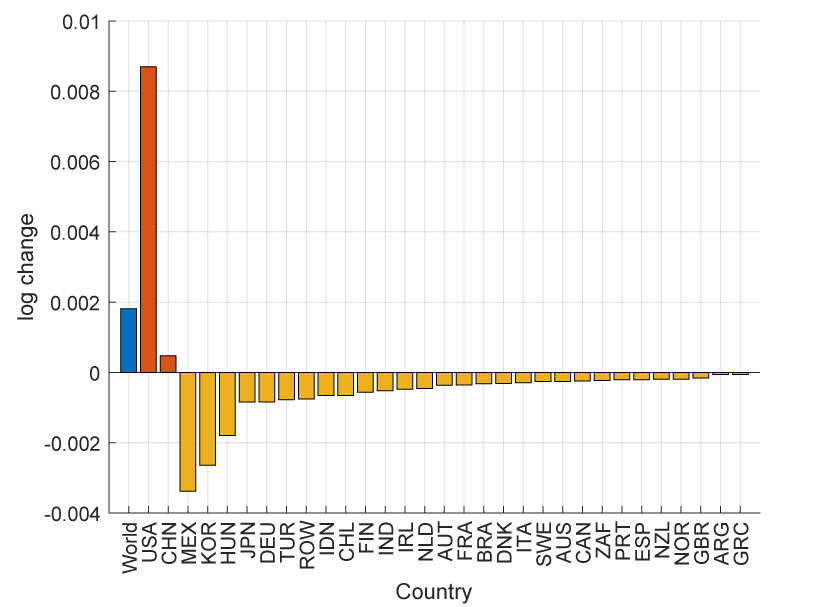
The second main finding is that the United States is estimated to suffer larger losses than China, which is also in contrast to canonical models of trade without investment. The intuition behind this result can be seen from figure 4, which shows changes in the relative price of capital to consumption after the tariff increases. As the figure highlights, the relative price of capital surges for the United States, which in turn depresses U.S. investment. This finding underscores the crucial role China plays in the acquisition by the United States of intermediate goods used for U.S. investment and of capital-intensive goods.8
For China, the model estimate also suggests a significant decline in the long run level of GDP, which reflects China's loss in international competitiveness compared to other countries, which lowers exports to the United States and in turn forces factors of production into less productive sectors. That said, we find smaller effects on Chinese investment as China's dependence on capital-intensive goods from the U.S. is relatively small. As shown in figure 4, the relative price of capital for China only increases marginally. All told, our results highlight the crucial role of the demand composition of bilateral trade and the need to explicitly model investment decisions in studying the long run effects of tariff hikes.
References
Caldara, D., M. Iacoviello, P. Molligo, A. Prestipino, and A. Raffo (2019): "The Economic Effects of Trade Policy Uncertainty," Journal of Monetary Economics, Forthcoming.
Cavallo, A., G. Gopinath, B. Neiman, and J. Tang (2019): "Tariff Passthrough at the Border and at the Store: Evidence from US Trade Policy,".
Charbonneau, K. B. and A. Landry (2018): "The Trade War in Numbers," Bank of Canada Working Paper 2018-57.
Eaton, J. and S. Kortum (2002): "Technology, Geography, and Trade," Econometrica, 70, 1741–1779.
Ferraro, J. K. and E. Van Leemput (2019): "Long-Run Effects on Chinese GDP from U.S.-China Tariff Hikes," Board of Governors of the Federal Reserve System, FEDS Notes.
Flaaen, A. and J. Pierce (2019): "Disentangling the Effects of the 2018-2019 Tariffs on a Globally Connected U.S. Manufacturing Sector," Finance and Economics Discussion Series Divisions of Research & Statistics and Monetary Affairs Working Paper-086.
Mix, C. (2019): "Technology, Geography, and Trade Over Time: The Dynamic Effects of Changing Trade Policy," (Manuscript).
OECD (2011): "STAN Database," .
——— (2016): "Monthly Monetary and Financial Statistics," .
Reyes-Heroles, R., S. Traiberman, and E. Van Leemput (2020): "Emerging Markets and the New Geography of Trade: The Effects of Rising Trade Barriers," IMF Economic Review, 68, 456–508.
Timmer, M. P., E. Dietzenbacher, B. Los, R. Stehrer, and G. J. de Vries (2015): "An Illustrated User Guide to the World Input-Output Database: the Case of Global Automotive Production," Review of International Economics, 23, 575–605.
United Nations (2014): "Trade Analysis and Information System Database,".
——— (2016a): "Commodity Trade Database,".
——— (2016b): "INDSTAT2 Database,".
——— (2016c): "Most-Favored Nation Database,".
——— (2016d): "National Accounts Database,".
Waugh, M. (2019): "The Consumption Response to Trade Shocks: Evidence from the US-China Trade War,".
World Input-Output Database (2014): "Input-Output Tables,"
Appendix
Bilateral Trade: We use bilateral trade from the United Nations Statistical Division Commodity Trade (UNCOMTRADE) database for 2016 at the Harmonized System 6-digit (HS-6) level.
Bilateral and Sectoral Tariffs: We collect sectoral tariff data from the United Nations Statistical Division-Trade Analysis and Information System (UNCTAD-TRAINS) and Most-Favored Nation (MFN) databases for 2014 and 2016, respectively. The UNCTAD TRAINS data contain bilateral tariffs at the HS-6 product level. The MFN data provide importer-specific MFN tariff rates. We then aggregate bilateral tariffs at the HS-6 level to sectoral bilateral tariffs for the tradable sectors in Table 2 using bilateral trade weights. All told, we compute 31 by 31 bilateral tariffs for each of the 20 tradable sectors in 2016 and assume infinitely large trade barriers for the 20 non-tradable sectors to serve as our baseline. The implemented and proposed tariffs are computed using the lists released by the USTR and China's Ministry of Commerce.
Table 2: Sectors
| Tradable | Non-Tradable | ||
|---|---|---|---|
| 1 Agriculture | 11 Basic metals | 21 Electricity | 31 Real estate |
| 2 Mining | 12 Metal products | 22 Construction | 32 Renting machinery |
| 3 Food | 13 Machinery nec | 23 Retail | 33 Computer |
| 4 Textile | 14 Office | 24 Hotels | 34 R&D |
| 5 Wood | 15 Electrical | 25 Land transport | 35 Other business |
| 6 Paper | 16 Communication | 26 Water transport | 36 Public |
| 7 Petroleum | 17 Medical | 27 Air transport | 37 Education |
| 8 Chemicals | 18 Auto | 28 Aux transport | 38 Health |
| 9 Plastic | 19 Other transport | 29 Post | 39 Other services |
| 10 Minerals | 20 Other | 30 Finance | 40 Private |
- Input-output tables, sectoral consumption and investment shares: We use the World Input-Output Database (WIOD) for 2014 to compute the input-output coefficients as the total dollar value of an input sector's intermediate goods divided by the total dollar value of the output sector's inputs.9
- Gross output and value added: We use sectoral gross output and value added data from the OECD STAN database for 2016.10
- Capital stocks and labor endowments of low- and high-skilled workers: We use the Socio Economic Accounts for 2014 to get the capital stocks and labor endowments of low- and high-skilled workers.
1. International Finance Division, Federal Reserve Board, Washington D.C. The views expressed herein are those of the authors and do not necessarily reflect those of the Board of Governors of the Federal Reserve System or its staff. We thank Shaghil Ahmed, whose insightful comments improved this note significantly. Return to text
2. The 30 countries include Argentina, Australia, Austria, Brazil, Canada, Chile, China, Denmark, Finland, France, Germany, Greece, Hungary, India, Indonesia, Ireland, Italy, Japan, Mexico, the Netherlands, New Zealand, Norway, Portugal, South Africa, South Korea, Spain, Sweden, Turkey, the United Kingdom, and the United States. Return to text
3. We consider only the sectoral composition across tradable sectors. Return to text
4. For instance, final consumption and investment expenditure shares of tradable sectors in the United States are 11.8 and 29.9 percent, respectively, while for China these numbers are 38.3 and 32.6 percent, respectively. Return to text
5. We use the list of implemented bilateral tariffs at the HS-6 level and aggregate those into sectoral bilateral tariffs. Return to text
6. See Reyes-Heroles et al. (2020) for a detailed description of the model. Return to text
7. Most countries gain because of trade diversion that increases demand for goods produced in countries other than the United States and China. Still, some countries may lose because of negative terms of trade effects, like the case of Greece in our exercises. Return to text
8. Recent work by Flaaen and Pierce (2019) shows that the U.S. tariffs are associated with relative reductions in manufacturing employment and relative increases in producer prices through rising input costs. Return to text
9. We supplement these data with the OECD's input-output (I-O) tables for 2011. Return to text
10. We supplement these data with the United Nations' INDSTAT2 and National Accounts databases. Return to text
Reyes-Heroles, Ricardo, Charlotte T. Singer, and Eva Van Leemput (2021). "The Effect of U.S.-China Tariff Hikes: Differences in Demand Composition Matter," FEDS Notes. Washington: Board of Governors of the Federal Reserve System, March 04, 2021, https://doi.org/10.17016/2380-7172.2845.
Disclaimer: FEDS Notes are articles in which Board staff offer their own views and present analysis on a range of topics in economics and finance. These articles are shorter and less technically oriented than FEDS Working Papers and IFDP papers.