FEDS Notes
December 15, 2025
The Empirical Relationship Between the Tier 1 Leverage Ratio and Community Bank Failures after the Global Financial Crisis
This note uses a logistic regression to model community bank failures in the period from 2008 to 2012 and estimates how the probability of bank failure depends on the tier 1 leverage ratio. Over this five-year period, about 5.4% of the 7,184 U.S. community banks failed. The model fits quite well, correctly classifying 95% of sample banks using only 14 financial characteristics, reported by community banks in their FFIEC call report filings as of Q4 2007.
The model estimates that, on average, a one-percentage-point increase in a community bank's tier 1 leverage ratio as of Q4 2007 reduced its annualized probability of failure in the following five years by about 5 to 8 basis points, depending on the specification. This marginal effect varies substantially across community banks: for "low-risk" and "high-risk" banks, the estimated effect is a 2 and 28 basis point reduction in the annualized probability of failure, respectively.
The analysis also highlights that the financial characteristics of U.S. community banks have changed since 2007, which alters the model estimates. Using bank characteristics from Q4 2007 and Q4 2024, the model estimates that the annualized probability of failure is 1.5% and 0.3%, respectively, and the average marginal effect of the tier 1 leverage ratio is a 5 and 1 basis point reduction in the annualized probability of failure. These results suggest that community banks have become more stable since the Global Financial Crisis.
This note contributes to the body of empirical literature that studies the determinants of bank failures and the role of bank capital in preventing such failures.1 One notable takeaway from this analysis is that the mitigating effect of bank capital on the probability of bank failure in a financial crisis can vary substantially both across community banks and over time. This is partly due to the non-linear nature of bank failures, which in the logistic model induces interaction effects between the marginal effect of capital, the level of existing capital, and other financial characteristics.
1. Description of data and empirical approach
The analysis identifies bank failures by using the list of bank failures publicly available on the Federal Deposit Insurance Corporation's website. Figure 1 provides a visual summary of bank failures in the United States in the 21st century, showing that the largest wave of U.S. bank failures in this century occurred in the period from Q1 2008 to Q4 2012, over which 389 (or about 5.4%) of U.S. community banks failed.
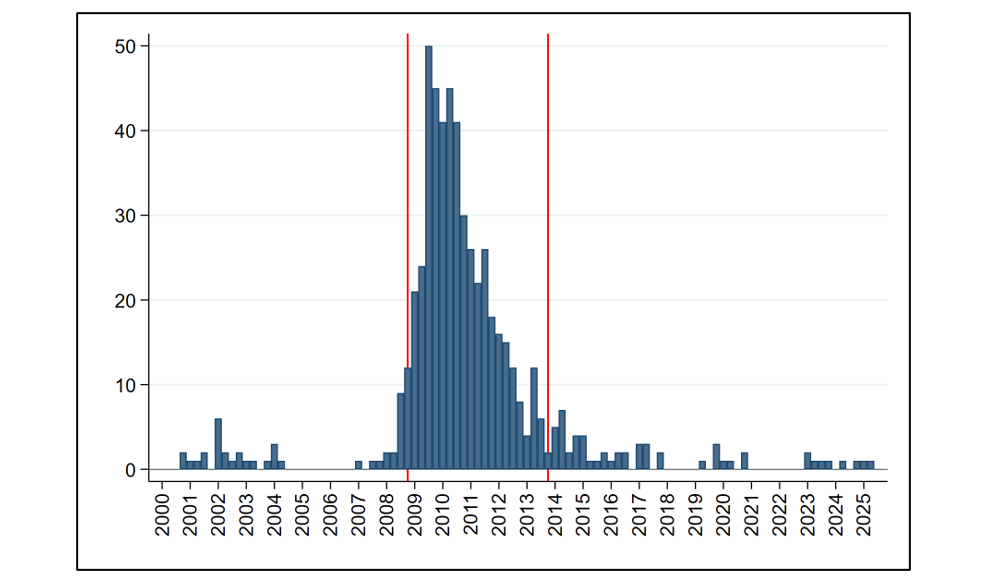
Note: This figure shows the number of bank failures in the United States in each quarter from Q1 2000 to Q2 2025. The two vertical red lines mark the beginning and end of the period from Q1 2008 to Q4 2012 that this analysis uses to model bank failures. Out of the 7,184 U.S. community banks that existed at the end of 2007, 389 (or about 5.4%) failed over this five-year period.
Source: The Federal Deposit Insurance Corporation's list of historical bank failures.
The analysis uses this historical wave of bank failures to identify the effect of a community bank's financial characteristics (fundamentals), including its tier 1 leverage ratio, on its probability of failure over this five-year period. To this end, the analysis applies the following logistic model specification:
$$$$\ln{(p/(1-p))}=\alpha+{\boldsymbol\beta}^\top \boldsymbol{x}+\left({\boldsymbol\gamma}^\top\boldsymbol{x}^2\right),\ \ \ \ \ \ \ \ \ \ \ (1)$$$$
where $$p$$ is the probability of failure in the period from Q1 2008 to Q4 2012, $$\boldsymbol{x}$$ is a vector of bank financial characteristics as of Q4 2007, and $$a$$ is a constant intercept. Additionally, some model specifications in the analysis include the squares of bank financial characteristics, denoted by vector $$\boldsymbol{x}^2$$, which enables bank fundamentals to have a more flexible, quadratic effect on the logit function in (1). Moreover, some model specifications include fixed effects for the states in which the banks are domiciled, replacing the constant $$\alpha$$ by $$α_i$$, to achieve a tighter (i.e., within-state) identification of the effect of bank fundamentals on failure probabilities.2
The set of community bank financial characteristics used in the model is shown in Table 1, which also characterizes the empirical distribution of these characteristics across sample banks. The analysis obtains these financial characteristics using publicly available data reported in FFIEC Call Reports as of Q4 2007 and Q4 2024. Table 5 of the Appendix provides a definition for each financial characteristic.
Table 1: Sample quartiles of explanatory variables used in the logistic model
| Quartile | |||
|---|---|---|---|
| 1st | 2nd | 3rd | |
| Assets ($ million) [not used in the model] | 58.6 | 122.9 | 270.5 |
| Tier 1 leverage ratio (% of assets) | 8.4 | 9.7 | 12.1 |
| 100 x log of assets | 1,097.80 | 1,171.90 | 1,250.80 |
| Asset growth (%, year-on-year) | 1.3 | 5.8 | 12 |
| Loan growth (%, year-on-year) | 1.1 | 7.1 | 14.7 |
| RWA density (% of assets) | 63.1 | 73 | 81.9 |
| Loan-to-deposit ratio (%) | 67.6 | 82.4 | 94.8 |
| Deposit-to-asset ratio (%) | 77.9 | 83.4 | 87.4 |
| Non-performing loans (% of gross loans) | 0.2 | 0.6 | 1.6 |
| Loan loss allowances (% of gross loans) | 1 | 1.2 | 1.5 |
| Cash liquidity ratio (% of short-term liabilities) | 2.7 | 3.8 | 5.7 |
| Net non-core funding dependence (% of assets) | 4.5 | 15.7 | 27.1 |
| STWF funding dependence (% of short-term liabilities) | 6.2 | 11.6 | 18.6 |
| Return on assets (%, annual) | 0.6 | 1 | 1.4 |
| Net interest margin (%, annual) | 3.5 | 4 | 4.6 |
Note: This table shows the quartiles of the explanatory variables used in the logistic model specified in Equation (1), as reported by U.S. community banks as of Q4 2007. Additionally, in the first row, the table shows the quartiles of total assets. The sample consists of 7,184 U.S. community banks. All variables are defined in Table 5 of the Appendix.
Source: FFIEC call report filings.
2. Logistic model estimation and diagnostics
The logistic model specified in Section 1 is estimated using the cross section of the 7,184 U.S. community banks in the sample, measuring their financial characteristics as of Q4 2007. Table 2 shows the estimated marginal effects of these characteristics on the probability of bank failure, as well as goodness-of-fit diagnostics, under different model specifications. The model estimates that, on average, a one-percentage-point increase in a community bank's tier 1 leverage ratio as of Q4 2007 reduced its annualized probability of failure in the following five years by about 5 to 8 basis points, depending on the specification.3
Table 2: Estimated marginal effects of explanatory variables on the annualized probability of community bank failure between 2008 and 2012 (measured in basis points)
| Model version | ||||
|---|---|---|---|---|
| (1) | (2) | (3) | (4) | |
| Tier 1 leverage ratio (% of assets) | –4.7 | –5.2* | –6.6** | –7.8** |
| 100 x log(assets) | 0.2*** | 0.3*** | 0.1* | 0.2** |
| Asset growth (%, year-on-year) | 1.2* | 0.4 | 1.4** | 0.6 |
| Loan growth (%, year-on-year) | –0.2 | 1.2* | –0.2 | 1.2 |
| RWA density (% of assets) | 6.4*** | 5.2*** | 5.8*** | 4.2*** |
| Loan-to-deposit ratio (%) | –0.1 | –0.2 | –0.2 | –0.1 |
| Deposit-to-asset ratio (%) | 2.1* | 1.8 | 1.2 | 1.2 |
| Non-performing loans (% of gross loans) | 28.4*** | 35.2*** | 27.5*** | 32.7*** |
| Loan loss allowances (% of gross loans) | –0.7 | 29.6** | 10.7 | 41.2*** |
| Cash liquidity ratio (% of short-term liabilities) | –3.8 | –3.0 | –2.4 | –2.5 |
| Net non-core funding dependence (% of assets) | 3.5*** | 4.0*** | 3.7*** | 4.0*** |
| STWF funding dependence (% of s.t. liabilities) | 0.3 | –0.2 | 0.2 | 0.2 |
| Return on assets (%, annual) | –20.5*** | –27.1*** | –15.7** | –26.7** |
| Net interest margin (%, annual) | 2.5 | 27.5*** | –5.5 | 14.6 |
| Quadratic terms included | x | x | ||
| State fixed effects | x | x | ||
| Correctly classified overall (%) | 95 | 95 | 95 | 95 |
| Correctly classified survivors (%) | 99 | 99 | 99 | 99 |
| Correctly classified failures (%) | 12 | 13 | 19 | 22 |
| Pseudo R2 | 0.26 | 0.28 | 0.33 | 0.35 |
| Area under the receiver operating curve | 0.88 | 0.88 | 0.9 | 0.91 |
| Number of observations (community banks) | 6,911 | 6,911 | 6,365 | 6,365 |
Note: This table shows the estimated marginal effects of the explanatory variables on the annualized probability of community bank failure over the period from 2008 and 2012, expressed in basis points, under different versions of the logistic model specified in Equation (1). The marginal effects are calculated for the average community bank and tested against zero using robust (White) standard errors.
Source: Model-based estimates obtained using FFIEC call report data.
Overall, the model fits well, correctly classifying 95% of sample banks. The model fit further improves when quadratic terms and state fixed effects are included, which enhances the correct classification of failed banks to 22%. For this reason, the remainder of the analysis uses the last (most complete and best fitting) model specification.
3. Probability of failure as a function of the tier 1 leverage ratio
The logistic model estimated in Section 2 implies that the probability of a community bank's failure in the five-year period from 2008 to 2012 is a decreasing non-linear function of its tier 1 leverage ratio as of Q4 2007. Figure 2 shows this function, indicating that the estimated marginal effect of the tier 1 leverage ratio is higher for banks with lower levels of tier 1 capital.
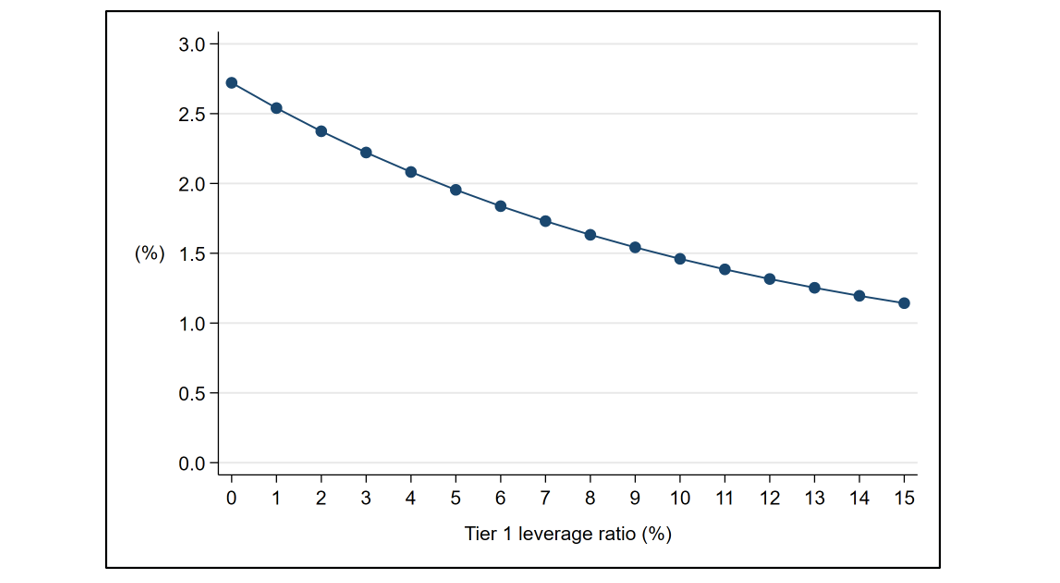
Note: This figure shows the average annualized probability of failure across community banks in the sample as a function of their tier 1 leverage ratios, estimated using the logistic model specified in Equation (1), including quadratic terms and state fixed effects. The model estimates the annualized probability of failure over the five-year period from Q1 2008 to Q4 2012, using financial characteristics reported by 6,365 community banks at the end of Q4 2007.
Source: Model-based estimates obtained using FFIEC call report data.
Importantly, partly due to the non-linearity of the logistic model, there is substantial variation in the effect of tier 1 leverage ratio on the probability of failure both across community banks and over time. The remainder of the analysis explores these differences.
Estimates across community banks with different failure risks
The analysis indicates that community banks with a higher-than-average estimated risk of failure (henceforth, "high-risk banks") significantly differ from community banks with a lower-than-average estimated risk of failure (henceforth, "low-risk banks"), and, consistent with economic theory, the benefits of more tier 1 capital are larger for high-risk banks.
The fundamental differences between low-risk and high-risk community banks are salient from the comparison of financial characteristics in Table 3. At the end of 2007, high-risk banks had, on average, less capital and higher risk-weighted asset densities than low-risk banks. Furthermore, high-risk banks, on average, were twice as large, grew twice as fast, had twice as many non-performing loans, depended twice as much on non-core funding, and were half as profitable as low-risk banks. As the t-test results in the table indicate, these differences are statistically significant.
Table 3: Characteristics of community banks with different failure risks (as of Q4 2007)
| All | Low-risk | High-risk | p-value | |
|---|---|---|---|---|
| Number of community banks in sample | 6,365 | 4,921 | 1,444 | N/A |
| Estimated probability of failure (%) | 6 | 1.3 | 21.9 | 0.000 |
| Estimated probability of failure (%, annualized) | 1.5 | 0.3 | 5.6 | 0.000 |
| Estimated marginal effect of the tier 1 leverage ratio (%) | –7.8 | –1.8 | –28.3 | 0.036 |
| on the annualized probability of failure (bp) | ||||
| Assets (million dollars) | 308.4 | 251.2 | 503.3 | 0.000 |
| Tier 1 leverage ratio (% of assets) | 10.9 | 11.1 | 10.3 | 0.000 |
| Asset growth (%, year-on-year) | 9.4 | 7.5 | 16.1 | 0.000 |
| Loan growth (%, year-on-year) | 12.8 | 10.3 | 21.4 | 0.000 |
| RWA density (% of assets) | 72.5 | 69 | 84.5 | 0.000 |
| Loan-to-deposit ratio (%) | 89.1 | 86.4 | 98.4 | 0.006 |
| Deposit-to-asset ratio (%) | 82 | 82.5 | 80.5 | 0.000 |
| Non-performing loans (% of gross loans) | 1.3 | 1 | 2.2 | 0.000 |
| Loan loss allowances (% of gross loans) | 1.4 | 1.4 | 1.5 | 0.000 |
| Cash liquidity ratio (% of short-term liabilities) | 6.4 | 7.3 | 3.3 | 0.008 |
| Net non-core funding dependence (% of assets) | 16.7 | 11.8 | 33.3 | 0.000 |
| STWF funding dependence (% of short-term liabilities) | 13.9 | 13.7 | 14.8 | 0.003 |
| Return on assets (%, annual) | 0.9 | 1 | 0.5 | 0.000 |
| Net interest margin (%, annual) | 4.1 | 4.1 | 4.2 | 0.000 |
Note: This table shows and compares the average financial characteristics of community banks with lower-than-average ("low-risk") and higher-than-average ("high-risk") estimated probabilities of failure. Additionally, the top of the table shows the estimated probability of failure and the average marginal effect of the tier 1 leverage ratio on the estimated probability of failure. The probability of failure is estimated using the logistic model specified in Equation (1), including quadratic terms and state fixed effects, using the financial characteristics presented in this table, reported by community banks as of Q4 2007. All variables are defined in Table 5 of the Appendix. The right column shows the p-values of t-tests comparing the average characteristics of low-risk and high-risk banks, under unequal sample sizes and variances. Mean differences with absolute t-statistics above 5 are indicated by grey shading.
Source: Model-based estimates obtained using FFIEC call report data.
Due to the significant fundamental differences, the estimated annualized probability of failure is higher for high-risk banks than for low-risk banks (on average, 5.6% and 0.3%, respectively). Relatedly, the marginal effect of the tier 1 capital ratio on the probability of failure is about ten times stronger for high-risk banks than for low-risk banks. Specifically, the model estimates that, on average, a one-percentage-point increase in a high-risk bank's tier 1 leverage ratio as of Q4 2007 reduced its annualized probability of failure in the following five years by 28 basis points.
The difference between high-risk and low-risk community banks is clearly visible in Figure 3, which shows that the estimated probability of failure was both higher and more sensitive to tier 1 capital for high-risk banks than for low-risk banks.
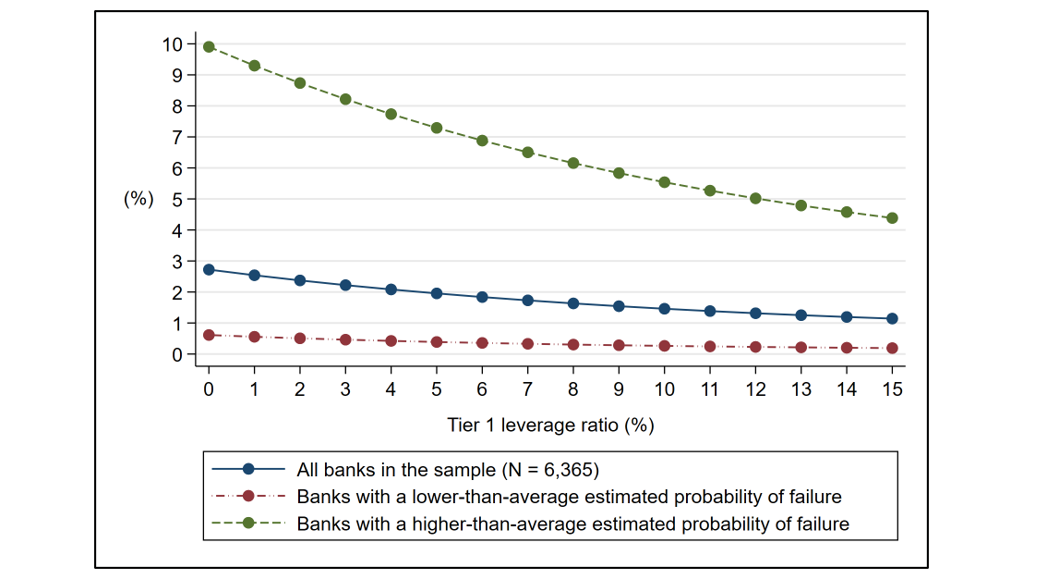
Note: This figure shows the average probability of failure across all, low-risk, and high-risk community banks in the sample as a function of their tier 1 leverage ratios, estimated using the logistic model specified in Equation (1), including quadratic terms and state fixed effects. The model estimates the probability of failure over the five-year period from Q1 2008 to Q4 2012, using financial characteristics reported by 6,365 community banks at the end of Q4 2007.
Source: Model-based estimates obtained using FFIEC call report data.
Estimates for community banks in 2007 and 2024
When assessing the relationship between community bank fundamentals and the probability of failure, it is important to note that the financial characteristics of community banks have changed significantly since the Global Financial Crisis. Table 4 summarizes these fundamental changes, indicating that community banks at the end of 2024 were larger, grew more slowly, relied more on deposit funding and less on non-core funding, and had smaller net interest margins than at the end of 2007.4
Table 4: Characteristics of community banks in 2007 and 2024
| 2007 | 2024 | p-value | |
|---|---|---|---|
| Number of community banks in sample | 6,365 | 3,436 | N/A |
| Estimated probability of failure (%) | 6 | 1.6 | 0.000 |
| Estimated probability of failure (%, annualized) | 1.5 | 0.3 | 0.000 |
| Estimated marginal effect of the tier 1 leverage ratio (%) | –5.3 | –1.5 | 0.159 |
| on the annualized probability of failure (bp) | |||
| Assets (million dollars) | 308.4 | 786.7 | 0.000 |
| Tier 1 leverage ratio (% of assets) | 10.9 | 11.5 | 0.000 |
| Asset growth (%, year-on-year) | 9.4 | 4.5 | 0.000 |
| Loan growth (%, year-on-year) | 12.8 | 6.7 | 0.000 |
| Loan-to-deposit ratio (%) | 89.1 | 75.1 | 0.000 |
| Deposit-to-asset ratio (%) | 82 | 85.5 | 0.000 |
| Non-performing loans (% of gross loans) | 1.3 | 0.7 | 0.000 |
| Loan loss allowances (% of gross loans) | 1.4 | 1.4 | 0.605 |
| Cash liquidity ratio (% of short-term liabilities) | 6.4 | 10.3 | 0.001 |
| Net non-core funding dependence (% of assets) | 16.7 | 3.3 | 0.000 |
| STWF funding dependence (% of s.t. liabilities) | 13.9 | 15 | 0.000 |
| Return on assets (%, annual) | 0.9 | 1 | 0.000 |
| Net interest margin (%, annual) | 4.1 | 3.6 | 0.000 |
Note: This table shows and compares the average financial characteristics of community banks at the end of 2007 and 2024. Additionally, the top of the table shows the average estimated probability of failure and the average marginal effect of the tier 1 leverage ratio on the estimated probability of failure. The probability of failure is estimated using the logistic model specified in Equation (1), including quadratic terms and state fixed effects, using the financial characteristics presented in this table, reported by community banks as of Q4 2007 and Q4 2024, respectively. All variables are defined in Table 5 of the Appendix. The right column shows the p-values of t-tests comparing the average characteristics of low-risk and high-risk banks, under unequal sample sizes and variances. Mean differences with absolute t-statistics above 5 are indicated by grey shading.
Source: Model-based estimates obtained using FFIEC call report data.
Reflecting these changes in bank fundamentals over time, the logistic model estimates that the annualized probability of failure across community banks was significantly lower in 2024 than in 2007 (on average, 0.3% and 1.5%, respectively), which suggests that community banks have become more stable since the Global Financial Crisis. Consistent with this improvement in community bank resilience, the estimated marginal effect of tier 1 capital on their probability of failure has decreased almost fourfold. Specifically, under the model, Q4 2007 and Q4 2024 community bank characteristics imply that a one-percentage-point increase in the tier 1 leverage ratio reduces the annualized probability of failure by 5.3 and 1.5 basis points, respectively.5 This reduction in the marginal effect of the tier 1 leverage ratio is in line with both economic theory (for example, Merton (1974)) and the convex, monotonically decreasing relationship between bank capital and failure shown in Figures 2 and 3, which predict that the benefits of additional capital diminish with higher capital levels and better bank fundamentals.
The effect of improved community bank resilience is visualized in Figure 4, which contrasts the average probability of failure across community banks as a function of their tier 1 leverage ratios estimated using bank characteristics from Q4 2007 and Q4 2024. The chart shows that if community bank fundamentals at the end of 2007 had been like they were at the end of 2024, their probability of failure in a financial crisis would have been about four times lower.
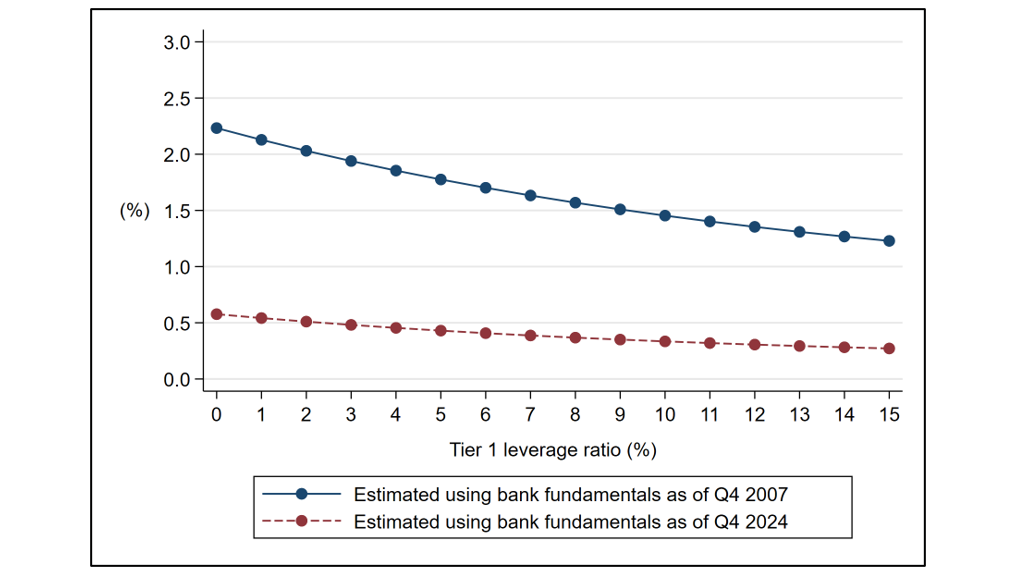
Note: This figure shows the average probability of failure across community banks as a function of their tier 1 leverage ratios, estimated using their financial characteristics as of Q4 2007 and Q4 2024 in the logistic model specified in Equation (1), including quadratic terms and state fixed effects. The model estimates the probability of failure over the five-year period from Q1 2008 to Q4 2012. There are 6,365 and 3,436 community banks in the sample in Q4 2007 and Q4 2024, respectively.
Source: Model-based estimates obtained using FFIEC call report data.
4. Robustness tests
This final section demonstrates the robustness of the empirical analysis to the potential presence of outliers and the specific standard error estimation methodology used. Specifically, the following diagnostic tests show that excluding influential observations or using clustered standard errors leaves the takeaways of the analysis generally unchanged.
Excluding outliers
A comparison of Tables 2 and 5 indicates that the analysis is robust to the presence of outliers. Indeed, as Table 5 shows, excluding influential observations from the sample leaves the marginal effect estimates roughly unchanged, with the estimated marginal effect of the tier 1 leverage ratio becoming somewhat stronger in the specifications with state fixed effects.6 Specifically, the outlier-robust logistic model estimates that, on average, a one-percentage-point increase in a community bank's tier 1 leverage ratio as of Q4 2007 reduced its annualized probability of failure in the following five years by about 5 to 11 basis points, which is a similar, albeit slightly wider, range than estimated by the baseline logistic model in Section 2. This robustness test confirms that the empirical relationships identified in this note are not driven by outliers.
Table 5: Estimated marginal effects of explanatory variables on the annualized probability of community bank failure between 2008 and 2012 (measured in basis points), using a logistic model that excludes outliers
| Model version | ||||
|---|---|---|---|---|
| (1) | (2) | (3) | (4) | |
| Tier 1 leverage ratio (% of assets) | –4.7 | –7.8** | –6.7** | –10.8*** |
| 100 x log(assets) | 0.2*** | 0.2*** | 0.1* | 0.2** |
| Asset growth (%, year-on-year) | 1.2* | 0.5 | 1.4** | 1.5 |
| Loan growth (%, year-on-year) | –0.2 | 1.1 | –0.2 | 0.4 |
| RWA density (% of assets) | 6.4*** | 6.1*** | 5.8*** | 4.4*** |
| Loan-to-deposit ratio (%) | –0.1 | –1.5* | –0.1** | –0.4 |
| Deposit-to-asset ratio (%) | 2.1* | 0.1 | 1.3 | 0.4 |
| Non-performing loans (% of gross loans) | 28.4*** | 35.3*** | 27.6*** | 38.0*** |
| Loan loss allowances (% of gross loans) | –0.7 | 28.2** | 11 | 8.8 |
| Cash liquidity ratio (% of short-term liabilities) | –3.8 | –7.4** | –2.4 | –6.4* |
| Net non-core funding dependence (% of assets) | 3.5*** | 4.0*** | 3.7*** | 4.1*** |
| STWF funding dependence (% of s.t. liabilities) | 0.3 | –0.3 | 0.2 | 0 |
| Return on assets (%, annual) | –20.5*** | –25.5*** | –15.5** | –34.6*** |
| Net interest margin (%, annual) | 2.5 | 30.9*** | –6.1 | 18.9 |
| Quadratic terms included | x | x | ||
| State fixed effects | x | x | ||
| Outliers excluded | x | x | x | x |
| Correctly classified overall (%) | 95 | 95 | 95 | 95 |
| Correctly classified survivors (%) | 99 | 99 | 99 | 99 |
| Correctly classified failures (%) | 12 | 14 | 19 | 24 |
| Pseudo R2 | 0.26 | 0.29 | 0.33 | 0.36 |
| Area under the receiver operating curve | 0.88 | 0.88 | 0.9 | 0.91 |
| Number of community banks (with outliers) | 6,911 | 6,911 | 6,365 | 6,365 |
| Number of community banks (without outliers) | 6,911 | 6,905 | 6,364 | 6,268 |
Note: This table shows the estimated marginal effects of the explanatory variables on the annualized probability of community bank failure over the period from 2008 and 2012, expressed in basis points, under different versions of the logistic model specified in Equation (1). The model is fitted in an outlier-robust way, that is, by iteratively excluding outlier observations until no observations remaining in the sample have a Pregibon (1981) delta-beta influence statistic above 2. The marginal effects are calculated for the average community bank and tested against zero using robust (White) standard errors.
Source: Model-based estimates obtained using FFIEC call report data.
Using clustered standard errors
The empirical analysis is also robust to using clustered standard error estimates, instead of the Huber–White standard error estimates used throughout the analysis, for statistical testing. Clustering standard errors at the state level allows for both the heteroskedasticity of errors terms across banks in different states and the correlation of error terms across banks in the same states. Unreported results confirm that, in both the baseline logistic model and the outlier-robust logistic model introduced above, using this alternative covariance structure for the error terms leaves the statistical significance of the marginal effect estimates generally unchanged. This robustness test suggests that the tier 1 capital ratio's mitigating effect on the probability of community bank failure remains significant under different error term covariance structure assumptions.
5. Appendix
Table Appendix: Definitions of explanatory variables used in the logistic model
Panel A: Model variables
| Variable name | Variable definition |
|---|---|
| Tier 1 leverage ratio (%) | = 100 x (dollar amount of tier 1 capital) / (total assets) |
| 100 x log of assets | = 100 x logarithm of total assets |
| Asset growth (%, year-on-year) | = 100 x year-on-year change in the logarithm of total assets |
| Loan growth (%, year-on-year) | = 100 x year-on-year change in the logarithm of total loans and leases held for investment, net of allowances |
| RWA density (%) | = 100 x (risk-weighted assets) / (total assets) |
| Loan-to-deposit ratio (%) | = 100 x (total loans and leases held for investment, net of allowances) / (total deposits) |
| Deposit-to-asset ratio (%) | = 100 x (total deposits) / (total assets) |
| Non-performing loans (%) | = 100 x (90+ days past due loans and leases + nonaccrual loans and leases) / (total gross loans and leases held for investment, gross of allowances) |
| Loan loss allowances (%) | = 100 x (loan loss allowances) / (total loans and leases held for investment, gross of allowances) |
| Cash liquidity ratio (%) | = 100 x (total cash and balances due from depository institutions) / (short-term liabilities) |
| Net non-core funding dependence (%) | = 100 x (net non-core funding) / (total assets) |
| STWF funding dependence (%) | = 100 x (short-term liabilities – retail deposits) / (short-term liabilities) |
| Return on assets (%, annual) | = 100 x (net income over the past year) / (average total assets over the past year) |
| Net interest margin (%, annual) | = 100 x (interest income minus interest expense over the past year) / (average earning assets over the past year) |
Panel B: Auxiliary variables
| Variable name | Variable definition |
|---|---|
| Short-term liabilities | = (total deposits) + (federal funds purchased) + (securities sold under agreements to repurchase) + (trading liabilities) + (FHLB advances with one year or less remaining maturity) + (other borrowings with one year or less remaining maturity) |
| Net non-core funding | = [See the definition of field K446 in the FFIEC Uniform Bank Performance Report.] |
| Retail deposits | = deposits of individuals, partnerships, and corporations |
| Average earning assets | = [See the definition of field D333 in the FFIEC Uniform Bank Performance Report.] |
References
Berger, A.N. and Bouwman, C.H., 2013. How does capital affect bank performance during financial crises? Journal of Financial Economics, 109(1).
Cole, R.A. and White, L.J., 2012. Déjà vu all over again: The causes of US commercial bank failures this time around. Journal of Financial Services Research, 42(1).
Demirguc‐Kunt, A., Detragiache, E. and Merrouche, O., 2013. Bank capital: Lessons from the financial crisis. Journal of money, credit and Banking, 45(6).
Distinguin, I., Roulet, C. and Tarazi, A., 2013. Bank regulatory capital and liquidity: Evidence from US and European publicly traded banks. Journal of Banking & Finance, 37(9).
Merton, R.C., 1974. On the pricing of corporate debt: The risk structure of interest rates. The Journal of Finance, 29(2), pp.449-470.
Pregibon, D., 1981. Logistic regression diagnostics. The annals of statistics, 9(4).
Vazquez, F. and Federico, P., 2015. Bank funding structures and risk: Evidence from the global financial crisis. Journal of Banking & Finance, 61.
1. See, for example, the empirical studies in Cole and White (2012); Berger and Bouwman (2013); Demirguc-Kunt, Detragiache and Merrouche (2013); Distinguin, Roulet, Tarazi (2013); Vazquez and Federico (2015). Return to text
2. Including state fixed effects in the model controls for unobserved differences in local macroeconomic, market, and regulatory factors shared by community banks domiciled in the same state, which can potentially induce confounding variation in the failure rates across community banks. Return to text
3. Because the logistic model specified in Equation (1) estimates the probability of community bank failure over the five-year period from 2008 to 2012, the estimated probabilities of failure are annualized for easier interpretation and better comparability with results in other studies. Specifically, assuming a deterministic hazard model with constant hazard rate, failure probabilities over the five-year period are converted to annual failure probabilities by using the formula: p(failure, annual) = 1 – [1 – p(failure, five-year)]^(1/5). Return to text
4. This part of the analysis does not use the risk-weighted asset density variable as the rest of the analysis because risk-weighted assets are not reported by banks that opted in to the community bank leverage ratio (CBLR) framework. Keeping this variable in the analysis would drop all CBLR banks from the sample in 2024, thereby potentially leading to a biased comparison between all community banks in 2007 and only non-CBLR-taker community banks in 2024. The bias would result from the endogenous self-selection of CBLR-taker community banks. Return to text
5. For Q4 2007, the estimated marginal effect of the tier 1 leverage ratio on the annualized probability of community bank failure is somewhat lower in Table 4 (–5.3 basis points) than in Table 3 (–7.8 basis points). This is because the model fit slightly changes as a result of omitting the risk-weighted asset variable, which is a conscious and necessary omission done for the sake of unbiased intertemporal comparison, as explained in the previous footnote. Return to text
6. For the sake of this robustness test, we consider observations with a Pregibon (1981) delta-beta influence statistic above 2 outliers. Such observations are "influential" because their removal from the sample has an outsized effect on the model estimates. Return to text
Horvath, Akos (2025). "The Empirical Relationship Between the Tier 1 Leverage Ratio and Community Bank Failures after the Global Financial Crisis," FEDS Notes. Washington: Board of Governors of the Federal Reserve System, December 15, 2025, https://doi.org/10.17016/2380-7172.3929.
Disclaimer: FEDS Notes are articles in which Board staff offer their own views and present analysis on a range of topics in economics and finance. These articles are shorter and less technically oriented than FEDS Working Papers and IFDP papers.