FEDS Notes
October 18, 2017
The Increased Role of the Federal Home Loan Bank System in Funding Markets, Part 2: Recent Trends and Potential Drivers1
Stefan Gissler and Borghan Narajabad
The FHLB system's balance sheet: 2000 to the present
Figure 1 shows the evolution of the combined FHLB system's assets; the left panel shows dollar amounts and the right panel shows percentage shares. About two thirds of FHLBs' assets are advances to members, shown in dark purple. In addition to advances, FHLBs' assets include securities, shown in light purple, which are mainly mortgage-related and, on average, make up about one-fifth of their assets.1 They also hold some liquid assets, including about 7.5 percent of their assets in federal funds, to meet regulatory required contingent liquidity buffer.
The left panel shows that during the first part of the last financial crisis, the FHLB system acted as a lender of next-to-last resort by providing significant funding to FHLB members at a time of severe market stress. FHLBs' advances increased by 50 percent between 2007 and fall 2008, as FHLB members encountered severe difficulties accessing other sources of wholesale funding upon which they had become heavily reliant. FHLB system assets started to contract in the fall of 2008 as members started to use funding provided by the Treasury and the Federal Reserve System. Advances have grown fairly steadily since about 2012 and recently surpassed their pre-crisis level.
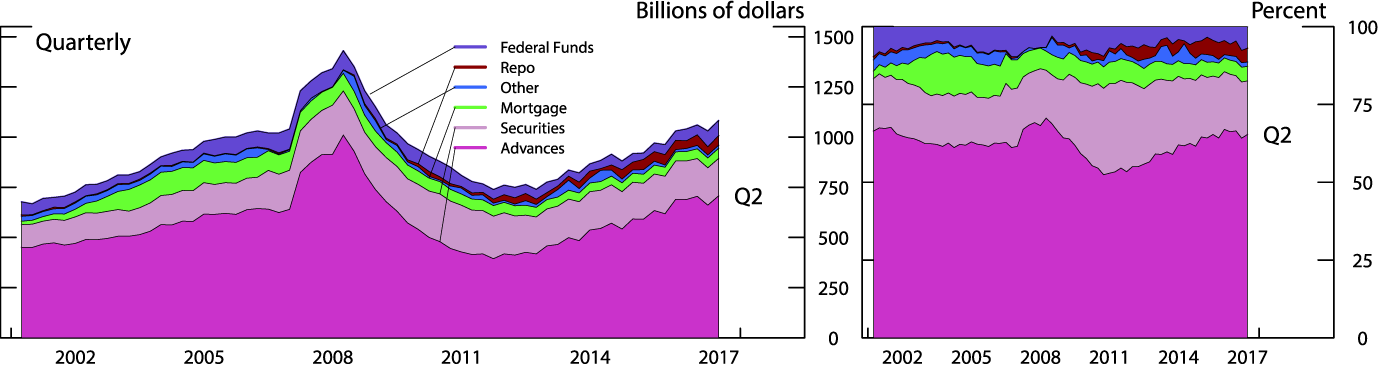
Source: FHLB 10Q and 10K filings.
Figure 2 shows the composition of member firms' borrowing from FHLBs between 2000 and 2017. In 2000, thrifts were the main borrowers of FHLBs, but since then commercial banks and insurance companies have become predominant. In January 2017, borrowing by commercial banks comprised over 65 percent of total advances outstanding. Furthermore, most of these advances were extended to large commercial banks, shown in dark purple. This is a marked shift from the past: Whereas commercial banks with assets over $50 billion accounted for less than 2 percent of overall advances in 2000, their share climbed to around 50 percent by the end of last year.
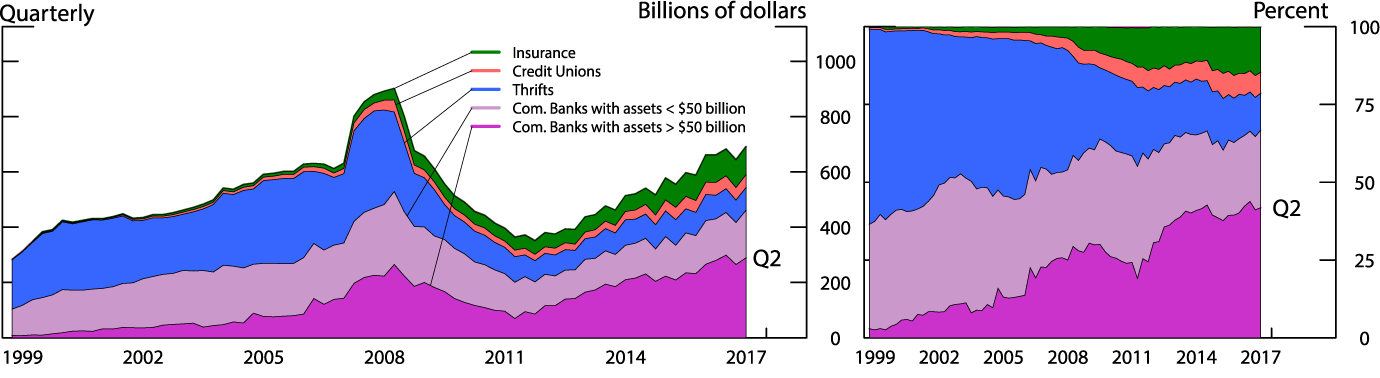
Note: CDFI and Housing Assoc. receive negligible advances. Breakdown of commercial banks is based on CALL report data.
Source: FHLB 10Q and 10K filings.
Potential drivers of the recent trends in the FHLB system's balance sheet
The main motivation for the more recent rise in FHLB borrowing by large banks seems to be their incentive to engage in a "collateral upgrade" to help satisfy the requirements of the Liquidity Coverage Ratio (LCR) that banks are now subject to as part of the Basel III. Banks can post less-liquid assets such as whole mortgage loans to FHLBs as collateral against advances and use the proceeds to buy high quality liquid assets (HQLA). As long as FHLB advances have a remaining maturity of longer than 30 days, this strategy will improve the borrowing banks' LCRs. Also, the favorable treatment of FHLB advances in the LCR helps borrowing banks even with advances due within 30 days.2 Anecdotal evidence suggests that large banks are indeed motivated to borrow from the FHLBs for this reason.3
Figure 3 compares the maturity structure of FHLBs advances (left panel) with the maturity structure of their debt (right panel). While FHLBs do not seem to have significantly altered the maturity structure of their advances (the dark blue area on the left has been fairly steady), the maturity of their debt has shortened (the dark and orange areas on the right have expanded). In 2006 advances were financed with a mix of short-term discount notes and medium-to-long-term bonds. FHLBs tapped short-term funding markets to meet their members' urgent funding needs during the crisis--the hump-shaped red and orange portions of the right panel--but let that short-term debt run off as pressures eased in 2009 and early 2010. However, FHLB's reliance on short-term funding began to increase later in 2010, and by the end of 2016 almost 80 percent of liabilities had a residual maturity of less than 1 year. The share of short-term debt has already exceeded the peak it reached during the crisis. Given the relative stability of the maturity structure of FHLB's assets, this implies a significant increase in FHLBs' maturity transformation -that is, a much larger gap between the maturity of FHLB assets and liabilities.
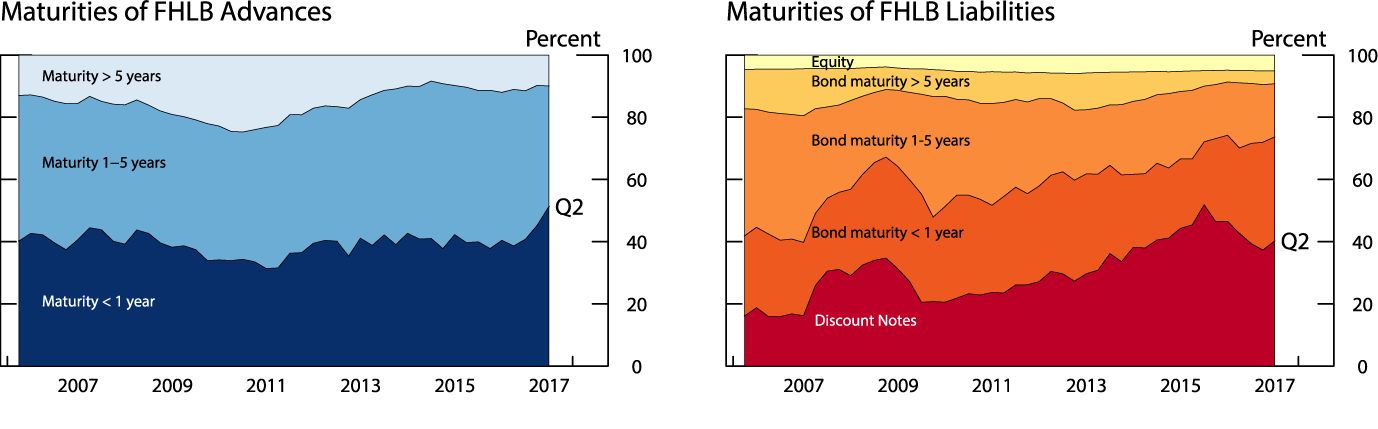
Source: FHLB 10Q and 10K filings.
Although the shift toward FHLB's greater reliance on short-term funding began several years ago, more recently this shift seems to have been given extra support by the effects of the SEC's reform of prime money market funds. In response to the reforms, money market fund managers and investors shifted $1.2 trillion from prime money funds to government money funds, which are restricted to holding essentially only Treasury and agency securities--including those issued by FHLBs--and Treasury- and agency-backed repurchase agreements. As shown in the left panel of Figure 4, at the end of February 2017, almost one-fifth of the money fund industry's three trillion dollar portfolio was invested in FHLB debt.4 Moreover, the share of FHLB debt held by money funds--shown in the middle panel of the figure--has increased sharply, and as of February 2017 stood at more than half of all outstanding FHLB debt.5 And, as shown by the red line in the right panel of the figure, money funds have shortened the weighted average maturity (WAM) of their FHLB debt-holding.6
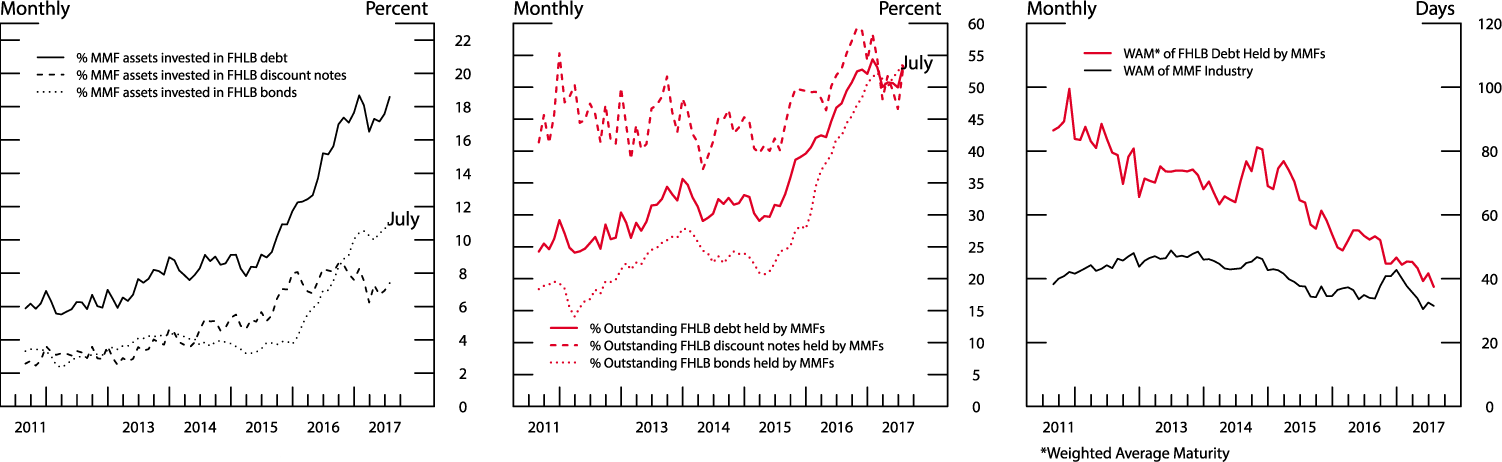
Source: SEC N-MFP filings, FHLB filings.
The money fund reform seems to have given FHLBs a further advantage in their funding costs relative to financial institutions that relied on funding from prime money funds. As shown by the red line in Figure 5, the weighted average rate on FHLB debt held by money funds as of the end of February 2017 was about 10 basis points below that of prime money funds, denoted by the dashed black line.7 As a result, for financial institutions it might have become cheaper to receive funding intermediated by FHLBs than funding from money funds.
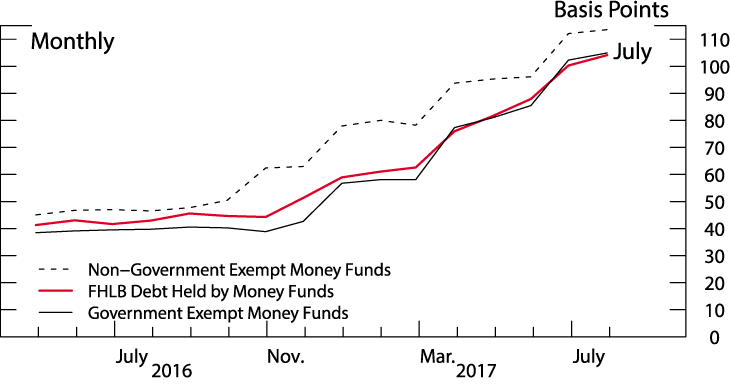
Source: SEC N-MFP filings.
The increased borrowing by large members also seems to have altered the nature of competition among FHLBs. Historically, FHLBs did not compete for business among themselves because members only operated in one district and therefore each had access to only one FHLB. However, many large banks and insurance holding companies now have subsidiaries that are members of multiple FHLBs. Holding companies can and do appear to exercise a degree of market power by switching their borrowing to FHLBs that offer better terms, thereby managing to lower the interest rate spread of their advances over FHLBs' funding costs. Given the sizable amount of maturity transformation by FHLBs, the small margin between interest rate of advances and FHLBs' funding cost could be puzzling. This small margin might be partly due to the fact that most of advances are received by large members with access to low short-term rates. Therefore, at least on the margin, FHLBs may not be able to charge their large members a spread higher than the spread between government and prime money fund yields.
In this part we highlighted some of the recent developments in the FHLB system. Part 3 discusses the implications of these developments for financial stability
1. Authors: Stefan Gissler and Borghan Narajabad (R&S). We would like to thank Alice Moore and Erin Hart for their research assistance, and Celso Brunetti, Mark Carlson, Burcu Duygan-Bump, Joshua Gallin, Diana Hancock, Lyle Kumasaka, Andreas Lehnert, Laura Lipscomb, Patrick McCabe, Michael Palumbo, John Schindler, and Lane Teller for useful comments and insightful discussions. The views expressed in this paper are solely those of the authors and do not necessarily reflect the views of the Board of Governors of the Federal Reserve System or its staff. Return to text
2. The composition of the balance sheet differs across FHLBs and therefore the share of the securities portfolio may be rather small (such as for FHLB New York) or more than one third of the balance sheet (such as for FHLB Chicago). Return to text
3. Borrowing money from an FHLB will increase the bank's net cash outflow by a negligible amount because of the favorable run-off rates applied to FHLB advances due within 30 days. FHLB advances secured by Treasury securities do not count toward outflows. For advances backed by Agency securities, 15 percent of the amount is treated as a cash outflow. The assumed run-off rate for other advances is 25 percent. It is worth noting that the LCR assumptions might be at odds with FHFA's liquidity assumptions. FHFA requires FHLBs to maintain sufficient liquidity to meet the following scenarios: (i) an inability to access debt markets for five days, with all maturing advances renewed except those for very large, highly rated members; and (ii) inability to access debt markets for 15 days, with no maturing advances renewed. (See FHLB 10K filings under "Liquidity Requirement.") However, the LCR gives favorable treatment to the net cash outflow of FHLB advances. That is, the LCR assumes that the big banks will be able to renew most of their FHLB advances even as FHFA seems to assume they might decide not to. Return to text
4. This type of lending by FHLBs is different from the original intended role of FHLBs as credit enhancers for their members. While FHLBs continue to provide critical funding for their smaller members, it is a relatively volatile business. In contrast, lending to LCR members appears to generate more stable interest income. This results in more stable dividends for all FHLBs' members. For this reason even (non-borrowing) small members of FHLBs are interested in increasing advances to large LCR members. Note that FHLB charters provide each member with a single vote, independent of their equity share. Thus, the incentives of small members are essential for understanding FHLBs' decisions. Return to text
5. Almost all of the FHLB debt held by money funds belong to government money funds. About 30 percent of government money funds' two trillion dollar portfolios is invested in FHLB debt. Return to text
6. The share of FHLB discount notes held by money funds is not much higher than its historical levels. However, the share of FHLB bonds held by money funds has more than doubled in the past two years. Return to text
7. Money funds must keep the WAM of their entire portfolio, the black line in the right panel of Figure 6, below the SEC's regulatory limit of 60 days. When money funds held smaller amount of FHLB debt, their FHLB debt holding had a long WAM. As the share of FHLB debt in money funds' portfolio has risen, money funds have shortened the WAM of their FHLB debt holding, to keep the WAM of their entire portfolio low. Return to text
8. As a reference, the black line shows the weighted average yield of government money funds. Return to text
Gissler, Stefan, and Borghan Narajabad (2017). "The Increased Role of the Federal Home Loan Bank System in Funding Markets, Part 2: Recent Trends and Potential Drivers," FEDS Notes. Washington: Board of Governors of the Federal Reserve System, October 18, 2017, https://doi.org/10.17016/2380-7172.2093.
Disclaimer: FEDS Notes are articles in which Board staff offer their own views and present analysis on a range of topics in economics and finance. These articles are shorter and less technically oriented than FEDS Working Papers and IFDP papers.